Transcription
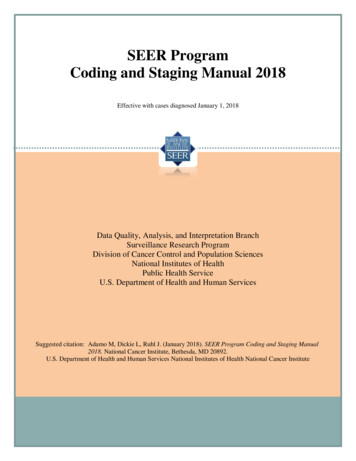
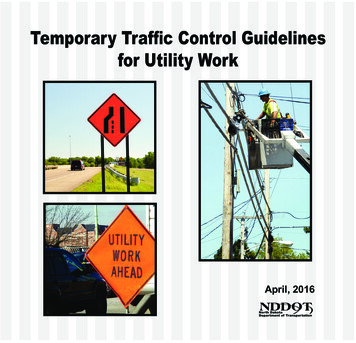
Traffic Safety Facts2015 DataApril 2017Key Findings Of the 35,092 motor vehicle traffic fatalities in 2015 there were 17,114 (49%) thatoccurred in rural areas, 15,362 (44%) thatoccurred in urban areas, and 2,616 (7%)that occurred in unknown areas. According to the 2015 American Community Survey from the U.S. CensusBureau, an estimated 19 percent of the U.S.population lived in rural areas. However,rural fatalities accounted for 49 percent ofall traffic fatalities in 2015. Rural traffic fatalities decreased by 28percent from 23,646 in 2006 to 17,114 in2015. Urban traffic fatalities decreased by18 percent from 18,791 in 2006 to 15,362in 2015. In 2015 the fatality rate per 100 millionvehicle miles traveled was 2.6 times higherin rural areas than in urban areas (1.84 and0.71, respectively). Of the 17,114 rural traffic fatalities in 2015there were 4,758 people (28%) killed inspeeding-related crashes. Of the 15,362urban traffic fatalities in 2015 there were4,171 people (27%) killed in speedingrelated crashes. Rural alcohol-impaired-driving fatalitiesdecreased by 34 percent from 7,493 in2006 to 4,915 in 2015. Urban alcoholimpaired-driving fatalities decreased by24 percent from 5,921 in 2006 to 4,474in 2015. The 2015 National Occupant Protection UseSurvey (NOPUS) observed that the seatbelt use rate among front seat passengervehicle occupants in urban areas was89.4 percent, and rural occupants wereobserved to have a use rate of 86.8 percent. Based on known restraint use in fatalcrashes, 50 percent of rural passengervehicle occupants killed in 2015 wereunrestrained as compared to 46 percent ofurban passenger vehicle occupants killed.DOT HS 812 393Rural/Urban Comparison ofTraffic FatalitiesFor this fact sheet, rural and urban boundaries are determined by the State highway departmentsand approved by the Federal Highway Administration. The State highway departments use the U.S.Census Bureau’s rural and urban boundaries.1In this fact sheet for 2015 the rural and urban information is presented as follows: OverviewTime of DaySpeedingAlcoholRestraint Use Rollover CrashesDriver CharacteristicsNonoccupantsFatalities by StateThis fact sheet contains information on fatal motor vehicle crashes and fatalities based on data fromthe Fatality Analysis Reporting System (FARS). FARS is a census of fatal crashes in the 50 States, theDistrict of Columbia, and Puerto Rico (Puerto Rico is not included in U.S. totals).OverviewIn 2015: There were 32,166 fatal motor vehicle trafficcrashes resulting in 35,092 fatalities.Of these 32,166 fatal traffic crashes, therewere 15,293 (48%) that occurred in ruralareas, 14,414 (45%) that occurred in urbanareas, and 2,459 (8%) that occurred inunknown areas (not enough information todetermine if the crashes were inside the ruralor urban boundaries). Of these 35,092 traffic fatalities, there were17,114 (49%) that occurred in rural areas,15,362 (44%) that occurred in urban areas,and 2,616 (7%) that occurred in unknownareas.According to the 2015 American CommunitySurvey from the U.S. Census Bureau, anestimated 19 percent of the U.S. populationlived in rural areas. However, rural fatalitiesaccounted for 49 percent of all traffic fatalitiesin 2015.Figure 1 presents the motor vehicle traffic fatality trends in the most recent 10-year period for whichdata is available by location (rural and urban): 1200 New Jersey Avenue SE.Washington, DC 205901Rural fatalities decreased by 28 percent from23,646 in 2006 to 17,114 in 2015. Urban fatalities decreased by 18 percent from18,791 in 2006 to 15,362 in 2015.See the U.S. Census Bureau link to define urban and rural areas: tmlNHTSA’s National Center for Statistics and Analysis
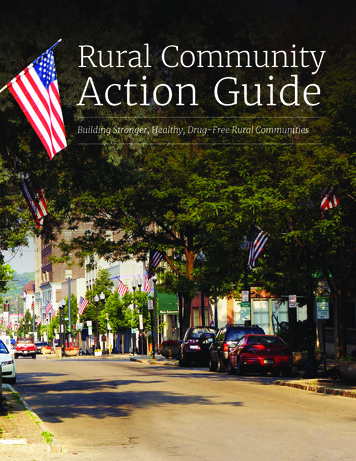
TRAFFIC SAFETY FACTSRURAL/URBAN COMPARISON 2015 DATAFigure 1Motor Vehicle Traffic Fatalities, by Year and Location, 0,0005,00002006200720082015YearSource: FARS 2006-2014 Final File, 2015 Annual Report File (ARF)Figure 2 presents the fatality rates per 100 million vehicle milestraveled (VMT) by location (rural, urban, and overall) in the mostrecent 10-year period for which data are available: The fatality rate in rural areas decreased by 19 percent from 2.28in 2006 to 1.84 in 2015.The fatality rate in urban areas decreased by 25 percent from 0.95in 2006 to 0.71 in 2015.In 2015 the fatality rate was 2.6 times higher in rural areas than inurban areas (1.84 and 0.71, respectively).Figure 2Fatality Rates per 100 Million Vehicle Miles Traveled, by Year and Location, 2006–2015Fatality Rate Per 100 Million 2008YearSources: FARS 2006-2014 Final File, 2015 ARF; VMT – Federal Highway Administration2NHTSA’s National Center for Statistics and Analysis1200 New Jersey Avenue SE., Washington, DC 20590
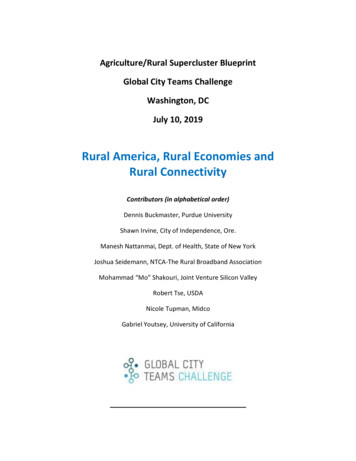
RURAL/URBAN COMPARISON 2015 DATATime of DayTRAFFIC SAFETY FACTSIn 2015:Of the 17,114 rural traffic fatalities in 2015, there were 9,263 (54%)that occurred during the day (6 a.m. to 5:59 p.m.), 7,670 (45%) thatoccurred during the night (6 p.m. to 5:59 a.m.), and 181 (1%) wereunknowns. Of the 15,362 urban traffic fatalities in 2015, there were6,564 (43%) that occurred during the day, 8,723 (57%) that occurredduring the night, and 75 ( 1%) were unknowns. In short, more ruraltraffic fatalities occurred during the day and more urban ftrafficfatalities occurred during the night.SpeedingThe National Highway Traffic Safety Administration considersa crash to be speeding-related if the driver was charged with aspeeding-related offense or if an officer indicated that racing, drivingtoo fast for conditions, or exceeding the posted speed limit was acontributing factor in the crash. Of the 35,092 traffic fatalities, there were 9,557 (27%) who werekilled in speeding-related crashes.Of the 17,114 rural traffic fatalities, there were 4,758 (28%) whowere killed in speeding-related crashes.Of the 15,362 urban traffic fatalities, there were 4,171 (27%) whowere killed in speeding-related crashes.Figure 3 shows the rural and urban percentages of speeding-relatedfatalities in traffic crashes in 2015 by time of day (nighttime – 6p.m. to 5:59 a.m./daytime – 6 a.m. to 5:59 p.m.) and day of week(weekday – Monday 6 a.m. to Friday 5:59 p.m./weekend – Friday 6p.m. to Monday 5:59 a.m.): Half (50%) of rural area speeding-related fatalities occurred atnight and 46 percent occurred over the weekend.Nearly two-thirds (63%) of urban area speeding-related fatalitiesoccurred at night and 48 percent occurred over the weekend.Figure 3Rural and Urban Percentages of Speeding-Related Fatalities in Traffic Crashes, by Time of Day and Day of Week, 30%20%10%0%NighttimeDaytimeWeekdayWeekendSource: FARS 2015 ARFNote: Nighttime – 6 p.m. to 5:59 a.m.; daytime – 6 a.m. to 5:59 p.m.; weekday – Monday 6 a.m. to Friday 5:59 p.m.; weekend – Friday 6 p.m. to Monday 5:59 a.m.Sixty-three percent of drivers involved in urban fatal crashes in2015 were on roadways where the posted speed limits were 50 milesper hour (mph) or less. In rural fatal crashes, 74 percent of driversinvolved were on roadways where the posted speed limit was 55mph or higher.NHTSA’s National Center for Statistics and Analysis1200 New Jersey Avenue SE., Washington, DC 205903
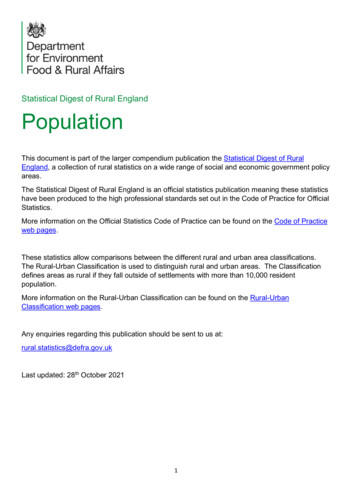
TRAFFIC SAFETY FACTSRURAL/URBAN COMPARISON 2015 DATAAlcoholDrivers are considered to be alcohol-impaired when their bloodalcohol concentrations (BACs) are .08 grams per deciliter (g/dL)or higher. Thus, any fatality occurring in a crash involving a driverwith a BAC of .08 or higher is considered to be an alcohol-impaireddriving fatality.Table 1 presents the number of traffic fatalities and alcoholimpaired-driving fatalities by location (rural/urban).Of the 10,265 alcohol-impaired-driving fatalities in 2015, therewere 4,915 (48%) that occurred in rural areas, 4,474 (44%) thatoccurred in urban areas, and 876 (9%) were unknowns.Alcohol-impaired-driving fatalities decreased by 24 percentfrom 13,491 in 2006 to 10,265 in 2015. Rural alcohol-impaired-driving fatalities decreased by 34percent from 7,493 in 2006 to 4,915 in 2015.In 2015 the proportions of alcohol-impaired-driving fatalitieswere the same between rural and urban areas at 29 percent. Urban alcohol-impaired-driving fatalities decreased by 24percent from 5,921 in 2006 to 4,474 in 2015. Table 1Traffic Fatalities and Alcohol-Impaired-Driving Fatalities, by Location, 2006 and 2015LocationRuralUrbanTotal**Total riving Fatalities BAC .08 NumberPercent7,49332%5,92132%13,49132%Total riving Fatalities BAC .08 NumberPercent4,91529%4,47429%10,26529%Source: FARS 2006 Final File, 2015 ARF*Includes motorcycle riders.**Includes fatalities where location was unknown.Of the 48,613 drivers involved in fatal traffic crashes in 2015, therewere 9,649 (20%) who were alcohol-impaired. Of these alcoholimpaired drivers, there were 4,520 (47%) who were driving in ruralareas at the time of the crash and 4,298 (45%) who were driving inurban areas.The highest percentages of alcohol-impaired drivers involved in fatalcrashes among all age groups in 2015 were drivers 21 to 24 years old(28%), followed by drivers 25 to 34 years old (27%) and 35 to 44years old (23%). Rural and urban alcohol-impaired drivers followedthis trend with 21- to 24-year-olds (29% and 27%, respectively),followed by 25-to 34-year-olds (both 26%) and 35- to 44-year-olds(23% and 21%, respectively).4In cases where drivers involved in fatal crashes in 2015 had one ormore previous convictions for driving while intoxicated (DWI), 53percent of rural drivers were alcohol-impaired and 45 percent ofurban drivers were alcohol-impaired.As shown in Figure 4, the most frequently recorded BAC amongdrinking drivers involved in fatal crashes in rural areas was .16 g/dL.For urban areas, it was .14 g/dL.NHTSA’s National Center for Statistics and Analysis1200 New Jersey Avenue SE., Washington, DC 20590
RURAL/URBAN COMPARISON 2015 DATATRAFFIC SAFETY FACTSFigure 4Distribution of Blood Alcohol Concentration (BAC) of Drivers Involved in Fatal Crashes, by Location, 2015.08 g/dL1.20%1.00%0.80%RuralUrban0.60%0.40%.45 1.09.07.050.00%.030.20%.01Percentage of Drivers Involved1.40%BAC (g/dL)Source: FARS 2015 ARFRestraint UseThe 2015 NOPUS observed that the seat belt use rate among frontseat passenger vehicle (defined as passenger cars and light trucks)occupants in urban areas was 89.4 percent, and rural occupantswere observed to have a use rate of 86.8 percent (see NHTSAResearch Note Seat Belt Use in 2015 – Overall Results, Report No.DOT HS 812 243).Of the 22,441 passenger vehicle occupants killed in 2015, therewere 12,797 (57%) who were killed in rural areas and 8,262 (37%)who were killed in urban areas.Figure 5 presents the 2015 rural and urban percentages (basedon known restraint use) of unrestrained passenger vehicleoccupant fatalities by vehicle type (passenger cars and lighttrucks including pickup trucks, SUVs, and vans). In 2015 (basedon known restraint use): Fifty percent of rural passenger vehicle occupants killed wereunrestrained as compared to 46 percent of urban passengervehicle occupants killed.Under two-thirds (61%) of rural pickup truck occupants killedwere unrestrained – the highest percentage of any passengervehicle occupants killed among both rural and urban areas.Figure 5Rural and Urban Percentages of Unrestrained* Passenger Vehicle Occupant Fatalities, by Vehicle Type, 44%41%42%46%30%20%10%0%Passenger CarsLight Trucks – AllPickup TrucksSport Utility VehiclesVansPassenger VehiclesSource: FARS 2015 ARF*Based on known restraint use.NHTSA’s National Center for Statistics and Analysis1200 New Jersey Avenue SE., Washington, DC 205905
TRAFFIC SAFETY FACTSRURAL/URBAN COMPARISON 2015 DATARollover CrashesNonoccupantsOf the 12,797 rural passenger vehicle occupants killed in 2015,there were 4,829 (38%) who were in vehicles that rolled over; of the8,262 urban passenger vehicle occupants killed, there were 1,963(24%) who were in vehicles that rolled over. Data further showsthat 66 percent of rural and 63 percent of urban passenger vehicleoccupants killed were unrestrained in rollover vehicles (based onknown restraint use).Nonoccupants are defined as pedestrians, pedalcyclists, or othernonoccupants. In 2015:SUVs involved in rural fatal crashes in 2015 experienced the highestrollover percentage at 36 percent. Other rural rollover percentageswere 30 percent for pickup trucks, 20 percent for passenger cars,22 percent for vans, and 16 percent for large trucks. In urban areas,vehicles experienced lower rollover percentages: 18 percent forSUVs, 15 percent for pickup trucks, 9 percent for passenger cars, 8percent for vans, and 8 percent for large trucks.Driver CharacteristicsRural drivers involved in fatal crashes in 2015 were found to havea higher percentage of valid driver’s licenses than urban drivers(87% and 84%, respectively).There were 22,150 drivers killed in motor vehicle traffic crashes in2015. Sixty-one percent of rural drivers died at the scenes of thecrashes, compared to 33 percent of urban drivers. Data also showsthat 40 percent of all drivers killed were transported to hospitals and3 percent of these drivers died en route. Rural drivers represented57 percent of drivers who died en route to hospitals compared to 42percent for urban drivers. Of the 5,376 pedestrians killed in motor vehicle traffic crashes,1,160 (22%) occurred in rural areas, 3,704 (69%) occurred inurban areas, and 512 (10%) were unknowns.Of the 818 pedalcyclists killed in motor vehicle traffic crashes,214 (26%) occurred in rural areas, 492 (60%) occurred in urbanareas, and 112 (14%) were unknowns.Fatalities by StateFor each State and the District of Columbia in 2015, Table 2 presentsthe number and percentage of rural and urban traffic fatalities.Puerto Rico is included in this table, but not included in the overallU.S. total.In 2015, the total number of unknowns was unusually highercompared to previous years because of six States: Florida (1,248),Texas (804), Maryland (307), Alabama (120), New Jersey (47), andIdaho (20).Additional State/county-level data is available at NHTSA’s StateTraffic Safety Information website: https://cdan.nhtsa.gov/stsi.htm.The suggested APA format citation for this document is:National Center for Statistics and Analysis. (2017, April). Rural/urban comparison of traffic fatalities: 2015 data. (TrafficSafety Facts. Report No. DOT HS 812 393). Washington, DC:National Highway Traffic Safety Administration.For More Information:Information on traffic fatalities is available from the National Center for Statistics and Analysis,NSA-230, 1200 New Jersey Avenue SE., Washington, DC 20590. NCSA can be contacted at800-934-8517 or by e-mail at ncsarequests@dot.gov. General information on highway traffic safetycan be found at www.nhtsa.gov/NCSA. To report a safety-related problem or to inquire about motorvehicle safety information, contact the Vehicle Safety Hotline at 888-327-4236.Other fact sheets available from the National Center for Statistics and Analysis are Alcohol-ImpairedDriving, Bicyclists and Other Cyclists, Children, Large Trucks, Motorcycles, Occupant Protection,Older Population, Passenger Vehicles, Pedestrians, School Transportation-Related Crashes, Speeding,State Alcohol Estimates, State Traffic Data, Summary of Motor Vehicle Crashes and Young Drivers.Detailed data on motor vehicle traffic crashes are published annually in Traffic Safety Facts:A Compilation of Motor Vehicle Crash Data from the Fatality Analysis Reporting System and theGeneral Estimates System. The fact sheets and annual Traffic Safety Facts report can be found athttps://crashstats.nhtsa.dot.gov/.6NHTSA’s National Center for Statistics and Analysis1200 New Jersey Avenue SE., Washington, DC 20590
RURAL/URBAN COMPARISON 2015 DATATRAFFIC SAFETY FACTSTable 2Rural and Urban Traffic Fatalities, by State, iaColoradoConnecticutDelawareDistrict of kaNevadaNew HampshireNew JerseyNew MexicoNew YorkNorth CarolinaNorth DakotaOhioOklahomaOregonPennsylvaniaRhode IslandSouth CarolinaSouth est VirginiaWisconsinWyomingU.S. TotalPuerto %100%100%100%Source: FARS 2015 ARFNHTSA’s National Center for Statistics and Analysis1200 New Jersey Avenue SE., Washington, DC 20590712982-040617-v3
in 2015. Figure 1 presents the motor vehicle traffic fatality trends in the most recent 10-year period for which . data is available by location (rural and urban): Rural fatalities decreased by 28 percent from 23,646 in 2006 to 17,114 in 2015. Urban fatalities decreased by 18 percent from 18,791 in 2006 to 15,362 in 2015. 1