Transcription
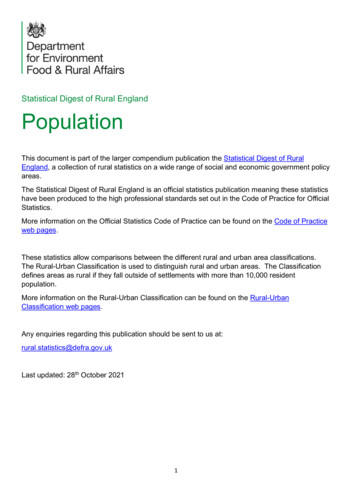
Statistical Digest of Rural EnglandPopulationThis document is part of the larger compendium publication the Statistical Digest of RuralEngland, a collection of rural statistics on a wide range of social and economic government policyareas.The Statistical Digest of Rural England is an official statistics publication meaning these statisticshave been produced to the high professional standards set out in the Code of Practice for OfficialStatistics.More information on the Official Statistics Code of Practice can be found on the Code of Practiceweb pages.These statistics allow comparisons between the different rural and urban area classifications.The Rural-Urban Classification is used to distinguish rural and urban areas. The Classificationdefines areas as rural if they fall outside of settlements with more than 10,000 residentpopulation.More information on the Rural-Urban Classification can be found on the Rural-UrbanClassification web pages.Any enquiries regarding this publication should be sent to us at:rural.statistics@defra.gov.ukLast updated: 28th October 20211
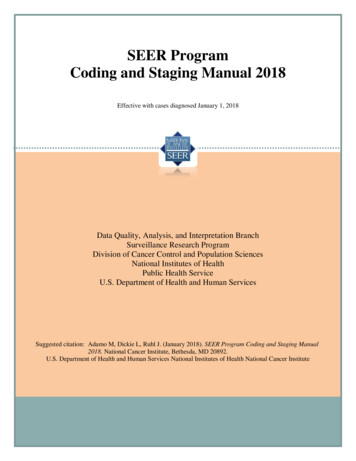
Rural population and migrationMid-year population 2020 In 2020 the mid-year population estimate (basedon Lower Super Output Areas, LSOAs) forEngland was 56.6 million, of which 9.7 million(17.1 per cent) lived in rural areas and 46.9million (82.9 per cent) lived in urban areas. In 2011 the more detailed Census output areabased rural population was 9.3 million (17.6 percent) while the mid-year population estimatebased on LSOAs was 9.1 million (17.2 per cent).9.7 million people live in rural areas;that is 17% of England’s populationFurther explanation can be found in footnote 1 In comparing population estimates at LSOA level there was an increase in the ruralpopulation from 9.1 million in 2011 (LSOA-based) to 9.7 million in 2020 (LSOA-based),however the proportion of the total population has fallen from 17.2 per cent to 17.1 per centover the same time period, as the urban population has increased at a faster rate. Within rural areas, 0.5 million people lived in sparse settings in 2020.2020 Mid-year population estimatesPopulationProportion (%)RuralRural Town and Fringe- those in a sparse settingRural Village and Hamlet- those in a sparse .19.30.37.90.5UrbanUrban Major ConurbationUrban Minor ConurbationUrban City and Town- those in a sparse 0082.935.93.643.40.2England56,550,100100.0 9.7 million people, or 17.1 per cent of the population, lived in rural areas in 2020. Around 502,200 people, or 0.9 per cent of the population lived in rural settlements in a sparsesetting. A further table of the mid-year population estimates broken down by detailed rural-urbanclassification covering 2011 to 2020 is available in the rural living supplementary data tables.Population by agePercentage of population within age bands by rural-urban classification (LSOA) in England, 20202
The population in rural areas has a higher proportion of older people compared with urbanareas. In 2020, the most prominent age groups in rural areas are 50 to 54 and 55 to 59 with 7.7per cent and 8.0 per cent of the rural population, respectively, while the most prominentage groups in urban areas are 25 to 29 and 30 to 34 with 7.2 per cent and 7.2 per cent ofthe urban population, respectively. A table of 2020 mid-year population estimates broken down by age band and detailedrural-urban classification is available in the rural living supplementary data tables.3
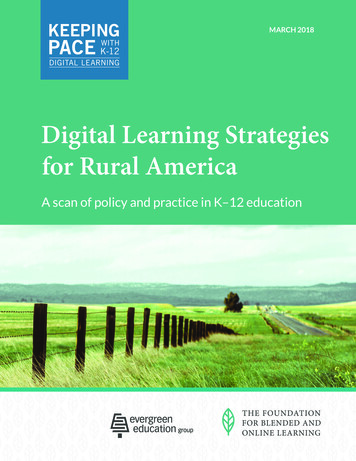
Percentage of population aged 65 and over by rural-urban classification (LSOA) in England, 2020 The rural population has a higher proportion of those aged 65 and over, at 25.4 per cent,compared with the urban population where 17.1 per cent are 65 and over.17.1% of the urban population is aged65 or over25.4% of the rural population is aged65 or over The population of areas in a sparse setting have the highest proportion of those aged 65and over, particularly settlements that are rural village and dispersed in a sparse settingwhich have 30.7 per cent of the population aged 65 and over.Population aged 65 and over as a percentage of total 2020 mid-year populationPopulation aged65 and over2,454,800Proportion aged65 and over 0.78,009,20017.1Urban major conurbation2,958,90014.6Urban minor 4,00018.5RuralRural town and fringe- those in a sparse settingRural village and hamlet- those in a sparse settingUrbanUrban city and town- those in a sparse settingEngland4
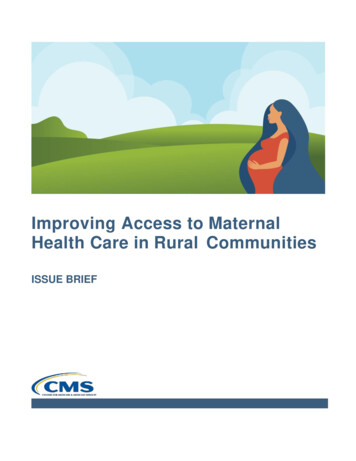
Maps showing the geographic relationship between the rural and urban populations at lower super output area level (LSOA) and areaswhere the percentage of population of over 65-year olds are most concentratedLower super output area classification of England (2011)Source: ONS, Defra, RUC2011 Crown Copyright and database rights 2021, Defra, No. 10002286Percentage of population over the age of 65 years (2020)Source: ONS, Defra, Mid-year population estimates for 2020 at LSOA level5
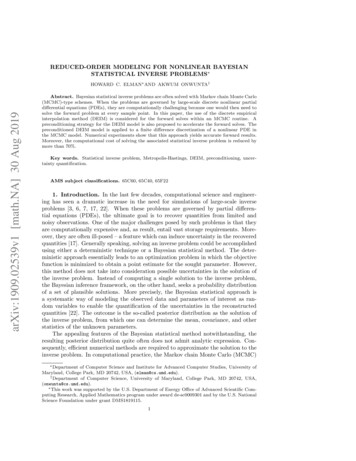
Average age of the populationAverage age in rural and urban areas in England, 2002 to 2020 In 2020, the average age of the population in rural village and dispersed areas was 45.9years and in rural town and fringe areas it was 44.3 years, compared with the average forEngland of 40.3 years. The average age was lowest in urban major conurbations at 37.8 years. The average age in rural areas was 45.1 years in 2020, 5.7 years older than in urban areas.The gap in average ages between rural and urban areas widened from 3.4 years in 2002. The average age in England increased by 1.6 year between 2002 and 2020, but in rural townand fringe areas it increased by 3.2 years and in rural village and dispersed areas by 4.0years. A table of average age broken down by detailed rural-urban classification covering 2002 to2020 is available in the rural living supplementary data tables.6
Population changeIndex of population change, 2011 to 2020, 2011 1007
Both rural and urban areas have seen an increase in overall population between 2011 and2020. Rural has increased by 6.0 per cent and urban by 6.6 per cent. Within rural areas, the greatest rate of population increase was in rural town and fringe areas(6.4 per cent), within urban areas it was in urban major conurbation (7.3 per cent). Rural villages and hamlets in sparse settings showed the smallest rate of population increasewithin rural areas (2.3 per cent), in urban areas it was urban city and town in a sparse setting(1.2 per cent). A table of indexed population change broken down by detailed rural-urban classificationcovering 2011 to 2020 is available in the rural living supplementary data tables.8
Ethnicity Overall, ‘white’ is the majority ethnic group in both rural and urban areas, however urban areasare more ethnically diverse than rural areas. In 2020, the ‘white ethnic’ group accounted for 96.8 per cent of the rural population, comparedwith 81.7 per cent in urban areas. The proportion of ‘minority ethnic’ groups has fallen slightly over the last 5 years in both ruraland urban areas, falling by 0.8 and 0.1 percentage points respectively since 2016. Diversity of ‘minority ethnic’ groups differs between rural and urban areas. In rural areas thesecond largest group is the ‘Mixed / Multiple ethnic group’ while in urban areas it is the ‘Asianethnic’ group. The smallest group proportionally in rural areas is the ‘‘black, African, Caribbeanor black British’ group, while in urban areas it is the ‘Mixed / Multiple ethnic group’.Ethnic groups as a percentage of population in rural and urbans areas, England, 2016 and 2020Detail for all minority ethnic group population in rural and urban areas, England, 2016 & 20209
Ethnic diversity decreases the more sparsely populated the area is. In 2020 ‘minority ethnic’groups accounted for 1.5 per cent of those in rural areas in a sparse setting. Tables detailing ethnic groups in rural and urban areas in 2016 and 2020, and a more detailedrural-urban breakdown for 2020 are available in the rural living supplementary data tables.Source: Office for National Statistics, Labour Force Survey, via Annual Business Inquiry (abi2@ons.gov.uk)10
Population at local authority levelOften statistics are compiled at local authority level when that is the geography of the original data, in which casethe rural urban classification for local authorities is used, as defined by April 2020 Local Authority boundaries.This is different from looking at the population using the more detailed rural-urban classification as it is based onwhole local authorities. The whole population in an authority will be attributed to the class assigned to theauthority. So an authority that is Mainly Rural or Largely Rural and hence classed as Predominantly Rural will havethe whole population counted as being in a Predominantly Rural area, even those living in an urban settlementwithin that authority, while all those living in a rural area but within an authority classed as Urban with SignificantRural or Predominantly Urban will not be counted in the Predominantly Rural figure. In 2020, 12.0 million people lived in a Predominantly Rural area, 21.3 per cent of the Englandpopulation. 53 per cent of the population in Predominantly Rural areas are over the age of 44, which is thewhich is 1 per cent higher than in 2019. In comparison, 41 per cent of the population in Predominantly Urban areas are over the age of44, which is 1 per cent higher than in 2019 as well. The population in Predominantly Rural areas has increased by 6.4 per cent between 2011 and2020, compared with 6.5 per cent for England as a whole and 6.6 per cent in PredominantlyUrban areas. However, it is longer-term comparisons that highlight significant shifts in the age structure.Comparisons have been made between 2001 and 2015 to show this. Predominantly Rural areas have proportionately seen large falls in the population aged 30 to39 and higher proportional increases in the older population between 2001 and 2015. The population aged 65 and over increased by 37 per cent in Predominantly Rural areasbetween 2001 and 2015, compared with 17 per cent in Predominantly Urban areas. Between 2001 and 2015 Predominantly Rural areas have seen an increase of 7 per cent ininfants (0 to 4-year olds) compared with a 22 per cent increase in Predominantly Urban areas.2020 Local Authority District mid-year population estimatesMainly RuralLargely RuralUrban with Significant RuralUrban City and TownUrban Minor ConurbationUrban Major ConurbationPredominantly RuralPredominantly UrbanEngland PopulationProportion 056,550,00021.366.0100.0Further tables broken down by detailed local authority rural-urban classification covering 2011to 2020 and broken down by age band for 2020 are available in the rural living supplementarydata tables.11
The charts below show longer-term changes in the populations for Predominantly Rural and Predominantly Urban areas, by age band,comparing 2001 and 2015.Population in Predominantly Rural and Predominantly Urban areas by age bands, 2001 and 2015, England(scales in the charts differ and so are not directly comparable. The 2011 rural urban classification has been applied to both years to enable comparison)Predominantly Rural areas :Predominantly Urban areas:90 90 1540060080010002015A table broken down by broad local authority rural-urban classification and age bands for both 2001 and 2015 and the change between the twoyears is available in the rural living supplementary data tables.12
Population in Predominantly Rural and Predominantly Urban areas by age bands, 2001 and 2015, England(scales in the charts differ and so are not directly comparable. The 2011 rural urban classification has been applied to both years to enable comparison)90 0Thousands50015002015 Predominantly rural2015 Predominantly urban2001 Predominantly rural2001 Predominantly urban25003500A table broken down by broad local authority rural-urban classification and age bands for both 2001 and 2015 and the change between the twoyears is available in the rural living supplementary data tables.13
Percentage change in population in Predominantly Rural and Predominantly Urban areas by age bands, between 2001 and 2015, England(scales in the charts differ and so are not directly comparable. The 2011 rural urban classification has been applied to both years to enable comparison)Predominantly Rural areas:Predominantly Urban areas:90 90 er cent-20-10010203040506070Per centA table broken down by broad local authority rural-urban classification and age bands for both 2001 and 2015 and the change between the two years isavailable in the rural living supplementary data tables.14
Internal migrationIn the analysis presented below internal migration refers to population migration occurring between localauthorities within the UK and the outcome is shown for local authorities in England, including the results ofmigration to and from the rest of the UK. Migration between the same class of authority will have no net effect onthe population for that class and is excluded.As the analysis is using data for local authority areas, it does not distinguish the type of settlement a migrant hasmoved to. So, in the case of migration to an authority classed as a Predominantly Rural area this could be migrationto an urban settlement within that authority. Similarly, migration to an authority classed as a Predominantly Urbanarea could be migration to a rural settlement within that Predominantly Urban area.The latest migration analysis is for the year to June 30th 2020 so is mostly for the period prior to the Covid-19pandemic.Internal migration, England, 2004/05 to 2019/20Note: The RUC01 for Local Authorities has been applied to all data up to 2009/10. Data for 2010/11 has been classified usingboth RUC01 and RUC11 to show the comparison. From 2011/12 onwards the RUC11 for Local Authorities has been applied. Between 2004/05 and 2008/09 the general trend for internal migration in England was for netmigration to Predominantly Rural areas and net migration from Predominantly Urban areas,although the extent of net migration to Predominantly Rural areas was falling.Since 2008/09 there has been an increase in the rate of net migration to Predominantly Ruralareas.For 2019/20 in Predominantly Rural areas there was net internal migration inwards of 97,500people. Within that Largely Rural areas saw net internal migration inwards of 53,600 peopleand Mainly Rural areas saw net internal migration inwards of 43,900 in 2019/20 (which wouldinclude migration between these two categories).In contrast, for Predominantly Urban areas there was net internal migration outwards of149,100. This included net internal migration outwards from London of 101,400 (including toother Predominantly Urban areas).A table of internal migration figures broken down by detailed local authority rural-urbanclassification covering 2004/05 to 2019/20 is available in the rural living supplementary datatables.15
The table below provides a matrix of the internal (within UK) migration movements between the different classes ofauthority in 2019/20.Internal (within UK) migration between different classes of authority, 2019/20OutwardPredominantlyRuralUrban withSignificantRuralPredominantlyUrbanRest of the UKInwardPredominantlyRuralthousandsUrban withSignificantRuralPredominantlyUrbanRest ofthe 35.420.412.957.4Total inwards426.9313.2482.2Note: excludes migration within the same class of authority110.90.0Net internal (within UK) migration between Predominantly Rural and Predominantly Urban areas and otherclasses of authorityUrban with Significant RuralPredominantly UrbanRest of the UKNet migration for PredominantlyRural areas thousands16.384.6-3.497.5Predominantly RuralUrban with Significant RuralRest of the UKNet migration for PredominantlyUrban areasthousands-84.6-51.3-13.2-149.1In 2019/20 Predominantly Rural areas saw net migration from Predominantly Urban areas of84,600 people (325,400 inwards less 240,800 outwards), and from Urban with Significant Ruralareas of 16,300 people (81,100 inwards less 64,900 outwards). There was a net outwardmigration from Predominantly Rural areas to the rest of the UK of 3,400 people (20,400inwards less 23,800 outwards).Net inward migration to Predominantly Rural areas in 2019/20 increased the PredominantlyRural population by 0.8 per cent, compared with a 0.4 per cent increase in 2010/11.Net outward migration from Predominantly Urban areas in 2019/20 reduced the PredominantlyUrban population by 0.4 per cent, compared with a 0.2 per cent reduction in 2010/11.Notes: Internal migration is defined as residential moves between local authorities. Moves within a single local authority areexcluded, as are international moves into or out of the UK. These statistics are based on a combination of administrative dataand represent the best available source of information on internal migration. Further information on the data sources andmethods, and their limitations, is available via the ONS internal migration methodology webpage methodology/index.html).Source: Defra analysis of ONS data - Annual internal Migration within the United Kingdom to June et16
Internal migration by age For some years there has been net internal migration (within the UK) inwards to PredominantlyRural areas. This has been the case across all age bands except for 17 to 20-year olds. In2019/20 within the overall net internal migration to Predominantly Rural areas of 97,500, therewas net internal migration outwards of 17 to 20 years olds of 34,100.Net outward migration of 17 to 20 years olds can be anticipated as these are the ages whenstudents are most likely to move from home for higher education, with the likelihood that highereducation establishments will be mostly found in the more urban areas.In 2019/20 net migration of 17 to 20-year olds 34,100 The pattern of inward migration to Predominantly Rural areas has been consistent from at least2011 onwards (the earliest year currently analysed by age band).Net internal (within the UK) migration for Predominantly Rural and Predominantly Urban areas, by age band, midyear 2020, England17
Net internal migration (within UK) to Predominantly Rural areas by age bands, mid-year 2011 to mid-year 2020,England Breaking the migration patterns down to equal 5-year age bands, in 2019/20 there was netoutward migration for 15 to 19-year olds from Predominantly Rural areas of 25,400 whichwould include, as above, students moving elsewhere for higher education. For the 20 to 24year old age bracket the pattern of movement reverts to net inward migration of 9,600 toPredominantly Rural areas. There was net inward migration for 25 to 29-year olds of around7,500. The largest net inward migration to Predominantly Rural areas for adults occurred for 30 to 34year olds (13,000 people) and 35 to 39-year olds (12,300 people). Net inward migration for theage bands from 40 to 44-year olds - 65 to 69-year olds, was between 6,100 and 9,100 peoplefor each five-year age band. Migration occurred between Predominantly Rural areas and Urban with Significant Rural areasand the rest of the UK, but the largest net inward migration to Predominantly Rural areas wasfrom Predominantly Urban areas. Not surprisingly, the opposite migration patterns weretherefore seen for Predominantly Urban areas. Indeed, for most age bands the equivalentopposite net migration was greater, reflecting migration also occurring between PredominantlyUrban areas and Urban with Significant Rural areas and the rest of the UK. A table of internal migration figures for rural areas broken down by broad age bands covering2011 to 2020 is available in the rural living supplementary data tables. A table using moredetailed age bands is also available broken down by broad local authority rural-urbanclassification for 2020.Notes: Internal migration is defined as residential moves between local authorities. Moves within a single local authority areexcluded, as are international moves into or out of the UK. These statistics are based on a combination of administrative data andrepresent the best available source of information on internal migration. Further information on the data sources and methods, and18
their limitations, is available via the ONS internal migration methodology webpage methodology/index.html)Source: Defra analysis of ONS data - Annual internal Migration within the United Kingdom to June et19
The average age was lowest in urban major conurbations at 37.8 years. The average age in rural areas was 45.1 years in 2020, 5.7 years older than in urban areas. The gap in average ages between rural and urban areas widened from 3.4 years in 2002. The average age in England incre