Transcription
8THE UNIVERSITY OF THE STATE OF NEW YORKGRADE 8INTERMEDIATE-LEVELSCIENCE TESTWRITTEN TESTJUNE 4, 2018Student NameSchool NameThe possession or use of any communications device is strictly prohibited when taking thisexamination. If you have or use any communications device, no matter how briefly, yourexamination will be invalidated and no score will be calculated for you.Print your name and the name of your school on the lines above.The questions on this test measure your knowledge and understanding of science.The test has two parts. Both parts are contained in this test booklet.Part I consists of 45 multiple-choice questions. Record your answers to these questions on theseparate answer sheet. Use only a No. 2 pencil on your answer sheet.Part II consists of 40 open-ended questions. Write your answers to these questions in thespaces provided in this test booklet.You may use a calculator to answer the questions on the test if needed.You will have two hours to answer the questions on this test.DO NOT TURN THIS PAGE UNTIL YOU ARE TOLD TO DO SO.Copyright 2018THE UNIVERSITY OF THE STATE OF NEW YORKTHE STATE EDUCATION DEPARTMENTALBANY, NEW YORK 12234
Part IDIRECTIONSThere are 45 questions on Part I of the test. Each question is followed by three or fourchoices, numbered 1 through 4. Read each question carefully. Decide which choice is thebest answer. On the separate answer sheet, mark your answer in the row of circles for eachquestion by filling in the circle that has the same number as the answer you have chosen.Read the sample question below.Sample QuestionEarth gets most of its light from(1)(2)(3)(4)the starsthe Sunthe Moonother planetsThe correct answer is the Sun, which is choice number 2. On your answer sheet, look atthe box showing the row of answer circles for the sample question. Since choice number 2is the correct answer for the sample question, the circle with the number 2 has been filledin.Answer all of the questions in Part I in the same way. Mark only one answer for eachquestion. If you want to change an answer, be sure to erase your first mark completely.Then mark the answer you want.You will not need scrap paper. You may use the pages of this test booklet to work out youranswers to the questions.You may use a calculator if needed.When you are told to start working, turn the page and begin with question 1. Work carefullyand answer all of the questions in Part I.When you have finished Part I, go right on to Part II. Answer all of the questions in Part II.Grade 8 Science – June ’18[3][OVER]
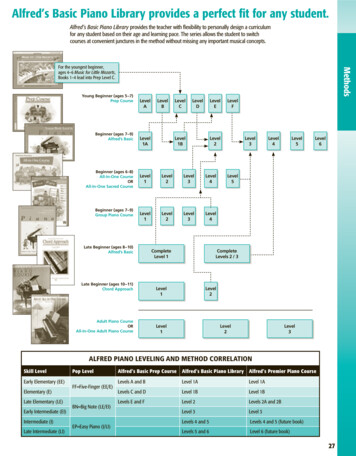
Part I1 The diagrams below represent two types of cells, an animal cell and a plant cell.Animal CellPlant CellWhich type of cell uses energy to carry out life processes?(1) plant cell, only(2) animal cell, only(3) both a plant cell and an animal cell(4) neither a plant cell nor an animal cell2 A diagram representing the levels of organization within an organism is shown below.X(Not drawn to scale)Which level of organization is identified by X?(1) cell(2) tissueGrade 8 Science – June ’18(3) organ(4) organ system[4]
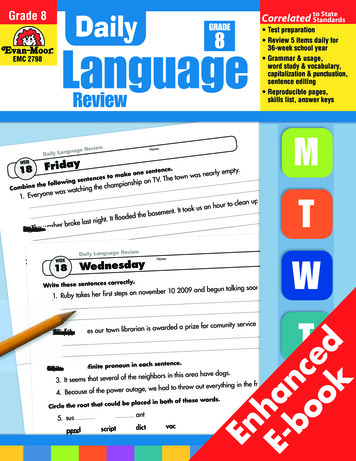
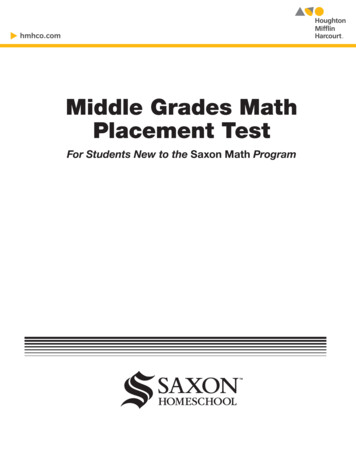
3 The diagrams below show models of the circulatory systems of a fish and frog.HeartHeartFishFrogA student compared these diagrams. The student found that each of these organisms had a heart to pumpblood. Which statement is supported by the student’s findings?(1)(2)(3)(4)Some organisms are composed of one cell, while others are multicellular.Many multicellular animals have similar organs and specialized systems.The circulatory system in most organisms removes solid wastes from their bodies.All animals have identical circulatory systems.4 The diagram below represents the life cycle of a butterfly.LarvaEggPupaAdult(Not drawn to scale)This life cycle represents the process of(1) separation from parent(2) asexual reproductionGrade 8 Science – June ’18(3) metamorphosis(4) extinction[5][OVER]
5 Water and carbon dioxide are waste productsreleased as a direct result of(1) asexual reproduction(2) mechanical digestion(3) natural selection(4) cellular respiration10 A change in an animal’s DNA, leading to avariation in a species, is called(1) a mutation(2) an infection(3) selective breeding(4) sexual reproduction6 The primary function of a plant’s roots is to(1) absorb water(2) perform photosynthesis(3) produce seeds(4) exchange gases11 Which set of terms describes natural fertilizationand development in humans before birth?(1) external fertilization, external development(2) external fertilization, internal development(3) internal fertilization, external development(4) internal fertilization, internal development7 Genes are a part of a(1) cell wall(2) chromosome12 A plant growing toward a light source is anexample of an organism(1) attracting a mate(2) destroying infectious germs(3) responding to external stimuli(4) obtaining moisture from the air(3) hormone(4) vitamin8 Compared to the amount of genetic informationcontained in a normal human body cell, the amountcontained in a normal human sperm cell is(1) the same(2) twice as much(3) one-half as much(4) one-fourth as much13 A cactus plant, a snake, and a hawk can bemembers of the same(1) community(3) population(2) kingdom(4) species9 The diagram below represents a pedigree chart.14 Which substance in green plants needs to absorbsunlight during photosynthesis?(1) chlorophyll(3) oxygen(2) cytoplasm(4) water15 In 1865, a pond was surrounded by open fields.Today, the same area is swampy and surroundedby a forest. Which process is responsible for thischange?(1) metamorphosis(2) conservation(3) ecological succession(4) crustal plate movementWhich type of information is organized by thischart?(1)(2)(3)(4)energy flow in an ecosystempopulation growth for pea plantsthe number of chromosomes in an organismthe passing of a trait from one generation toanotherGrade 8 Science – June ’18[6]
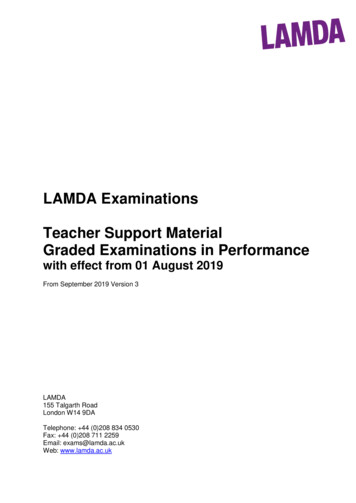
Base your answers to questions 16 and 17 on thefood label below and on your knowledge of science.The food label lists nutritional facts about a servingof cereal alone and cereal with a 1 cup of fat-free2milk.Nutrition FactsServing SizeServings Per Container51 Biscuits (55g/1.9 oz.)About 8Amount Per ServingCereal with1/2 CupCereal Fat-free MilkCaloriesCalories from Fat1901018 The fur on an arctic polar bear appears white allyear. The color of the fur is an example of(1) an adaptation helping an organism to survive(2) an organism exchanging materials with itsenvironment(3) an organism responding to internal stimuli(4) metabolism regulating an organism’s activities19 Urban growth and uncontrolled waste disposalby humans most likely results in(1) conservation of fossil fuels(2) environmental degradation(3) improved soil composition(4) a balanced ecosystem23010% Daily ValueTotal Fat 1gSaturated Fat 0gTrans Fat 0gPolyunsaturated Fat 0.5gMonounsaturated Fat 0gCholesterol 0mgSodium 0mgPotassium 200mgTotal Carbohydrate 46gDietary Fiber 6gSugars 12gOther Carbohydrate 28gProtein 5gVitamin AVitamin CCalciumIronThiaminRiboflavinNiacinVitamin B6Folic AcidVitamin 5%90%30%35%25%25%25%35%25%15%15%20 Cell division occurs as part of which process?(1) Energy in food is released.(2) A cut on a person’s finger heals.(3) A disinfectant destroys microbes.(4) The body eliminates wastes.21 The sign below was posted near a lake.WARNINGEating fish caught in this lakemay be dangerous to yourhealth.COUNTY HEALTH DEPARTMENT16 How much total energy is contained in a singleserving of this cereal with a 1 cup of fat-free2milk?(1) 10 Calories(3) 190 Calories(2) 40 Calories(4) 230 CaloriesWhich environmental problem is most likelyindicated by the sign?(1) toxic waste(2) global warming17 One nutrient that is obtained only when milk isadded to the cereal is(1) niacin(3) sodium(2) cholesterol(4) phosphorusGrade 8 Science – June ’18(3) ozone depletion(4) species extinction22 Which human activity would help reduce theamount of carbon dioxide in the atmosphere?(1) decrease the burning of fossil fuels(2) decrease the number of recycling programs(3) increase the human population(4) increase the number of cars being driven[7][OVER]
23 The data table below shows data for four planets in our solar system.Data TablePlanetDistance from Sun(millions of km)Period of Revolution(in Earth time)Period of Rotation(in Earth time)Mercury57.988 days59 daysVenus108.2225 days243 daysEarth149.6365 days24 hoursMars227.9687 days25 hoursFor which planet is the length of the planet’s day longer than the planet’s year?(1) Mercury(2) Venus(3) Earth(4) Mars24 Which weather instrument is used to measure wind speed?Anemometer(1)Barometer(2)Weather vane(3)Rain gauge(4)(Not drawn to scale)Base your answers to questions 25 and 26 on the diagram below and on your knowledge of science.The diagram represents the Moon at positions A, B, C, and D, in its orbit around Earth.DMoon’s orbitMoonSun’sraysANorthPoleEarthCKeyLighted sideB(Not drawn to scale)Grade 8 Science – June ’18[8]Dark side
25 Which graph best represents the percentage of the lighted side of the Moon that can be seen byan observer in the northern hemisphere when the Moon is at the positions shown?100Percentage ofLighted Side VisiblePercentage ofLighted Side Visible1005000ABCDAMoon Positions(1)Percentage ofLighted Side Visible100Percentage ofLighted Side Visible50500ABCDAMoon Positions(3)ABCDAMoon Positions(4)100500ABCDAMoon Positions(2)26 Approximately how long does it take for an observer on Earth to view a complete cycle of Moon phases?(1) 12 hours(3) 1 month(2) 24 hours(4) 1 yearGrade 8 Science – June ’18[9][OVER]
27 The motions of comets and asteroids in our solarsystem are predictable because they are(1) smaller than planets(2) nearly spherical in shape(3) in orbit around the Sun(4) controlled by Earth’s gravity31 The graph below shows the change in ozoneconcentration with altitude in Earth’s atmosphere.The data table below shows the average heightrange above sea level, in kilometers (km), for thedifferent layers of Earth’s atmosphere.Ozone Concentration vs. Altitudein Earth’s Atmosphere28 Which two gases, when released into theatmosphere, are believed to contribute most toglobal warming?(1) nitrogen and oxygen(2) nitrogen and carbon dioxide(3) methane and oxygen(4) methane and carbon dioxide353030252520201515101055Sea level 00Altitude (km)3529 The diagram below represents a flashlight thathas been turned on.Which form of energy is being convertedto electrical energy by the batteries in theflashlight?(1) chemical(2) nuclearOzone Concentration(3) solar(4) soundData Table30 Which set of Earth components is arranged inorder from solid to liquid to gas?(1) hydrosphere, atmosphere, lithosphere(2) hydrosphere, lithosphere, atmosphere(3) lithosphere, atmosphere, hydrosphere(4) lithosphere, hydrosphere, atmosphereLayer of Earth’sAtmosphereRange in AltitudeAbove Sea Level(km)middle stratosphere21 to 35lower stratosphere8 to 20upper troposphere4 to 7lower troposphere0 to 3Which layer of Earth’s atmosphere contains thehighest concentration of ozone?(1)(2)(3)(4)Grade 8 Science – June ’18[10]middle stratospherelower stratosphereupper tropospherelower troposphere
32 The cross section below represents a plunge poolthat formed at the bottom of a waterfall.35 A student correctly determined the density oftwo rocks. If the volumes of the two rocks areequal, the rock with the greater density has a(1) rounder shape(3) greater mass(2) smoother surface(4) smaller sizePlunge pool36 Which terms best describe the properties of agas?(1) definite volume and a definite shape(2) definite volume and no definite shape(3) no definite volume and a definite shape(4) no definite volume and no definite shapeThe plunge pool at the bottom of the waterfallwas formed mainly by(1) deposition(2) evaporation37 Low-pressure systems generally move across theUnited States from(3) precipitation(4) erosion(1) north to south(2) east to west33 What is the main source of energy for the watercycle?(1) the Moon(3) winds(2) the Sun(4) oceans(3) west to east(4) south to north38 The block diagram below represents a displacedrock structure.34 The diagram below represents a Lystrosaurus.Lystrosaurus was an herbivore that lived onland about 250 million years ago. Fossils of thisdinosaur have been discovered on the widelyseparated continents of Africa and SouthAmerica.Which process was responsible fordisplacement of the horizontal rock layers?(1) folding(2) faultingthe(3) tilting(4) weathering39 Which event is an example of a physical change?(1) iron rusting(3) eggs cooking(2) fireworks exploding (4) ice meltingWhich statement best explains why Lystrosaurusfossils are found on these two continents?(1) This dinosaur could fly to distant locations.(2) Both continents were once joined together.(3) Predators transported the remains of thisdinosaur between continents.(4) Glaciers transported the fossils to the twocontinents.Grade 8 Science – June ’18[11][OVER]
Note that question 40 has only three choices.40 The diagram below represents a portion of the Periodic Table of the Elements.Portion of the Periodic Table of the ElementsKEY1approximate atomic masssymbolnameGroupsatomic GaIn1719OHeHelium220FNeCarbon Nitrogen Oxygen admium Indium49481616NPAluminum neArgon17188084SeBrKrSelenium Bromine Krypton343536128127131TeIAntimony Tellurium Iodine515253XeXenon54Based on its position in the Periodic Table, at room temperature, cadmium is most likely a(3) metal(1) noble gas(2) nonmetal41 The model below represents a molecule of ammonia gas.Model of a Molecule of Ammonia GasKeyNitrogenatomHydrogenatomAmmonia gas would be classified as(1) a compound(2) a mixtureGrade 8 Science – June ’18(3) an element(4) an atom[12]
42 When calcium carbonate (CaCO3) is heated, it decomposes to form calcium oxide (CaO) and carbondioxide (CO2). The equation below shows this reaction.CaCO3 —› CaO CO2ReactantProductsIn this reaction, the mass of CaCO3(1)(2)(3)(4)is less than the mass of CaO plus the mass of CO2is greater than the mass of CaO plus the mass of CO2equals the mass of CaO plus the mass of CO2equals the mass of CaO minus the mass of CO243 The chart below shows the wind-chill temperatures caused by wind speeds at different surface airtemperatures.Wind Chill ChartSurface Air Temperature ( F)Wind Speed (mph)4035302520151050– 5 – 10 –15 – 20 –25 –30 –35 – 40 – 45536312519137103427211593– 4 – 10 – 16 – 22 – 28 – 35 – 41 – 47 – 53 – 59 – 66 – 72153225191360– 7 – 13 – 19 – 26 – 32 – 39 – 45 – 51 – 58 – 64 – 71 – 7720302417114–2– 9 – 15 – 22 – 29 – 35 – 42 – 48 – 55 – 61 – 68 – 74 – 812529231693–4– 11 – 17 – 24 – 31 – 37 – 44 – 51 – 58 – 64 – 71 – 78 – 843028221581– 5 – 12 – 19 – 26 – 33 – 39 – 46 – 53 – 60 – 67 – 73 – 80 – 873528211470– 7 – 14 – 21 – 27 – 34 – 41 – 48 – 55 – 62 – 69 – 76 – 82 – 89402720136–1– 8 – 15 – 22 – 29 – 36 – 43 – 50 – 57 – 64 – 71 – 78 – 84 – 91452619125–2– 9 – 16 – 23 – 30 – 37 – 44 – 51 –58 – 65 – 72 – 79 – 86 – 93502619124– 3 – 10 – 17 – 24 – 31 – 38 – 45 – 52 – 60 – 67 – 74 – 81 – 88 – 95552518114–3– 11 – 18 – 25 – 32 – 39 – 46 – 54 – 61 – 68 – 75 – 82 – 89 – 97602517103–4– 11 – 19 – 26 – 33 – 40 – 48 – 55 – 62 – 69 – 76 – 84 – 91 – 981– 5 – 11 – 16 – 22 – 28 – 34 – 40 – 46 – 52 – 57 – 63Wind-chill Temperatures ( F)What is the wind-chill temperature when the surface air temperature is 10 F and the wind speed is20 mph?(1) -41 F(2) -9 FGrade 8 Science – June ’18(3) 9 F(4) 4 F[13][OVER]
44 The diagram below represents a person using a wheelbarrow to move a heavy load of soil.Which two simple machines are parts of the wheelbarrow?(1) a lever and a pulley(2) a lever and a wheel and axle(3) an inclined plane and a pulley(4) an inclined plane and a wheel and axle45 The diagram below represents the rock cycle.Rock Cycle in Earth’s crockMagmaAccording to this diagram, metamorphic rock is formed by(1) melting and solidification(2) burial and compactionGrade 8 Science – June ’18(3) weathering and erosion(4) heat and/or pressure[14]
Part IIDirections (46–85): Record your answers in the spaces provided below each question.46 The diagram below represents a graduated cylinder containing 20 mL of water. Four identical marbles arenext to the After two of the marbles are added to the cylinder, the water level reads 24 mL.Shade in the graduated cylinder below to show what the water level would be after the other two marblesare added. [1]mL5040302010Grade 8 Science – June ’18[15][OVER]
Base your answers to questions 47 through 50 on the diagram and data table below and on yourknowledge of science. The diagram shows a laboratory set-up used to investigate the relationship betweenthe force on the spring and the length it will stretch. Increasing masses were attached to the spring. The lengththe spring stretched for each mass was measured using a meter stick. The data table shows the results of theinvestigation.ClampSpringRing standKnown massTableMeter stickClamp(Not drawn to scale)Data TableMass (g)Grade 8 Science – June ’18Extension of Spring (cm)001000.52000.63000.84001.55002.5[16]
47 On the graph below, use an X to plot the extension of the spring for each mass shown in the data table.Connect the centers of the Xs with a line. [1]Effect of Mass Applied on Spring ExtensionExtension of Spring (cm)32.521.510.500100200300400Mass Applied (g)50048 Describe the general relationship between the mass applied and the extension on the spring. [1]49 Based on the data, estimate the extension of the spring when a 250-gram mass is applied. [1]cm50 Identify the force acting on the mass that causes the spring to extend. [1]Grade 8 Science – June ’18[17][OVER]
Base your answers to questions 51 and 52 on the data table below and on your knowledge of science.The data table shows the numbers of two samples of bacteria, A and B, growing in a laboratory over a five-hourperiod.Data TableTime(hours)Number of Bacteria Ain SampleNumber of Bacteria Bin .0256164.5512165.010243251 Based on the pattern in the data table, predict the number of bacteria B at 6 hours. [1]52 Describe how the reproductive rates for bacteria A and bacteria B differ. [1]Grade 8 Science – June ’18[18]
Base your answers to questions 53 through 55 on the diagram below and on your knowledge of science.The diagram represents ten types of clouds and where they are found in Earth’s lusEarth’ssurface53 Identify one factor represented in the diagram that is used to classify the ten types of clouds. [1]54 Identify the water cycle process that forms clouds when moist air cools as it rises. [1]55 Explain why less sunlight reaches Earth’s surface when cumulonimbus clouds are over a location thanwhen cirrus clouds are over the same location. [1]Grade 8 Science – June ’18[19][OVER]
56 The diagram below represents the electromagnetic spectrum.Electromagnetic EnergyX raysGamma raysMicrowavesUltravioletInfraredRadio wavesDecreasing wavelengthIncreasing wavelengthVisible lightVioletBlueGreen Yellow OrangeRed(Not drawn to scale)List the following three types of electromagnetic energy in order from shortest wavelength to longestwavelength: infrared, x rays, red visible light. [1]ShortestLongest57 The diagram below shows a beaker of ice placed over an open flame.IceFlameDescribe what happens to the molecules in the ice as the temperature of the ice increases. [1]Grade 8 Science – June ’18[20]
Base your answers to questions 58 and 59 on the passage below and on your knowledge of science.Ultraviolet RadiationThe Sun’s radiation comes to Earth as many different wavelengths of electromagneticenergy. One form of energy is ultraviolet radiation. A person’s overexposure to the Sun’sultraviolet radiation (UV rays) is the biggest risk factor for skin cancer. Some ultravioletradiation is absorbed by the ozone layer, which is located in Earth’s atmosphere. This ozonelayer provides a natural protection for living organisms.58 State one reason why all of the ultraviolet radiation coming toward Earth does not reach Earth’ssurface. [1]59 Describe one action a person can take to avoid overexposure to UV radiation. [1]Base your answers to questions 60 and 61 on the diagram below and on your knowledge of science.The diagram represents a cart with a mass of 10 kilograms (kg) being pulled to the right with a force of20 newtons (N).Mass10 kgForce20 N60 Using the equation below, calculate the acceleration of the cart in meters per second squared (m/s2). [1]Force Mass X Accelerationm/s261 Identify the force between the wheels of the cart and the ground surface that opposes forward motion ofthe cart. [1]Grade 8 Science – June ’18[21][OVER]
Base your answers to questions 62 and 63 on the information and data table below and on your knowledgeof science.Four students participated in an experiment to determine the effect of exercise onheart rate. Four students measured their heart rates while at rest. After exercising for10 minutes, they measured their heart rates again. Data for these students are shown inthe table below. Heart rate is measured in beats per minute (bpm).The Effect of Exercise on Heart RateStudentHeart Rate (bpm)At RestAfter Exercising for 10 Minutes1609028612237211247511562 Based on the data table, describe the effect of exercising for 10 minutes on the heart rates of the fourstudents. [1]63 Describe one way to determine a person’s heart rate. [1]Grade 8 Science – June ’18[22]
Base your answers to questions 64 and 65 on the Punnett square below and on your knowledge of science.In corn plants, the trait for red kernels (R) is dominant to yellow kernels (r). The Punnett square representsa cross between two corn plants, both of which have a gene for red kernels and a gene for yellow kernels(Rr x Rr).RRrRRRrKeyrRrR red kernelsr yellow kernelsrr64 The diagram below represents an ear of corn with both red and yellow kernels.KeyRed kernelYellow kernelExplain why the number of red and yellow kernels on this ear of corn represents the results of the crossthat is observed in the Punnett square. [1]65 Identify the two genes of each parent that would always produce an ear of corn which has all yellowkernels. [1]X(parent 1)(parent 2)Grade 8 Science – June ’18[23][OVER]
Base your answers to questions 66 through 68 on the cross section below and on your knowledge ofscience. The cross section represents several rock layers that have not been overturned. Each layer containstrilobite fossils.ABCD(Not drawn to scale)66 Explain why the trilobite fossils found in rock layer A are considered to be younger than the trilobite fossilsin rock layer D. [1]67 Circle the class (type) of rock below that most likely includes rock layers A, B, C, and D, and give evidenceto support your choice. [1]Circle one:igneousmetamorphicsedimentaryEvidence:Grade 8 Science – June ’18[24]
68 Explain how studying fossils supports the theory of evolution. [1]Base your answers to questions 69 through 71 on the information below and on your knowledge of science.The list below describes some characteristics of the Canada lynx, an animal that is a member of the cat family.Canada Lynx Found in the colder climates of Canada and Alaska Thick, dense fur Preys on small animals, such as the snowshoe hare Large spaces between teeth so that bite enters prey as deeply as possible Wide feet to walk better over snow and ice69 Explain why the Canada lynx is classified as a carnivore. [1]70 Choose one characteristic from the list that helps the Canada lynx carry out the life process oflocomotion. [1]71 Explain why the population of the Canada lynx in one area may decrease if the population of snowshoehares decreased in that same area. [1]Grade 8 Science – June ’18[25][OVER]
Base your answers to questions 72 and 73 on the information below and on your knowledge of science.Keeping GoldfishGoldfish are one of the most common fish kept in a home aquarium. One thing thesefish need is an appropriately sized environment. Goldfish produce a hormone, known assomatostatin, that can limit their growth and can keep them from outgrowing their tank.Somatostatin allows the fish to grow to an appropriate size so that the concentration ofwastes produced by the fish do not reach harmful levels in the aquarium.72 Identify the body system in the fish that is most likely producing the hormone somatostatin. [1]system73 Explain how limiting growth is advantageous for the goldfish’s survival in a home aquarium. [1]74 The diagrams below represent human body cells that have divided normally and human body cells thathave divided abnormally.Human body cells thathave divided normallyHuman body cells thathave divided abnormally(Not drawn to scale)What disease results from abnormal cell division? [1]Grade 8 Science – June ’18[26]
Base your answers to questions 75 and 76 on the partial food web below and on your knowledge ButterflyGreen plant(Not drawn to scale)75 Identify two organisms in the food web that compete for food. [1]and76 Fungi and bacteria are not shown in this food web but play a role in this ecosystem. Describe the role offungi and bacteria in this food web. [1]Grade 8 Science – June ’18[27][OVER]
Base your answers to questions 77 and 78 on the graph and map below and on your knowledge of science.The graph shows the length of daylight for two cities, New York City (NYC), New York and Virginia Beach,Virginia, during the month of December 2014. The map shows the locations of New York City and VirginiaBeach in the United States.Length of Daylight for December 20149:50V9:40iaBeach, Virginia9:30NYCVirginiaBeachewNLength of Daylight ork9:101 3 5 7 9 11 13 15 17 19 21 23 25 27 29 31December77 Determine the number of hours and minutes of daylight for Virginia Beach and New York City onDecember 13. [1]Virginia Beach:New York City:78 Describe the general relationship between the latitude of a location in the United States and the length ofdaylight in December for that location. [1]Grade 8 Science – June ’18[28]
Base your answers to questions 79 through 81 on the passage below and on your knowledge of science.The passage describes some of the properties of earthquake waves.Earthquake WavesAn earthquake occurs when pieces of Earth’s crust move, producing waves of energycalled seismic waves. Two types of seismic waves that travel through Earth’s interior arecalled P-waves and S-waves. P-waves can travel through solids and liquids, but S-waves canonly travel through solids.79 Identify one Earth layer in which earthquakes may occur. [1]80 Explain how the properties of P-waves and S-waves have been used to determine that Earth’s outer core isliquid. [1]81 Other than moving to a new area, describe two actions people should take in order to prepare forthe possibility of strong earthquakes. [1](1)(2)Grade 8 Science – June ’18[29][OVER]
Base your answers to questions 82 and 83 on the information below and on your knowledge of science.A sugar cube was placed into a beaker containing 100 mL of water at room temperatureand completely dissolved into the water. This process is represented by the series of diagramslabeled A, B, and C below.SugarcubeABCBeaker of100 mL waterSugar cube placedin beaker of100 mL waterSugar cubedissolved in100 mL water82 Describe one way to make the sugar cube dissolve faster in the 100 mL of water. [1]83 Describe one way that the dissolved sugar at C could be separated from the water. [1]Grade 8 Science – June ’18[30]
Base your answers to questions 84 and 85 on the passage and data table below and on your knowledge ofscience.A group of students were experimenting with building electromagnets in science class.To do this, the students wrapped a piece of insulated copper wire around an iron nail andthen connected the two ends of the wire to a battery, making the nail magnetic. The numberof wraps of the wire around the nail affected the number of metal paperclips that the elec tromagnet could pick up at one time. The results of the students’ experiment are shown inthe data table below.Electromagnet StrengthNumber of Wire WrapsNumber of Paperclips Picked Up104157209251384 Predict how many paperclips the electromagnet would have picked up if the students had wrapped thewire around the nail only five times. [1]paperclips85 When the wires were disconnected from the battery, all of the paper clips fell off the nail. Explain whythe battery is needed to pick up the paperclips. [1]Grade 8 Science – June ’18[31]
GRADE 8 INTERMEDIATE-LEVEL SCIENCEFor Teacher Use OnlyPart II tal40CreditAllowedPrinted on Recycled PaperGRADE 8 INTERMEDIATE-LEVEL SCIENCE
Grade 8 Science – June ’18 [6] Cereal with 1/2 Cup Fat-free Milk (3) improved soil composition 12 Nutrition Facts Serving Size 51 Biscuits (55g/1.9 oz.) Servings Per Container About 8 Amount Per Serving Cereal Calories 190 230 Calor