Transcription
QUICKBOOKS 2020 STUDENT GUIDELesson 9Reports in QuickBooks
CopyrightCopyright 2020 Intuit, Inc.All rights reserved.Intuit, Inc.5100 Spectrum WayMississauga, ON L4W 5S2Trademarks 2020 Intuit Inc. All rights reserved. Intuit, the Intuit logo, Intuit ProLine, Lacerte, ProAdvisor, ProSeriesand QuickBooks, among others, are trademarks or registered trademarks of Intuit Inc. in the UnitedStates and other countries. Other parties’ marks are the property of their respective owners.Notice to ReadersThe publications distributed by Intuit, Inc. are intended to assist accounting professionals in theirpractices by providing current and accurate information. However, no assurance is given that theinformation is comprehensive in its coverage or that it is suitable in dealing with a client’s particularsituation. Accordingly, the information provided should not be relied upon as a substitute forindependent research. Intuit, Inc. does not render any accounting, legal, or other professional advice nordoes it have any responsibility for updating or revising any information presented herein. Intuit, Inc.cannot warrant that the material contained herein will continue to be accurate nor that it is completelyfree of errors when published. Readers should verify statements before relying on them.
Lesson 9 — Reports in QuickBooksTable of ContentsTable of ContentsLesson Objectives . 5Use the Report Centre . 6Run a Balance Sheet Report. 7Run a Profit and Loss Report. 9Create QuickReports . 10QuickZoom . 12Customize Reports . 14Filter Reports . 17Memorize Reports .19Create Memorized Report Groups . 20Process Reports in Groups . 21Print Reports . 22Save Reports as a PDF . 23Export a Report to Microsoft Excel .24QuickBooks 2020 Student Guide3
Lesson 9 — Reports in QuickBooksTable of ContentsCreate an Income and Expense Graph . 25Customize How Graphs Display. 27Reporting in QuickBooks — Review Questions . 28Review Activities .29Answers to Review Questions . 30QuickBooks 2020 Student Guide4
Lesson 9 — Reports in QuickBooksLesson ObjectivesLesson ObjectivesLearn about running reports in QuickBooks from the Report CentreLearn how to customize reports including filtering, adding columns, and changing the report titleLearn how to process reports in batchesSave reports as (PDF) filesLearn how to export a report to Microsoft ExcelPractice filtering reports in Microsoft ExcelLearn about the types of graphs QuickBooks offersLearn how to customize graphsQuickBooks 2020 Student Guide5
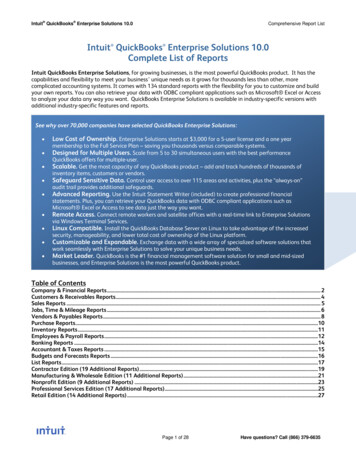
Lesson 9— Reports in QuickBooksUse the Report CentreUse the Report CentreA good way to learn about the reports available in QuickBooks — and how to work with them — is the Report Centre. TheReport Centre lists each report in QuickBooks, and gives a short description of what appears on the report. You can accessthe Report Centre from the Reports menu.Open the Report Centre:1.Click the Reports menu and select Report Centre.2.Use the blue view icons in the top right corner to customize your view.QuickBooks 2020 Student Guide6
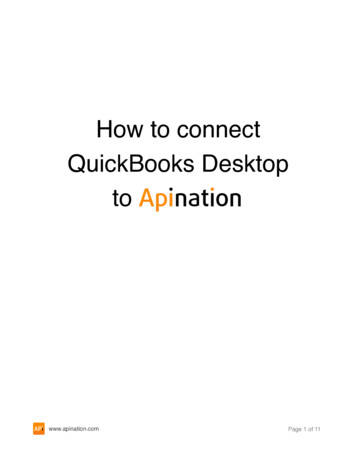
Lesson 9 — Reports in QuickBooksRun a Balance Sheet ReportRun a Balance Sheet ReportThe Balance Sheet shows where your business stands as of one moment in time. It lists all of your balance sheet accountsin three sections: Assets, Liabilities, and Equity.Assets are everything that the business owns. This includes fixed assets such as vehicles, as well as inventory and AccountsReceivable.Liabilities are what the business owes to suppliers or people outside the business. These include sales tax payable, loanpayments, and Accounts Payable.Equity is what the business is worth to the owners. These include owner’s contribution accounts, and retained earnings.Create a balance sheet report:1.In the Report Centre, choose Company & Financial, Balance Sheet Standard.2.Click the Run Report icon.QuickBooks 2020 Student Guide7
Lesson 9 — Reports in QuickBooksRun a Balance Sheet ReportNOTESQuickBooks 2020 Student Guide8
Lesson 9 — Reports in QuickBooksRun a Profit and Loss ReportRun a Profit and Loss ReportThe Profit and Loss report shows how your business performed over a period of time. It shows you all of your income andexpense accounts, and shows your net income.Create a profit and loss report:3.In the Report Centre, choose Company & Financial, Profit and Loss Standard.4.Click the Run Report icon.NOTESQuickBooks 2020 Student Guide9
Lesson 9 — Reports in QuickBooksCreate QuickReportsCreate QuickReportsQuickReports give you information about the list name you’re currently viewing. Whenever you have a list, a register, or aform displayed, you can click a button to have QuickBooks create a QuickReport.See what you owe a vendor:1.Click Vendors on the Home page.2.Right-click on the vendor name you wish to run a report for and select QuickReport or click on the QuickReport link inthe vendor information section.QuickBooks 2020 Student Guide10
Lesson 9 — Reports in QuickBooksCreate QuickReportsNOTESQuickBooks 2020 Student Guide11
Lesson 9— Reports in QuickBooksQuickZoomQuickZoomUse QuickZoom to get more information from reports and graphs. QuickZoom behaves differently depending on thereport you use it on. For example, when you QuickZoom on a summary report, QuickBooks will display a transaction detailreport. And when you QuickZoom on a transaction detail report, QuickBooks will open a transactionQuickZoom on a report or graph:1.From any financial report, hold your cursor over the dollar amount/transaction you wish to view in more detail.2.When your cursor turns into the QuickZoom icon, double-click your mouse to zoom in.QuickBooks 2020 Student Guide12
Lesson 9— Reports in QuickBooksQuickZoomNOTESQuickBooks 2020 Student Guide13
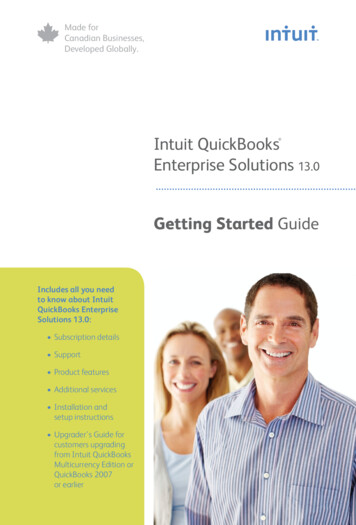
Lesson 9 — Reports in QuickBooksCustomizing ReportsCustomize ReportsCustomize the built-in reports to get the exact information you need for your business. The customization options will varydepending on the report you’re customizing.Add a column to a report:1.In the QuickReport window, click Customize Report.2.In the Columns list, select the additional columns you would like to add to the report.3.Click OK.QuickBooks 2020 Student Guide14
Lesson 9 — Reports in QuickBooksCustomizing ReportsMove a report column:1.Position your mouse pointer over the column you wish to move (the mouse becomes a hand).2.Hold down the left mouse button and drag the column header/name to the position you would prefer. When a redarrow appears, release your mouse button.QuickBooks 2020 Student Guide15
Lesson 9 — Reports in QuickBooksCustomizing ReportsChange information in the report heading:1.In the report window, click Customize Report then click the Header/Footer tab.On the Header/Footer tab, you can change the company name, report title, subtitle, and date and time prepared.You can also specify whether to print the header on all pages or just the first page. The Header/Footer tab is the samefor all QuickBooks reports.2.Highlight the text in the Report Title field and replace it with the title you would like to give your report.3.Click OK to close the Modify Report window.NOTE: To save this report for future use, click the Memorize button on the report tool bar before closing the report. This allowsyou to save the custom settings and run the report at a later date from the Reports drop-down menu.NOTESQuickBooks 2020 Student Guide16
Lesson 9 — Reports in QuickBooksFilter ReportsFilter ReportsReport filters let you set custom criteria for the transactions you want included in a report. When you filter a report,QuickBooks includes only those transactions that match the filters you apply.Filter a report:1.Click Customize Report on the Report button bar.2.Click the Filters tab.3.Select the appropriate filters from the Filter list.4.Add additional information for the filter to the right of the Filter list.5.Click OK.QuickBooks 2020 Student Guide17
Lesson 9 — Reports in QuickBooksFilter ReportsFilter DetailsAfter selecting filters on a report, you can view them when you click Show, under the Dates field on the report.QuickBooks displays the filters currently applied to the report.Clicking Show also tells QuickBooks to display the list of filters at the bottom of any .pdf or printed QuickBooks report.NOTESQuickBooks 2020 Student Guide18
Lesson 9 — Reports in QuickBooksMemorize Preset ReportsMemorize ReportsYou may want to memorize reports that you run frequently or reports that require you to set up customization and filters.Memorizing reports can save you from spending time customizing the same reports over and over again.Memorize a report:1.When you are in a report you would like to memorize, click Memorize from the report tool bar.2.Name the report accordingly.3.Click the Save in Memorized Report Group checkbox if you would like to assign this report to a group, then choosethe group from the drop-down menu.4.Click OK to memorize the report.NOTESQuickBooks 2020 Student Guide19
Lesson 9 — Reports in QuickBooksCreate Memorized Report GroupsCreate Memorized Report GroupsIn addition to saving report settings, you can create memorized report groups you can use to organize your memorizedreports in a way that makes sense for your business and allows you to process a group of reports all at once.QuickBooks comes preset with a number of memorized report groups, each containing common reports for each area. Youcan add your own reports to these groups, modify the groups to meet your needs and even create your own groups.Create a memorized report group:1.Click the Reports menu and select Memorized Reports, Memorized Report List.2.In the Memorized Report list, click the Memorized Report menu and select New Group.3.In the Name field of the New Memorized Report Group window, enter the name for your report group.4.Click OK.NOTESQuickBooks 2020 Student Guide20
Lesson 9 — Reports in QuickBooksProcess Reports in GroupsProcess Reports in GroupsBatch process reports:1.Click the Reports menu and select Process Multiple Reports.2.Click Display.QuickBooks opens the Process Multiple Reports window. You can use this window to display or print the selectedreports. You can also change the date range for reports in this window before you display or print them by clicking inthe From or To columns.3.Select the reports you wish to print and click Display to review the information in the reports or Print to print thereports.NOTESQuickBooks 2020 Student Guide21
Lesson 9 — Reports in QuickBooksPrint ReportsPrint ReportsPrint a report:1.With the report open, click the Print button from the tool bar.2.Select the appropriate printer from the drop-down list.3.Click Preview to see how the report will look when you print it.4.Click Print.NOTESQuickBooks 2020 Student Guide22
Lesson 9 — Reports in QuickBooksSave Reports as a PDFSave Reports as a PDFTo keep a record of the information in the report as it exists today, you can save the report in portable document format(PDF).Save a report as a PDF file:1.With the report open, click the File menu and select Save as PDF.2.Navigate to the folder in which you want to store the file and enter a file name.3.Click Save.NOTESQuickBooks 2020 Student Guide23
Lesson 9 — Reports in QuickBooksExport a Report to Microsoft ExcelExport a Report to Microsoft Excel Occasionally you may want to change a report’s appearance or contents in ways that aren’t available in QuickBooks, filterreport data in ways you can’t in QuickBooks or run “what-if” scenarios on your QuickBooks data.You can send reports from QuickBooks to Microsoft Excel. Since the changes you make in Excel don’t affect yourQuickBooks data, you’re free to customize reports as needed and even change data to run what-if scenarios.Send a report to Microsoft Excel:1.From the Reports menu, open the report you would like to export to Excel.2.On the Report button bar, click Excel and Create New Worksheet.3.Click the Advanced tab to add custom export options.4.Click OK, then Export.QuickBooks 2020 Student Guide24
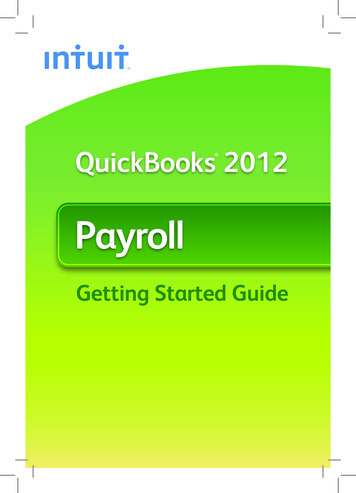
Lesson 9 — Reports in QuickBooksCreate an Income and Expense GraphCreate an Income and Expense GraphIf you want your business to be profitable, you need to keep an eye on your expenses. The income and expense graphshows you exactly what you’re spending and where.Create an income and expense graph:1.From the Reports menu, choose Company & Financial, Income & Expense Graph.2.QuickBooks can display only 10 accounts at a time. To display more accounts, click the Next Group button at the topof the graph window.QuickBooks 2020 Student Guide25
Lesson 9 — Reports in QuickBooksCreate an Income and Expense GraphDisplay income accounts instead of expense accounts:1.Click Income at the bottom of the graph window.2.Choose to filter By Account, By Customer, or By Class from the report tool bar.NOTESQuickBooks 2020 Student Guide26
Lesson 9 — Reports in QuickBooksCustomize How Graphs DisplayCustomize How Graphs DisplayYou can change how graphs are displayed to make them run faster, and make them easier to interpret.Change from 3D to 2D:1.From the Edit menu, choose Preferences.2.Click Reports & Graphs in the list to the left.3.Click Draw graphs in 2D (faster).4.Click OK.NOTESQuickBooks 2020 Student Guide27
Lesson 9 — Reports in QuickBooksReports in QuickBooks — Review QuestionsReporting in QuickBooks — Review Activities1.is the tool that allows you to drill down on summary reports and graphsin QuickBooks.2.When can you generate a QuickReport?a. Only when viewing an active customer or accountb. Only when viewing a list, register, or formc.Only at the end of the current fiscal periodd. Only when viewing balance sheet accounts3.Report let you set custom criteria for the transactions you want to include in a report.4.Once you’ve customized a preset report to meet your needs, how can you save your settings so you don’t have tocustomize the report each time you run it?a. Choose Save Settings from the Report menub. Choose Save Setting from the File menuc.Click Memorize on the button bard. Click Modify then choose Memorize5.True or false: Once you’ve exported report data to Excel, you can send modified data back to QuickBooks.a. Trueb. FalseQuickBooks 2020 Student Guide28
Lesson 9 — Reports in QuickBooksReview ActivitiesReview Activities1.From the File menu in QuickBooks, choose Open or Restore Company. QuickBooks displays the Open or RestoreCompany window.2.Select Restore a backup copy and click Next.3.Select Local backup and click Next.4.In the Open Backup Copy window, navigate to the appropriate directory.5.Select the qblesson.qbb file, and then click Open.6.In the Open or Restore Company window, click Next.7.Navigate to your directory.8.In the File Name field of the Save Company File As window, type Lesson9 and then click Save.9.Enter the Password: QBDT2020!10. Click OK when you see the message that the file has been successfully restored.Review Activities1.Run a Profit and Loss Standard report for the year to date. Customize the report to show the data by month, andchange the title of the report to Profit and Loss by Month. Memorize the report.2.Run a Balance Sheet Standard report for the year to date. Change the title of the report to Balance Sheet Year toDate. Memorize the report.3.Create a new memorized report group called Yearly Financials. Add the two memorized reports you created earlier tothe new report group.4.Run all of the reports in the Yearly Financials report group.5.Change the view of graphs from 3D t0 2D. Run an Income and Expenses graph to see the change.6.Use the Report Centre to find reports that show the following:- Sick and vacation balances for each employee- Time spent on each job- Inventory stock on hand and reorder point- Customers with overdue payments, how much they owe, and their phone numbers7.Run a Profit and Loss Detail report, and export it to Excel.8.Run any report, and save the report as a PDF.QuickBooks 2020 Student Guide29
Lesson 9 — Reports in QuickBooksAnswers to Review QuestionsAnswers to Review Activities1.QuickZoom is the tool that allows you to drill down on summary reports and graphs in QuickBooks.2.When can you generate a QuickReport?a. Only when viewing an active customer or accountb. P Only when viewing a list, register, or formc.Only at the end of the current fiscal periodd. Only when viewing balance sheet accounts3.Report filters let you set custom criteria for the transactions you want to include in a report.4.Once you’ve customized a preset report to meet your needs, how can you save your settings so you don’t have tocustomize the report each time you run it?a. Choose Save Settings from the Report menub. Choose Save Setting from the File menuc.P Click Memorize on the button bard. Click Modify, and then choose Memorize5.True or false: Once you’ve exported report data to Excel, you can send modified data back to QuickBooks.a. Trueb. P FalseQuickBooks 2020 Student Guide30
Lesson 9 — Reports in QuickBooks Lesson Objectives QuickBooks 2020 Student Guide 5 Lesson Objectives Learn aboutrunning reports in QuickBooks from the Report Centre Learn how to customize reportsincluding filtering, adding columns, and changing the report title Learn how to process reports in batches Save reports as (PDF) files Learn how to export a report to Microsoft Excel