Transcription
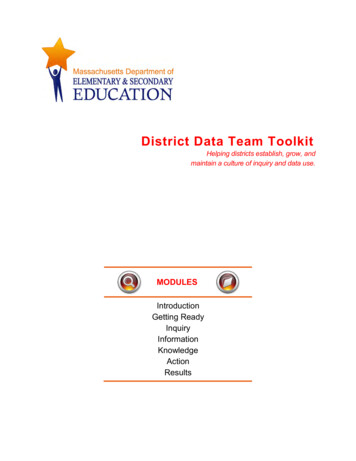
District Data Team ToolkitHelping districts establish, grow, andmaintain a culture of inquiry and data use.MODULESIntroductionGetting ReadyInquiryInformationKnowledgeActionResults
District Data Team ToolkitMODULE 0: INTRODUCTION TO THE TOOLKITTable of ContentsIntroductionIntroduction—1What is the Toolkit?—1How Can the Toolkit Help Our District?—2What’s in the Toolkit?—3How Should the Toolkit Be Used?—3How Do I Navigate the Toolkit?—4Where Should Our District Begin?—4Tools and Resources forthe Introduction0.1.1R: Objectives for All Modules0.1.2R: Tools and Resources for All Modules0.2.1T: District Data Team Self-Assessment
District Data Team Toolkit—Version 1.0Module 0: IntroductionINTRODUCTIONWelcome to the District Data Team Toolkit. This Toolkit is designed to help adistrict establish, grow, and maintain a culture of inquiry and data use that caninform decisions that impact teaching and learning, and ultimately improve theachievement of all students. This short introduction will help you understand andnavigate the tools and resources available to support this work.WHAT IS THE TOOLKIT?Ensuring the effective use of inquiry and data district-wide involves many tasksand types of expertise. For that reason, this Toolkit is designed to assist in theestablishment of a District Data Team—a cadre of staff who is collectivelyresponsible for the technical, organizational, and substantive aspects of data use.These Team members must be data literate and able to lead the collaborativeinquiry process with both district and school staff. Members of the District DataTeam work with district staff and school-level data teams to:Craft questions about accountability, equity, and continuous improvementCoordinate the collection, analysis, and dissemination of data displaysthat are necessary to address these essential questionsBuild action plansMonitor progress of improvement initiativesThese activities can help build the capacity of a District Data Team to engage ininquiry and use data to inform district-level decisions. Over time, the Team canengage the entire staff in using multiple data sources to continuously improveteaching and learning throughout the district. Districts that engage with theToolkit should plan for a multi-year commitment to increase and embed acapacity for effective data use.The Toolkit is designed around a theory of action, the Data-Driven Inquiry andAction Cycle (see diagram) on the next page, which provides a foundation foreffective data use. The Cycle provides a structure that takes data use fromasking the right questions to getting results. It is an iterative process in which thedistrict uses data to target and support continuous improvement. A disciplinedapplication of this kind of data-driven approach can build a district and schoolenvironment that is focused on continuous improvement grounded in evidence.This Cycle is also the basis for the ESE Education Data Warehouse trainings,which further provide excellent tools to access and analyze data. But analyzingdata alone will not result in continuous improvement. Concrete actions that aregrounded in evidence and continually monitored through the collection andanalysis of multiple forms of data are critical to achieve improved results.Massachusetts Department of Elementary and Secondary Education1
District Data Team Toolkit—Version 1.0Module 0: IntroductionHOW CAN THE TOOLKIT HELP OUR DISTRICT?Districts and schools gather enormous amounts of data throughout the schoolyear. These data have historically been collected merely to comply with externalrequirements. Increasingly, educators are seeking ways to use data systemicallyfor their own learning and to inform decisions about curriculum, instruction,resource allocation, and other vital functions at district and school levels.The ESE District Data Team Toolkit can help district staff:Organize a District Data Team to facilitate productive use of datathroughout the districtLearn and practice the steps of an effective data use modelAccess and apply tools and resources to support a process of inquiryEngaging with this Toolkit can help a district identify and/or refine a focus forimprovement, including determining if current improvement efforts are having thedesired effect on student learning outcomes. For example, a district may framean inquiry process around one aspect of an existing District Improvement Plan asa means to delve deeply into questions about the impact of the related initiatives.Once a District Data Team has built its own capacity for data use and a culture ofinquiry, it will be better poised to support such efforts with principals, teachers,and other stakeholders in the district.2Massachusetts Department of Elementary and Secondary Education
District Data Team Toolkit—Version 1.0Module 0: IntroductionWHAT’S IN THE TOOLKIT?The Toolkit has seven modules – this Introduction, and six modules aligned tothe Data-Driven Inquiry and Action Cycle. Each module contains objectives,detailed information, tools, and resources to help implement the work.1. Getting Ready module provides guidance on forming a District Data Teamand taking steps to build a solid foundation for building a culture of inquiryand systemic data use. The module addresses the need for systems toinventory, collect, and disseminate the data. It also has information topromote assessment literacy and help manage change.2. Inquiry module launches a process of inquiry by identifying high-levelquestions of importance to the district, generating clarifying questions tofocus the inquiry, and identifying data needed to answer them. Themodule includes guidance for effective data displays and data overviews.3. Information module guides the process of analyzing the data identified inInquiry, first making factual observations about the data and thengenerating inferences about what the data mean.4. Knowledge module helps place information (analyzed quality data) intothe context of research and practice to accurately define the problem andidentify possible solutions.5. Action module provides frameworks for putting new knowledge to work bydeveloping a logic model and articulating clear measures that will guideand focus the work, and then by creating an action plan (if necessary).If the information and knowledge gained from quality data analysis are notacted on, data collection efforts are wasted and improvement won’t occur!6. Results module shares methods for monitoring the work, evaluating theimpact, making mid-course corrections if necessary, and communicatingthe outcomes with stakeholders.HOW SHOULD THE TOOLKIT BE USED?The Toolkit is designed for district-level staff, to promote the skills and knowledgenecessary to build their capacity to effectively use inquiry and data to informdistrict-level decisions. As a District Data Team gains comfort with the tools,resources, and processes in the Toolkit, it can plan ways to share them withschool-and teacher-level data teams.Each of the modules provides specific tools and activities to implement the stepsof the inquiry process. Some tools are best used electronically. It is important tounderstand, however, that superimposing a process does not necessarily yield apositive result. A district must be mindful of doing what it can to embed a cultureof inquiry and data use that goes beyond technical compliance with processes.Massachusetts Department of Elementary and Secondary Education3
District Data Team Toolkit—Version 1.0Module 0: IntroductionHOW DO I NAVIGATE THE TOOLKIT?No matter the entry point taken, the Toolkit is designed to support ready accessto tools and resources as a District Data Team needs them, using a numberingsystem to make finding the right tool quick and efficient.3.2.1TModuleActivityTool or ResourceNumberWhen an activity has multiple tools or resources associated with it, they arenumbered sequentially and designated with either a T (tool) or an R (resource).Tools are templates, protocols, organizers, or other items that the Teamwill work with to build its knowledge and expertise.Resources provide further reading, documentation, or guidance to helpthe Team use the tools or expand its understanding.Activity 0.1 Overview of Toolkit ContentsThese documents summarize elements of the Toolkit in order to assist adistrict in engaging with ones that will be most useful to its work.(0.1.1R: Objectives for All Modules)(0.1.2R: Tools and Resources for All Modules)WHERE SHOULD OUR DISTRICT BEGIN?Districts should begin by engaging with the District Data Team Self-Assessment,at the end of this Introduction module, which will help determine the district’sstrengths and areas of need in regards to data use and a culture of inquiry. TheSelf-Assessment aligns with each of the modules and therefore can help thedistrict identify where to begin engaging with the Toolkit – which modules, tools,and resources would most help the district move forward with its work.If in doubt, a district might gain the most value from starting in Module 1: GettingReady and working through the Toolkit sequentially, committing to a multi-yearprocess of building robust use of data at the district level. If the District DataTeam has been in existence for several years and needs to work on refiningprocesses and policies that support data use, it may find it useful to go directly tocertain tools in the Toolkit.Activity 0.2 District Data Team Self-AssessmentThis self-assessment can help a district determine its strengths and needs,and how best to use this Toolkit to support inquiry and data use.(0.2.1T: District Data Team Self-Assessment)4Massachusetts Department of Elementary and Secondary Education
District Data Team Toolkit—Version 1.0Module 0: IntroductionMany thanks to all the individuals who contributed to the creation of this Toolkit,including a number of personnel from:Public Consulting Group (PCG);MA ESE Offices of Urban District Assistance, School Improvement GrantsManagement, Information Technology, Data Collection, and the Center forCurriculum and Instruction; andBrockton, Chelsea, Fitchburg, Holyoke, and Lynn Public School Districts.For more information on this and other district support resources, or to sharefeedback on this tool, visit http://www.doe.mass.edu/sda/ucd/ or emaildistrictassist@doe.mass.edu.Massachusetts Department of Elementary and Secondary Education5
OB JE CTIV ES FOR ALL MODULESPurposeTo provide an overview of the objectives for allmodules in the District Data Team Toolkit.DescriptionIn conjunction with the Introduction and SelfAssessment, this summary can help a District DataTeam identify the parts of the Toolkit that might bemost useful to its work.TimeN/A0.1.1RRelated Documents0–Introduction0.1.2R: Tools andResources for AllModulesModule 1 (Getting Ready) will help a district: Set the vision for data use across the district Build a culture of inquiry to promote systemic data use Establish a District Data Team to drive this work Build data literacy Understand types of data that inform inquiry Establish systems and policies to inventory, collect, and disseminate data Manage the change processModule 2 (Inquiry) will help a District Data Team use the above roles and vision to: Formulate questions to drive an inquiry process Create and present effective data displays and data overviews Identify the data needed to answer the questionsModule 3 (Information) will help a District Data Team use the above questions and data to: Collect and organize data relevant to the inquiry process Distinguish between observations and inferences Make inferences from multiple sources of dataModule 4 (Knowledge) will help a District Data Team use the inferences generated above to: Clearly articulate a problem statement Identify and explore root causes of the problem Cross-reference solutions with research and local knowledge Begin to capture information on the district’s improvement effortsModule 5 (Action) will help a District Data Team use the knowledge generated above to: Craft a logic model or theory of action to guide subsequent action and evaluation Articulate meaningful measures of implementation and change Develop action plans, if necessary, to implement new strategies or to implement existingstrategies more effectivelyModule 6 (Results) will help a District Data Team use the action plan generated above to: Decide what to evaluate Develop an evaluation plan Analyze evaluation data Identify and develop a communication strategy Continue the process of inquiry0.1.1R: Objectives for All Modules—Version 1.01/1
T O O L S A N D R E S O U R C E S F OR A L L M O D U L E S 0 . 1 . 2 RPurposeTo provide an overview of the tools and resourcesavailable in all modules of the District Data TeamToolkit.DescriptionIn conjunction with the Introduction and SelfAssessment, this list of tools and resources can helpa District Data Team identify the parts of the Toolkitthat might be most useful to its work.TimeN/ARelated Documents0–Introduction0.1.1R: Objectives for AllModulesModule 0: Introduction0.1.1R: Objectives for All Modules0.1.2R: Tools and Resources for All Modules0.2.1T: District Data Team Self-AssessmentModule 1: Getting Ready (Organize for Success)1.1.1T: Functions of a District Data Team1.5.3R: ESE Data Resources1.2.1T: Barriers to Effective Data Use1.6.1T: Data Collection Self-Assessment1.3.1T: Vision for Data Use1.7.1T: Data Dissemination Schedule Template1.4.1T: Norm Setting Protocol1.7.2R: Data Dissemination Schedule Example1.4.2T: Data Team Meeting Agenda1.7.3R: ESE Policies for Data Access1.4.3T: Data Team Meeting Minutes1.8.1T: Data Literacy Training Catalog1.5.1T: Data Inventory Template1.8.2R: Assessment Glossary1.5.2T: Data Inventory Template: SIMS andEPIMS Data1.9.1T: Managing Change and UnderstandingConcerns ProtocolModule 2: Inquiry (Ask the Right Questions)2.1.1T: Question Formulation Protocol2.4.2R: Data Display Rubric2.2.1T: Inventory of District and School Initiatives2.4.3R: Types of Data Displays2.3.1T: Data Overview Checklist2.4.4R: More Data Display Resources2.3.2R: Data Overview Example2.5.1T: Data Overview Brainstorming Protocol2.4.1T: Building Data Displays Protocol2.5.2T: Focusing Question Investigation TemplateModule 3: Information (Collect and Analyze Data)3.1.1T: Data Collection Planning ToolAlso revisit3.2.1T: Practice Making Valid Inferences2.4.1T: Building Data Displays Protocol3.3.1T: Data Analysis Protocol2.4.2R: Data Display Rubric2.4.3R: Types of Data Displays2.4.4R: More Data Display Resources0.1.2R: Tools and Resources for All Modules—Version 1.01/2
Module 4: Knowledge (Make Meaning of Data)4.1.1T: Writing a Problem Statement4.2.5T: Dimensions Bulls-Eye4.2.1T: Why, Why, Why?4.3.1T: Problem Investigation Plan4.2.2T: 20 Reasons4.3.2R: Educational Research Websites4.2.3T: Fishbone Analysis4.4.1T: Problem Catalogue Template4.2.4T: Graphic RepresentationModule 5: Action (Apply Meaning)5.1.1T: Logic Model Template5.2.2R: Elements of a Well-Written Measure5.1.2T: Logic Model Checklist5.3.1T: Action Plan Template5.2.1T: Crafting Meaningful Measures Checklist5.3.2T: Action Plan ChecklistModule 6: Results (Look for Improvement)6.1.1T: Evaluation Plan Template6.2.2T: Building Data Walls6.2.1T: Communication Organizer6.2.3T: Evaluation Report TemplateFor more information on this and other district support resources, or to share feedback on these tools,visit http://www.doe.mass.edu/sda/ucd/ or email districtassist@doe.mass.edu.0.1.2R: Tools and Resources for All Modules—Version 1.02/2
District Data Team Self-Assessment0.2.1TMA ESE District Data Team ToolkitDistrict Data Team Self-Assessment1
District Data Team Self-AssessmentBackground: This tool is designed to give a District Data Team an indication of its strengths andchallenges in a variety of areas related to promoting a district-wide culture of inquiry and data use. Theself-assessment is comprised of six short surveys which are aligned to each of the six modules in theToolkit and to the six steps in the Data-Driven Inquiry and Action Cycle. Each survey has a number ofselected-response questions grouped by Data Team practice. The possible responses are described inthe rubric below.1. Print each page of this self-assessment (including this page so that the rubric is readily available toanyone taking the survey) and provide a full copy to each member of the group.2. Individually complete the survey, assigning a rating from the rubric below to each indicator.3. As a group, discuss each page of the survey and agree on a rating for each indicator. It is notnecessarily best to average the individual scores to get this final rating. If responses among individualsvary widely, engaging in a discussion about which rating best represents the level of practice can helpthe Team begin the hard work of developing a common understanding of the work.4. Enter the final rating for each indicator into the spreadsheet version of this survey.5. Print out the Graphs page (or use a projector to display it on the wall), and as a group talk through thediscussion questions for each graphical display.Rubric for Assessing Each Practice:0 No KnowledgeRespondent/Team has no knowledge about this indicator and cannot provide ajudgment about its existence in the district.1 No EvidenceThere is no evidence that this indicator is in place within the district.2 Emerging EvidenceThere is some evidence of this indicator in the district, but the evidenceindicates that the practice is far from standard procedure and has clear roomfor improvement in both quality and frequency.3 Adequate EvidenceThis indicator has clear evidence of existence in the district and is consistentlypracticed in many places. There is room for improvement in either quality orfrequency.4 Exemplary EvidenceThis indicator is evident in a variety of ways throughout the district. Thepractice described is clearly a part of the district culture and the way peopleoperate within the district.0.2.1T: District Data Team Self-Assessment2
Interpreting the Data: When the Team completes the six surveys, the data will be displayed in a series ofcharts with questions to guide your review. There are two types of displays.* A radar chart showing your Team's perceptions of strengths across each of the six modules.* A horizontal bar chart for each step displaying the strengths within the step by practice.A radar chart, also known as a spider chart or a star chart because of its appearance, plots the values ofeach category along a separate axis that starts in the center of the chart and ends on the outer ring. In theexample below, each step of the Data-Driven Inquiry and Action Cycle is plotted on an axis. This makes itpossible to compare your survey results across the steps. When your surveys are complete, your resultswill be displayed in a ring plotted on the chart. A district performing consistently across all of the steps willbe displayed in a near circle. A district performing higher in some steps than others will be displayed in amore free form shape.0.2.1T: District Data Team Self-Assessment3
In the example below, this district is doing comparatively better in Inquiry, Information, and Knowledgethan it is in the other three steps. In this case, the district might find value in starting with the Resultsmodule to get an idea of what processes are involved with monitoring action plans, and then shifting backto the Getting Ready module to strengthen its processes across the whole cycle.The horizontal bar charts will display your Team's perceptions of strength within each step. The questionsin each step are grouped by practice. The chart displays the averages of the responses within each step,allowing you to view a disaggregated depiction of performance. When viewing these charts, you may findit valuable to go to the modules themselves to find the tools, resources, and activities that contribute to theeffective implementation of that practice. Each of the practices surveyed in this instrument are supportedin the modules.Getting ReadyStrengths by PracticeVision f or Data Use1.7District Data Team2.7Assessment Literacy2.7Data Technology(ies)3.0Data Inventory1.0Data Collection1.8Data Access3.0Change Management2.00.00.2.1T: District Data Team Self-Assessment2.04.04
Getting ReadyIncompleteRating Scale: 0 No Knowledge; 1 No Evidence; 2 Emerging Evidence; 3 Adequate Evidence; 4 Exemplary EvidenceVision for Data UseThe district has a vision for data use that aligns with and furthers the wider district mission and vision.0The district’s vision for data use is widely understood and accepted by all stakeholders.0The vision is supported by district policies and published expectations that support the use of inquiry anddata for instructional, school, and district improvement.0Rating:Practice Average: 0.0District Data TeamThe district has an established District Data Team or has designated another team to fulfill thosefunctions.0The District Data Team has a data champion, a data manager, and additional members with the range ofskills and perspectives needed to address the functions of the Team.0The District Data Team has a clear sense of its purpose and role in furthering the district's vision for datause.0The District Data Team has a written plan that outlines the membership, roles, and responsibilities of theTeam, and this is publically communicated.0The District Data Team uses effective team practices (starting and ending on time, appointing amoderator, following an agenda, appointing a note-taker, and clearly communicating regular meetingtimes).0The District Data Team accomplishes its tasks effectively (action items are clearly noted with the peopleresponsible and timelines for completion; Team communicates with all stakeholders).0Rating:Practice Average: 0.0Assessment LiteracyDistrict Data Team members are fully fluent in and have a shared understanding of contemporary,standards-based assessment terms and concepts, e.g., summative assessments, formativeassessments, performance levels.0District Data Team members know what assessments are in use in the district and understand eachassessment's purpose.0Members of the District Data Team actively support the development of assessment literacy in districtcolleagues, school data teams, and others through professional development offerings, coaching, andmodeling.0Rating:Practice Average: 0.0Data Technology(ies)Resources, e.g., user manuals, job aids, IT support, for data technology(ies) exist and are easilyaccessible to district and school users.0The district has technology(ies) for collecting and combining data from multiple sources, e.g.,demographics, grades, assessment data, attendance.0Rating:Practice Average: 0.0Data InventoryRating:The district has a comprehensive inventory of demographic, assessment, and other data available toinform improvement plans and instructional practices.0The data inventory is published and available to all, along with a regularly updated schedule tocommunicate how and when each type of data becomes available.0Practice Average: 0.00.2.1T: District Data Team Self-Assessment5
Data CollectionRating:The District Data Team solicits feedback from stakeholders to identify opportunities for improvement inmethods of data collection, management, and reporting.0The District Data Team regularly uses established methods of communicating and coordinating withstakeholders at all levels regarding data work.0Protocols or procedures are regularly used to ensure accuracy of data.0The District Data Team collects and reviews data from non-electronic sources, such as LearningWalkthroughs, Common Planning Time (CPT) Self-Assessment, and interviews with principals andother staff.0Practice Average: 0.0Data AccessRating:The district has clear policies for data access that conform to state and federal requirements.0The District Data Team has knowledge of what data reports are disseminated to which stakeholders,when, why, and what actions are taken as a result.0Practice Average: 0.0Change ManagementRating:District Data Team members are able to identify and address potential resistance to change beforeproblems occur.0Practice Average: 0.0Getting Ready Composite Average: 0.00.2.1T: District Data Team Self-Assessment6
InquiryIncompleteRating Scale: 0 No Knowledge; 1 No Evidence; 2 Emerging Evidence; 3 Adequate Evidence; 4 Exemplary EvidenceQuestion FormulationRating:The District Data Team clearly articulates a focusing question to guide the inquiry process.0When determining a focus for the inquiry process, the District Data Team considers high-level data andalso solicits input from school and district leaders and other stakeholders regarding areas of priorityconcern, e.g., dropout rates, programs to evaluate.0Practice Average: 0.0Data DisplaysThe IT staff and District Data Team create user-friendly data displays (charts, tables, and reports) thatfacilitate meaningful conversations and promote new insights on the work of the district in service ofteaching and learning.0Practice Average: 0.0Data OverviewsRating:The District Data Team creates effective data overviews (presentations to an audience) that are tied toidentified questions.0The District Data Team presents data overviews to appropriate audiences to introduce stakeholders tothe inquiry process.0Data overviews engage stakeholders in discussions of high-level data and solicit their input on theformation of the questions that will guide the inquiry process.0Data overviews result in collaborative discussions about the meaning of the data, clarifying questions tofocus the inquiry, and a list of data potentially needed to address the questions.0Practice Average: 0.0Priority IdentificationRating:The District Data Team prioritizes among identified areas of need arising from the inquiry process.0The District Data Team examines new initiatives and priorities in the context of available resources andongoing initiatives to ensure alignment.0Practice Average: 0.0Inquiry Composite Average: 0.00 No Knowledge0.2.1T: District Data Team Self-Assessment7
InformationIncompleteRating Scale: 0 No Knowledge; 1 No Evidence; 2 Emerging Evidence; 3 Adequate Evidence; 4 Exemplary EvidenceData Collection PlanningRating:The District Data Team has a system to identify who will gather and organize data needed for analysis(related to the specific focusing and clarifying questions), by when, and from where.0Practice Average: 0.0Data AnalysisRating:The District Data Team understands the differences between factual observations and inferencesgenerated from analyzing data and is rigorous about distinguishing between the two when discussingevidence.0Assessment data are analyzed in aggregate and disaggregate formats.0Assessment data is triangulated with other data, e.g., attendance, benchmark assessments,demographics, data from Learning Walkthroughs, stakeholder surveys, or central office processes.0Data analysis at the district level is conducted collaboratively within and among departmental teams.0Data analysis results in the identification of specific problems or questions that need to be addressed,e.g., problems at the student level, classroom level, school level, or district level.0Practice Average: 0.0Information Composite Average: 0.00 No Knowledge0.2.1T: District Data Team Self-Assessment8
KnowledgeIncompleteRating Scale: 0 No Knowledge; 1 No Evidence; 2 Emerging Evidence; 3 Adequate Evidence; 4 Exemplary EvidenceRoot Cause IdentificationRating:District Data Team members know and implement multiple protocols for the safe discussion of rootcauses.0Root cause analysis helps the Team decide on the one potential factor that, if addressed, wouldeliminate or dramatically alleviate the problem.0Practice Average: 0.0Connections to Research and Local KnowledgePotential root causes and proposed solutions are investigated through the consultation of research toconstruct strong inferences about possible solutions/action steps.0Potential root causes and proposed solutions are also investigated through the consultation of localknowledge or expertise to construct strong inferences about possible solutions/action steps.0Potential root causes and proposed solutions are also investigated through the consultation ofinformation on programs and practices (including data on instruction) to construct strong inferencesabout possible solutions/action steps.0Practice Average: 0.0Shared Knowledge BaseRating:The District Data Team keeps and references a problem log or meeting records documenting questionsraised to guide further inquiry.0The District Data Team encourages collection, dissemination, and active use of one or more forms ofdocumentation of lessons learned and promising practices from improvement efforts in a library of localknowledge.0Practice Average: 0.0Knowledge Composite Average: 0.00 No Knowledge0.2.1T: District Data Team Self-Assessment9
ActionIncompleteRating Scale: 0 No Knowledge; 1 No Evidence; 2 Emerging Evidence; 3 Adequate Evidence; 4 Exemplary EvidenceAction PlanningRating:The District Data Team uses a theory of action to focus action planning efforts.0The District Data Team uses a defined process for action plan development.0The action planning process considers ways to refine or reallocate existing resources, structures, andinitiatives before proposing brand new ones.0Action plans identify the available resources necessary to carry out the action steps.0The district can justify to stakeholders how it uses resources to achieve desired outcomes.0District personnel can articulate the district's program goals.0District personnel can articulate their role in achieving program goals.0Practice Average: 0.0Action Composite Average: 0.00 No Knowledge0.2.1T: District Data Team Self-Assessment10
ResultsIncompleteRating Scale: 0 No Knowledge; 1 No Evidence; 2 Emerging Evidence; 3 Adequate Evidence; 4 Exemplary EvidenceEvaluatin
Toolkit should plan for a multi-year commitment to increase and embed a capacity for effective data use. The Toolkit is designed around a theory of action, the Data-Driven Inquiry and Action Cycle (see diagram) on the next page, which provides a foundation for effective data use. The Cycle provides a structure that takes data use from