Transcription
Hedge Funds Investing: A QuantitativeLook Inside the Black BoxApril 2004François-Serge LhabitantProfessor of finance, EDHEC Business SchoolHead of Research, Kedge Capital
AbstractThere is an increasing amount of evidence that shows the benefits of considering hedge fundsas an asset class at the strategic asset allocation level. The investors’ greatest challenge remainsthe identification of desirable investment vehicles, since very little formal quantitative analysisof hedge funds has been done in the past. In this paper, we suggest an innovative approachto hedge fund investing, which is valid at the individual fund level as well as at the aggregateportfolio level (e.g. portfolio of hedge funds). This approach only relies on hedge funds historicalreturns. We provide several illustrations, including static and dynamic style analysis, benchmarkconstruction, performance assessment, and value-at-risk calculations.2EDHEC is one of the top five business schools in France. Its reputation is built on the high quality ofits faculty and the privileged relationship with professionals that the school has cultivated since itsestablishment in 1906. EDHEC Business School has decided to draw on its extensive knowledge of theprofessional environment and has therefore focused its research on themes that satisfy the needs ofprofessionals. EDHEC pursues an active research policy in the field of finance. EDHEC-Risk Institutecarries out numerous research programmes in the areas of asset allocation and risk management in boththe traditional and alternative investment universes.Copyright 2012 EDHEC
1. IntroductionThe consequences of globalisation have dramatically eroded traditional asset allocation dogmas.International assets move more and more in lockstep fashion and fail to fulfil their diversificationpromises, particularly in turbulent times. Consequently, investors have broadened their investmenthorizons and started seeking alternative asset classes, among them, hedge funds.Investors commonly view hedge funds as the phenomenon of the 1990s. From a few hundredplayers ten years ago, the hedge fund industry has expanded to several thousand today withdouble-digit annual growth. With capital under management under 100 million, most of thenewcomers are small, but a few dozen funds had a capital base larger than 1 billion at the endof 2000.Hedge funds have traditionally managed capital for high net worth individuals, family offices,and endowments. More recently, a broad range of institutional investors (including pension fundsin the Netherlands, Switzerland, Scandinavia as well as US funds) has also expressed an increasedinterest in hedge funds. It is likely that this interest will continue in the near future, increasing therole of hedge funds within traditional asset-allocation models.Surprisingly, there is still no universally accepted definition of what constitutes a hedge fund.Functionally, hedge funds and proprietary trading desks pursue similar goals: hiring professionalinvestment managers, rewarding them by performance-linked fee and implementing a largediversity of strategies often involving leverage, derivatives, hedging and short positions to exploitmarket inefficiencies. Organisationally, however, there are substantial differences: hedge fundsare typically private pooled investment vehicles with high minimum investments and infrequentredemption opportunities.Another key characteristic of hedge funds is that they dislike disclosing information about theirinvestment process and/or market bets. The reasons are twofold. First, hedge funds are oftenregistered as offshore companies or limited partnerships to avoid the restrictive registration andinvestment requirements of mutual funds. Consequently, publishing performance figures, portfoliocompositions, or other informative statistics could be considered by regulators as public solicitationand therefore illegal. Second, hedge funds are often taking concentrated and leveraged positionsin illiquid markets or securities. Disclosing them publicly could wipe out future expected gains orharden the ability of unwinding these positions when necessary.However, given the sector’s growing significance and the increasing turbulence of markets, thissituation is hardly sustainable. The collapse of Long Term Capital Management LP in 1998 raisedserious concerns for credit providers, trading counterparties and market regulators. Investors,chastened by the 1997 Asian crisis, the 1998 Russian crisis, the 1999 Brazil crisis and the burstingof the year 2000 Internet bubble now want to closely monitor their assets. Last, but not least,banks, investment consultants and funds of hedge fund managers require having a clear view ofhedge funds’ risk and return profiles before including them on any recommended list.Given the increase in investors’ interest, there is an urgent need of quantitative methods ofanalysing hedge funds and provide meaningful information while respecting their privacy. Mosthedge funds are now providing their net asset value on a regular and voluntary basis (e.g. monthly)to commercial data vendors such as TASS, Altvest, Hedge Fund Research, Managed Account Reports,etc. Although subject to a survivorship bias, these net asset values are probably the most reliablesource of data publicly available today on the hedge fund industry. They incorporate what hedgefunds actually do, not just what they say they do.3
Our goal in this paper is therefore to propose an alternative approach to hedge funds analysis,which can be summarised as “let the data speak”. It relies essentially on an extension of Sharpe’s(1992) return-based style analysis technique for mutual funds. This extension takes into accountthe particularities of hedge funds, such as the ability to go short and to use leverage. It is easyto implement and only requires a small amount of data. Last, but not least, its results are easy tounderstand, even by non-quantitative investors.The structure of this paper is the following. Section 2 discusses the quantitative aspects of ourmodel and its assumptions. Section 3 illustrates several potential applications such as static anddynamic style analysis, benchmark construction and performance assessment. Section 4 proposesan interesting and straightforward extension to compute the value-at-risk of a hedge fund.Section 5 summarises our findings and opens the door to further developments.2. The Hedge Fund Analysis ModelAs mentioned already, our analysis of hedge funds uses a time series of net asset values as a rawinput. Let us denote by NAVt the net asset value of a hedge fund at time t. From the fund’s netasset values, returns are derived as follows:(1)Next, we postulate a multi-factor model to explain the time-series of returns. If we denote Fk,tas the value of factor number k at time t and we use N distinct factors, our multi-factor modelcan be expressed as:(2)We can interpret the intercept term of the model as the portion of return unexplained by thefactor model.Multi-factor models are useful tools to describe the return structure of investment funds. Themajor difficulty in implementing them is the identification of common and relevant factors.Two approaches compete for this task. The first one consists in deriving endogenously a setof implicit factors using principal components analysis. This ensures an optimal fitting of themodel, but the difficulty then lies in the economic interpretation of the implied factors. Thesecond approach consists in specifying exogenously a set of factors that we believe or know tobe relevant. The economic interpretation is then straightforward, which makes it the preferredmethod for investment analysis.Which factors should be considered? The answer is relatively straightforward for traditionalmoney managers, given their limited investment flexibility. For instance, Sharpe (1992) used15 global stock and bond indices to describe the cross sectional returns of U.S. equity funds,and Elton, Gruber, and Blake (1995) preferred a series of fundamental economic variables forU.S. bond funds. However, the situation is different for alternative money managers. First, theyhave a larger set of potential investments available, may use leverage or short selling, and caninvest in illiquid assets since they do not offer daily redemption. Second, they attempt to provideinvestors exposure to unique and uncorrelated sources of return, i.e. returns driven by factors noteasily explained by the factors common to traditional investments. Third, the benchmarks theyuse are of little help for this task, because they are hurdle rates (such as T-Bill rates) for absoluteperformers rather than benchmarks for trackers.This explains why academic research on the sources of hedge fund returns is much less developedthan for traditional funds. As an illustration of the recent approaches proposed and without4
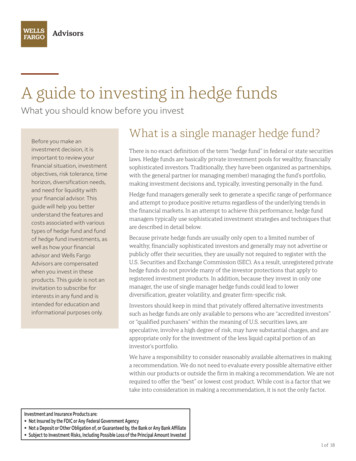
attempting to be comprehensive, let us mention the following papers. On the single factor side,Irwin et al. (1994) used a simple managed futures benchmark and McCarthy et al. (1997) suggesteda single index with Bayesian adjustment for leverage. On the multiple factor side, Mitev (1995)suggested using five implied factors, identified as trend following strategies, surprise or stop-losscontrol models, agricultural markets, spread-strategies (primarily interest rate) and fundamentaleconomic factors or global markets. Fund and Hsieh (1996) demonstrated the role of dynamictrading and investment approaches (distressed, global/macro, systems, systems/opportunistic, andvalue). Liang (2000) relied on eight asset classes (S&P 500, MSCI world and MSCI emerging forequity, Salomon Brothers world government bond and Salomon Brothers world corporate bondindices for bonds, Federal Reserve Bank trade-weighted dollar index for currency, gold price forcommodities, and one-month Eurodollar deposit for cash): Finally, Schneeweis and Spurgin (1998)combined a very large number of hedge fund indices, CTA indices, and traditional asset class indices.All these models rely on regression-like analysis. Our approach is somehow different andmotivated by the following considerations: a) Unlike equity or bond mutual funds, the lack ofa single factor that describes the return process of hedge funds highlights the emphasis thatshould be placed upon investment style rather than on the general return process. b) Static buyand hold portfolios, such as equity and bond indices, fail to capture the dynamic asset allocationand derivatives usage of hedge fund managers. We therefore start from an asset allocationperspective, namely, Sharpe’s (1992) return-based style analysis model, which is equivalent toequation (2) plus some constraints.Table 1: Definition of hedge fund investment styles according to CSFB/TremontSource: CSFB/TremontSharpe’s model uses as factors returns on representative asset classes. These asset classes mustbe 1) mutually exclusive; 2) exhaustive with respect to the investment universe; and 3) havereturns that differ. Since traditional asset classes are not really representative of hedge fundsbehaviour, we are using hedge fund indices. Several broad-based hedge fund indices are nowpublicly available to benchmark the performance of the industry. However, given the substantialdiversity in hedge funds strategies, we rather considered hedge fund style indices, which groupfunds based on their managers’ self-described strategies. In the following analysis, we areusing the nine CSFB/Tremont style indices family (see Table 1), mostly because of their quality,transparency, and adequate weighting scheme.1 However, we could repeat our analysis using anyother family of hedge fund indices.1 - CSFB/Tremont hedge fund indices publicly disclose their calculation methodology and the index constituents. The selection rules are simple: at least 10 million of assets under management and auditedstatements. Surprisingly, less than 300 hedge funds out of the 3000 in the TASS database fulfill them. CSFB/Tremont hedge fund indices are also the only asset-weighted indices of the hedge fund industry.This very desirable property corresponds to a momentum strategy, i.e. winners (losers) naturally increase (decrease) their relative weight in the index. In contrast, all other hedge fund indices are equallyweighted, which corresponds to a contrarian allocation, i.e. selling winners and buying losers at regular time intervals.5
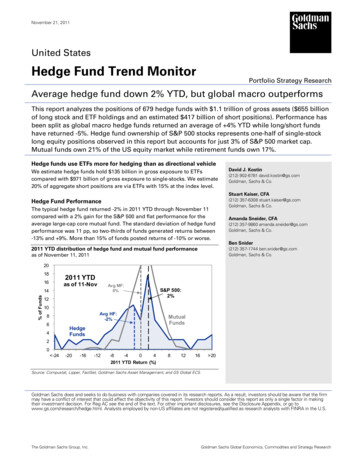
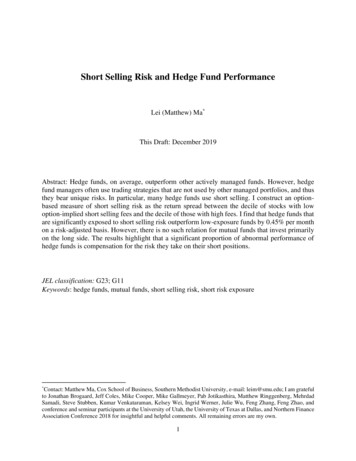
Thus, our model becomes:whereI1 returnI2 returnI3 returnI4 returnI5 returnI6 returnI7 returnI8 returnI9 (3)Convertible Arbitrage indexDedicated Short Bias indexEvent Driven indexGlobal Macro indexLong Short Equity indexEmerging Markets indexFixed Income Arbitrage indexMarket Neutral indexManaged Futures indexSharpe’s model also imposes two restrictions on the beta coefficients in order to interpret themas asset allocation weights: all betas must be positive (i.e. no short positions) and their sumshould equal one (i.e. the portfolio is fully invested). In our case, we kept the first constraint,2 butrelaxed the second one to account for the relative leverage possibility. Therefore, our model canbe seen as a constrained regression and needs to be solved by quadratic programming.33. ApplicationsWe now suggest several applications for our model at both the individual hedge fund and theoverall hedge fund portfolio levels.Clearly, our model provides useful insights to understand the investment strategy of a particularhedge fund. If one considers the CSFB/Tremont indices as purely synthetic4 hedge fund portfolioswhose objective is to deliver a particular set of risk/return characteristics, the betas of equation(3) can be interpreted as exposures to each of these investment styles. As an illustration, Figure 1represents graphically the nine betas that we obtained for two existing hedge funds. The shapesof these graphs (that we call “hedge funds radars”) allow for an immediate style classification.The first fund is a pure convertible arbitrage hedge fund (β1 0.41, all other betas below 0.04).The second fund is a fund of hedge funds that appears to be diversified across styles. Its highestexposures are in the convertible arbitrage (β1 0.22), market neutral (β8 0.22) and global macrostyles (β4 0.19), and moderate exposures in longshort equity (β5 0.15), emerging markets(β6 0.13) and event-driven (β3 0.07, all other betas below 0.01).Thus, using hedge fund radars, it suddenly becomes easy to monitor what managers actually doregardless of what they claim to be doing. It also helps in identifying hedge funds with a “pure”investment style and hedge funds with a diversified style approach. This is specifically useful forfunds of hedge funds and multi-manager portfolios, which offer investors an efficient way ofdiversifying risks across a number of managers and strategies. Are they effectively diversifiedacross styles? A single fund radar will help answer this question. Moreover, for those who prefera quantitative indicator, a useful indicator of style concentration is the following HerfindahlHirschman-like concentration index, computed by adding the squared (adjusted) style exposures:6(4)2 - Being short an investment style is rather hard to justify economically. For instance, what would mean being short the “Dedicated Short Bias” style?3 - This raises some technical difficulties if one needs to obtain the asymptotic distribution of the beta coefficients, for instance to build confidence intervals.4 - Although CSFB/Tremont indices consider a relatively small number of hedge funds with respect to concurrent indices, they are not easily investable. First, the high minimum investment in each fundsuggests that a substantial amount of capital would be required to track the index. Second, the liquidity and redemption policies of individual hedge funds would not allow for an unambiguous rebalancingscheme, leading to an increase of the tracking error.
Adjustment is necessary here, because the sum of the exposures can be significantly differentbetween two funds, since they do not sum to 100%. As an illustration, if we compute theconcentration indices for the two hedge funds of our previous example, we obtain 0.66 for theconvertible arbitrage hedge fund, and 0.18 for the fund of funds.Figure 1: Hedge fund style radarsThe figure shows the hedge fund radars obtained for a convertible arbitrage fund (top) and a fund of hedge fund (bottom). The sensitivities(i.e. style-beta coefficients) are estimated using three years of historical data.Hedge fund radars also open new doors to benchmarking hedge fund performance. The assetallocation implied by the radar provides a perfect natural benchmark against which the fundreturns should be compared. Of course, it does not necessarily correspond to the tactical assetallocation of the fund. However, over the considered period, what one can affirm is that the fundbehaved “as if” it effectively had this asset allocation. And the quality of this approximation iseasily verified using the r-square indicator obtained when estimating equation (3).(5)7
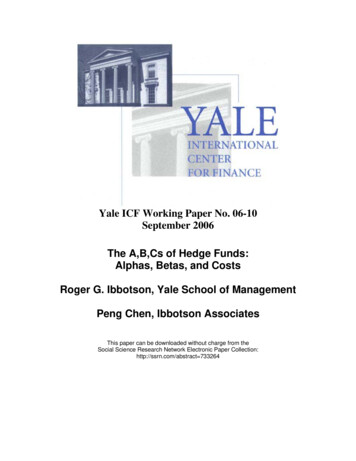
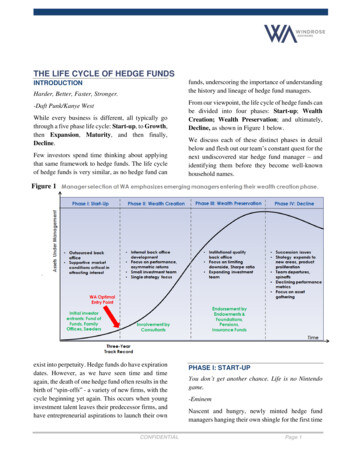
However, a fund radar only provides a static picture of a hedge fund’s behavior. Our modelalso allows for a dynamic assessment of a hedge fund’s behavior. By using a rolling observationperiod, it is possible to build up a series of radars that represent the evolution of the fund’sexposures over time. These can also easily be represented graphically, allowing for verifying thestability of the fund’s behavior.As an illustration, Figure 2 shows the dynamic behavior of the two funds considered previously.For our first fund, the exposure to convertible arbitrage appears only since the first quarter1999. Before this, the fund was clearly exposed to the long-short equity, event driven andmarket neutral styles. This evidences that the track record of this fund will not be the one of apure convertible arbitrage fund, although the fund is now almost only exposed to this style. Bycontrast, the fund of hedge funds appears diversified since it was created.4. Risk Management and Value at RiskAnother key application of our model is in the domain of risk management. Although thequantitative measurement of risk is essential, given the wide investment latitude of hedgefund managers, there is no real consensus on risk measures for hedge funds. Some funds simplyclaim to focus on absolute returns and do not even consider producing risk figures. Othersprovide a plethora of risk indicators, including volatility around the mean (although their returndistributions are non-symmetric), drawdowns (related to the length and depth of a decline inportfolio value), downside risk measures (related to the statistical probability of not achieving acertain return), and other inadequate information.5Most hedge funds are still reluctant to provide value-at-risk (VaR) figures — that is, their expectedmaximum loss during a specified period at a given level of probability. This is surprising, for atleast two reasons. First, the world’s leading financial institutions and proprietary trading deskshave now adopted VaR, with the strong support of rating agencies and market regulators. Second,VaR would be an invaluable tool for monitoring risks at both overall portfolio and individualhedge fund level, allowing fund managers to communicate intuitive and easy to understandrisk measures without going into the intricate details of complicated or proprietary tradingstrategies.Figure 2: A dynamic view on hedge fund styleThe figure shows the historical evolution of the sensitivities (i.e. style-beta coefficients) for a convertible arbitrage fund (top) and a fundof hedge fund (bottom).85 - See Lhabitant (2000) for an illustration.
Our model helps fill in this gap. From the style exposure of a hedge fund, one can easily applya two-step procedure to obtain its VaR. Let us assume for instance that we want a confidencelevel of 99 per cent for the one-month VaR.6 The first step consists of “pushing” each individualrisk factor in the most disadvantageous direction (at the one percentile value of its historicaldistribution) and estimating the overall impact on the fund, accounting for the risk factorscorrelation. This gives us the VaR due to market moves (i.e. style indices moves), that we call“value-at-market risk” (VaMR). Mathematically,(6)where ρi,j is the correlation between monthly returns of hedge fund indices i and j, and Fi* is theone percentile extreme return of style index i returns over one month.The second step estimates specific risk. We simply define specific risk ( ) as the differencebetween total risk (the observed fund variance ) and systematic risk (the variance due to themarket, i.e. the hedge fund style indices). We have:(7)By construction, the error terms εt of equation (3) are non-correlated and normally distributedwith zero mean. Since we want a 99 per cent confidence level, we can apply a factor push of 2.33times σε (corresponding to a 99% confidence level for a normal variable) to obtain the specificrisk of a hedge fund. Mathematically, the value-at-specific risk (VaSR) is given by(6)To obtain the total VaR figure, simply add up market and specific risk figures, accounting fortheir zero correlation:(7)Note that the procedure can easily be adapted to implement stress-scenario analysis, such asbreakdown in correlations. If we apply this model to the two hedge funds that we consideredpreviously, we obtain the following results. The convertible arbitrage fund has a VaR equal to7.73% of its net asset value, which we can split into a VaMR of 2.11% and a VaSR of 7.42%. Thefund of hedge funds has a VaR equal to 7.88% of its net asset value, which we can split into a6 - The choice of the holding period depends upon the time needed to liquidate a portfolio. It typically varies from one day for a trading portfolio to thirty days for a fund with a monthly redemption policy.The choice of the confidence interval is also relatively subjective. Banks typically use 95% to 99% as confidence intervals for measuring and reporting VaR.9
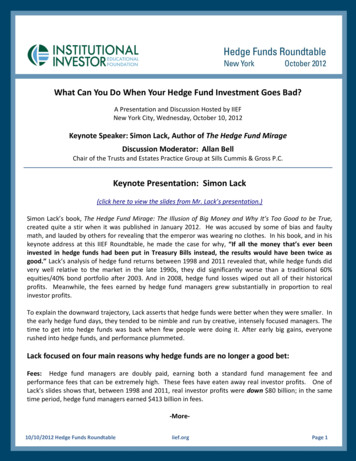
VaMR of 5.83% and a VaSR of 5.31%. As expected, the proportion of specific risk is larger in thepure-style hedge fund than in the diversified one.How trustworthy is our approach? We back-tested this VaR model on a sample of 2,934 hedgefunds from January 1994 to October 2000. Using a three-year observation period, we computedfunds’ exposures, the market parameters, and the funds’ VaRs (one month, 99% confidence level).Then, we compare the VaR of each fund with the profit and loss of the following month. If theloss is greater than the VaR figure, this is recorded as an exception. On a total of 96,549 threeyear observation periods, 1,026 exceptions were observed. This gives an exception rate slightlyhigher than expected (1.06% versus 1%). However, things have to be taken with precaution,since 614 of these exceptions occurred in August 1998 immediately after the LTCM crisis, whichcan be qualified as an abnormal market situation. If we exclude this month from our sample, theexception rate falls to 0.43%, a rather conservative figure.7Table 2: Correlation, extreme moves and volatility figures for Tremont/CSFB hedge fund indicesThis table shows the correlation, volatility and extreme move figures for the hedge funds styleindices at the end of September 2000. All values are computed from a historical sample of 36months. Volatility and Extreme moves are expressed on a monthly basis.5. ConclusionsFor a long time, due to the lack of transparency, hedge fund investing was more an art thana science, mostly based on qualitative analysis and due diligence. The collapse of numerouslarge players (LTCM, Granite funds, etc.) and the increasing turbulence of financial markets hasevidenced that qualitative approaches, although critical and necessary, were not sufficient.Given the complexities involved with hedge fund strategies, there is a need to introduce newquantitative tools.Our model attempts to fill in this gap. Relying only on net asset values, it determines the exposuresof a hedge fund to several investment styles. This makes it a useful tool to assist investors andfund managers in monitoring their portfolios, determining whether the benefits are in line withexpectations and assumptions made in asset allocation, verifying the diversification benefitsor highlighting the risks concentrated with any hedge fund manager or investment strategy. Asimple extension will transform our model into a powerful risk management tool able to computethe value-at-risk of a hedge fund as well as the marginal risk contributions of each investmentstyle an investor is exposed to.10Of course, some may argue that historical data may not be representative of the future. Ouranswer will be very pragmatic. First, we successfully back-tested our model on a large sample ofhedge funds, from January 1994 to October 2000. Second, historical data will always be useful to7 - See Lhabitant (2001) for detailed back-testing results.
assess past performance and to understand what were favourable and unfavourable outcomes.Third, over the years, our discussions with several hedge fund managers led us to believe that thevast majority of their funds may have unpredictable performance (because their returns dependon too many variables and the number of past observations is too small to make any inference),but have some form of partially predictable behaviour (e.g. investment philosophy, stop-loss,etc.). This is why past information, knowledgeably and intelligently interpreted, will always bebetter than no information.6. References Ackerman C., R. McNally and D. Ravenscraft (1999), The Performance of Hedge Funds: Risk,Return, and Incentive, Journal of Finance, 54, 833-874. Chen S.J. and B. Jordan (1993), Some empirical tests in the arbitrage pricing theory: macrovariables versus derived factors, Journal of Banking and Finance, 17, 65-89. Edwards F. and A.C. Ma (1988), Commodity fund performance: is the information contained infund prospectuses useful?, Journal of Futures Markets, 8 (5), 589-616. Elton E.J., M.J. Gruber and C. Blake (1995), Fundamental economic variables, expected returns,and bond fund performance, Journal of Finance, 50 (4), 1229-1256. Fung W. and D.A. Hsieh (1996), Performance attribution and style analysis: from mutual fundsto hedge funds, Working Paper # 9609, Duke University. Fung W. and D.A. Hsieh (1997a), Empirical characteristics of dynamic trading strategies: thecase of hedge funds, The Review of Financial Studies, 10 (2), 275-302. Fung W. and D.A. Hsieh. (1997b), Investment style and survivorship bias in the returns of CTAs,The Journal of Portfolio Management, 24 (1), Fall, 30-41 Jorion Ph. (1997), Value at Risk: the new benchmark for controlling market risk, University ofCalifornia, Irvine: McGraw-Hill Lhabitant F.S. (2000), Derivatives in portfolio management: why beating the market is easy,Derivatives Quartely, vol. 7 (2), pp. 37-46, 2000 Lhabitant F.S. (2001), Assessing market risk for hedge funds and hedge funds portfolios, FAMEworking paper Liang B. (2000), Hedge funds: the living and the dead, working paper, Case Western ReserveUniversity McCarthy D., Th. Schneeweis and R. Spurgin (1997), Informational content in historical CTAperformance, Journal of Futures Markets, May, 317-340 Mitev T. (1995), Classification of commodity trading advisors using maximum likelihood factoranalysis, working paper, University of Massachusetts. Schneeweis Th. and R. Spurgin (1998), Multifactor analysis of hedge funds, managed futuresand mutual fund return and risk characteristics, Journal of Alternative Investments, 1, 1-24. Sharpe W. (1992), Asset allocation: management style and performance measurement, Journalof Portfolio Management, 18 (2), 7-19.11
EDHEC-Risk Institute is part of EDHECBusiness School, one of Europe’s leadingbusiness schools and a member of the selectgroup of academic institutions worldwide tohave earned the triple crown of internationalaccreditations (AACSB, EQUIS, Associationof MBAs). Established in 2001, EDHEC-RiskInstitute has become the premier Europeancentre for applied financial research.In partnership with large financial institutions,its team of 90 permanent professors, engineersand support staff implements six researchprogrammes and ten research chairs focusingon asset allocation and risk management inthe traditional and alternative investmentuniverses. The results of the researchprogrammes and chairs are disseminatedthrough the three EDHEC-Risk Institutelocations in London, Nice, and Singapore.For more information, please contact:Carolyn Essid on 33 493 187 824or by e-mail to: carolyn.essid@edhec-risk.comEDHEC-Risk Institute393-400 promenade des AnglaisBP 311606202 Nice Cedex 3 - FranceEDHEC Risk Institute—Europe10 Fleet Place - LudgateLondon EC4M 7RB - United KingdomEDHEC Risk Institute—Asia1 George Street - #07-02Singapore 049145www.edhec-risk.comEDHEC-Risk Institute validates the academicquality of its output through publicationsin leading scholarly journals, implements amultifaceted communications policy to informinvestors and asset managers on state-ofthe-art concepts and techniques, and formsbusiness partnerships to launch innovativeproducts. Its executive education arm helpsprofessionals to upgrade their skills withadvanced risk and investment managementseminars and degree courses, including theEDHEC-Risk Institute PhD in Finance.Copyright 2012 EDHEC-Risk Institute
other family of hedge fund indices. 5 1 - CSFB/Tremont hedge fund indices publicly disclose their calculation methodology and the index constituents. The selection rules are simple: at least 10 million of assets under management and audited statements. Surprisingly, less than 300 hedge funds out of the 3000 in the TASS database fulfill them.