Transcription
2018PREQIN GLOBALHEDGE FUNDREPORTSAMPLE PAGESISBN: 978-1-912116-06-5 175 / 125 / 150www.preqin.com
2018 PREQIN GLOBAL HEDGE FUND REPORT - SAMPLE PAGESCONTENTSCEO’s Foreword - Mark O’Hare41: 2018 PREQIN GLOBAL HEDGE FUND REPORTKeynote Address: Regulatory Impacts on the SecuritiesFinance Industry - Glenn Horner, State Street62: OVERVIEW OF THE HEDGE FUND INDUSTRYTimeline of Key Events in 20178Hedge Funds: 2017 in Numbers10Hedge Funds Hit Perfect 12 in 2017 as Industry Reboundsfrom Difficult Period - Amy Bensted, Preqin11Shifting Landscape Leads Hedge Funds to Move PrimeBrokerages - Steven Sanders, Interactive Brokers12We Share Industry Leaders’ Optimism About the Future- Jack Inglis, AIMA14Why Alternative Investments? - Richard H. Baker,Managed Funds Association15In Focus: Alternative Risk Premia74In Focus: Artificial Intelligence/Machine Learning (AIML)75In Focus: Cryptocurrency76Equity Strategies77Macro Strategies78Event Driven Strategies79Credit Strategies80Relative Value Strategies81Multi-Strategy82Niche Strategies84Volatility Trading Funds85Activist Funds86Discretionary vs. Systematic Traders87Emerging Markets Strategies889: FUNDS OF HEDGE FUNDS3: HEDGE FUND MANAGEMENTAsset Flows in 201718Overview of Fund Managers and Funds204: PERFORMANCEPerformance Benchmarks26Performance in 201728Performance over the Longer Term32Overview of Funds of Hedge Funds90Funds of Hedge Funds – Plans for 201894Funds of Hedge Funds – Survey Results9510: CTAs98Overview of CTAs11: LIQUID ALTERNATIVESOverview of Liquid Alternatives5: INDUSTRY OUTLOOK FOR 2018View from the Inside36Fund Manager Outlook37Investor Outlook41Investment Consultant Outlook46Predictions for 2017: How Accurate Were They?506: FUND TERMS AND CONDITIONSHedge Fund Fee Structures52Terms and Conditions: An Overview577: INVESTORSKnow Your Investor60Fund Searches and Mandates65Private Wealth Firms68In Focus: Public Pension Funds70Sample Investors to Watch in 201871How Investors Source and Select Funds7228: OVERVIEW OF THE INDUSTRY BY STRATEGY10412: MANAGED ACCOUNTSOverview of Managed Accounts11013: SERVICE PROVIDERSFund Administrators114Fund Custodians115Prime Brokers116Fund Auditors117Law Firms11814: LEAGUE TABLESLeading Hedge Funds122Largest Investors by Region124Largest Investors by Type125Leading Fund Managers126 Preqin Ltd. 2018 / www.preqin.com
2018 PREQIN GLOBAL HEDGE FUND REPORT - SAMPLE PAGESCEO’s FOREWORD- Mark O’HareThey say that a week is a long time in politics; well, a year is certainly a long time in hedge funds. My foreword to Preqin’s 2017 GlobalReport reflected on the extended period of disappointing returns that had started in 2015, leading to investor dissatisfaction and netredemptions for the industry in 2016.Fast-forward to early 2018, and the outlook for the industry has improved significantly:Hedge funds achieved a ‘perfect 12’ in 2017: 12 months of positive performance – the first time this has been achieved since 2003 –and the 2017 return was 11.41%, also the best on record since 2013. Supported by this positive performance, investor sentiment has turned around: the proportions of investors satisfied versusdisappointed with returns have taken a turn for the better (see page 41), as has the pattern of investors intending to increase versusdecrease their allocations. As a consequence of this, and following five consecutive quarters of net outflows starting in Q4 2015, the tide turned, and theindustry saw net inflows of just under 50bn in 2017. Early days, and investors will need to see continued solid performance inorder to fully regain their confidence in and enthusiasm for the industry, but certainly a welcome start. Supported by these net inflows and (especially) the positive performance, industry assets under management reached a new recordhigh of 3.55tn in November 2017. Moving beyond the statistics, there are also many signs of new dynamism in the industry. New strategies are emerging, and this year’sGlobal Report covers alternative risk premia, cryptocurrency/blockchain and AI for the first time. These emerging strategies still accountfor relatively modest dollar allocations at this stage, but it is interesting to see the encouragingly large proportion of investors that areexpressing interest in or investing in these strategies to some extent. Managers are also offering a wider-than-ever range of structures/vehicles to meet the varying requirements of different investors. New managers continue to enter the industry, although for the firsttime on record fund closures have exceeded fund launches, so that the total number of active managers has declined. Net inflows havegone to the better-performing funds, while losses have been concentrated among the weaker performers (see page 19), signs of aninevitable – and perhaps welcome – consolidation in the industry.Many investors believe that the market could be hitting the top of the equity cycle, and are positioning themselves more defensivelyas a result, to the benefit of hedge funds. The range and diversity of investors allocating to hedge funds is huge (see pages 60-64), andunderstanding the various pools of capital, together with their requirements and expectations, is vital for success in asset gathering.Notwithstanding the more positive performance and outlook in 2018, many challenges remain for hedge funds. Fees are a perennialissue, with a large proportion of investors feeling that fees and terms are not adequately aligned between investors and fund managers(see page 52), and the all-important investment consultants continue to exert pressure on the industry (see pages 46-49). Regulatorychange continues apace, with MIFID II, reforms from the Trump administration and the potential effects of Brexit all playing a role.One constant factor in the industry’s development is the need for the best possible information to help investors and fund managersalike decide and execute their strategies. Preqin is committed to continuing to invest in and develop our services in the industry, and wethank all our customers and wider participants across the industry for their support.Thank you,Mark O’Hare
2018 PREQIN GLOBAL HEDGE FUND REPORT - SAMPLE PAGES1. 2018 PREQIN GLOBAL HEDGE FUND REPORTREGULATORY IMPACTS ON THESECURITIES FINANCE INDUSTRY- Glenn Horner, State StreetIn response to the Global FinancialCrisis of 2007-2008, Basel III andFinancial Stability Board regulations wereimplemented, prescribing more stringentcapital requirements and new liquidityrules. Additionally, global regulatorsdesignated the most systemicallyimportant banks as Globally SystemicallyImportant Banks (G-SIBs). The G-SIBdesignation requires these entities tomeet heightened standards in terms ofcapital, liquidity and interconnectedness.Though the new standards have not beenfully implemented, the securities financingindustry throughout the globe hasalready been impacted, and new entrantsare emerging in the market to helpclients navigate the evolving regulatorylandscape.For securities finance transactions, thestandardized approach of Basel III resultsin risk-weighted assets (RWA) that aremany multiples higher than under theadvanced approach, due to little or norecognition of netting, correlation ofloans and collateral or diversification.The current proposal aims to addressthe shortcomings of the standardizedapproach for securities financetransactions and will incorporate theaforementioned considerations. Bankshave been impacted by Basel III’s highercapital requirements, impacting capitalallocated to banks’ prime brokeragebusinesses as well as the availability ofsupply from bank-based agent lenders.Additionally, Basel III prescribes a 3%leverage ratio, or even higher standards,as in the case of G-SIBs. In the US, a 5%ratio at the parent-company level and a6% ratio at the depository level is requiredfor G-SIBs. For many banks, the leverageratio has superseded the risk-based capitalratios as a binding constraint, and as aresult, many banks have engaged in a resizing of their balance sheets – eliminatingor reducing the amount of low spreadtransactions undertaken, often includingprime brokerage balances.The Liquidity Coverage Ratio (LCR) requiresthat internationally active banks maintainsufficient unencumbered High QualityLiquid Assets (HQLA) to meet fundingrequirements for a significant stress eventlasting up to 30 days. UnencumberedHQLA must be 100% of total net cashoutflows over a 30-day period based onsignificant funding market stresses similarto those experienced during the financialcrisis. As a result of the LCR, banks’ abilitiesto provide term financing over 30 days toprime broker clients have been reduced.Another impact the financial crisis hashad on the regulatory environment isthe implementation of the Net StableFunding Ratio (NSFR). NSFR, which hasyet to be finalized in some jurisdictions,aims to reduce the reliance on short-termwholesale funding by banks. Banks havetraditionally utilized their balance sheetsto provide maturity transformation to themarket, but such maturity transformationcan create systemic instability. Banks willbe required to maintain 100% availablestable funding (ASF) compared to requiredstable funding (RSF). This measureassigns ASF weights to a bank’s capitaland liabilities that mature in less than sixmonths and between six months and oneyear. As a direct result, the cost of fundingfor certain prime brokerage transactionshas increased, making certain transactionsuneconomical.The final piece of Basel III that has directlyimpacted securities financing is theproposed Large Exposure Limits. Largeinternationally active banks will be limitedto exposures of 25% of their tier onecommon equity to any single counterparty.Further limitations of 15% will apply toG-SIB to G-SIB exposures. Exposures willbe measured based on the standardizedapproach in securities financetransactions. This may change in the eventthat the newly proposed standardizedmethod for RWA calculations is adopted.Agent lenders and prime brokers that lendsecurities to clients may be limited in thesize and scope of transactions. This couldlead to a decline in supply available to thealternative asset management sector, andhas already created a marketplace thatwelcomes new entrants.As existing providers consider theirresponse, there has been a proliferationof new entrants performing new roles.At State Street, businesses like EnhancedCustody and Alternative FinancingSolutions have been created to addressthe evolving liquidity landscape. In thetraditional Agency Lending businesses,innovative trade structures have becomea necessity. As the LCR is phased in andLarge Exposure Limits are adopted wewill likely see further innovations withinsecurities finance.STATE STREETState Street Bank and Trust Company is among the most financially strong and trusted counterparties in the industry. Our strongcredit position, stable funding capabilities and global network give us the resources, expertise and infrastructure to help clientsmanage regulatory change, mitigate risks and meet competitive challenges.www.statestreet.com6 Preqin Ltd. 2018 / www.preqin.com
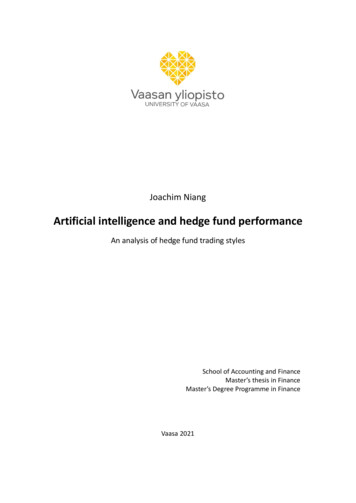
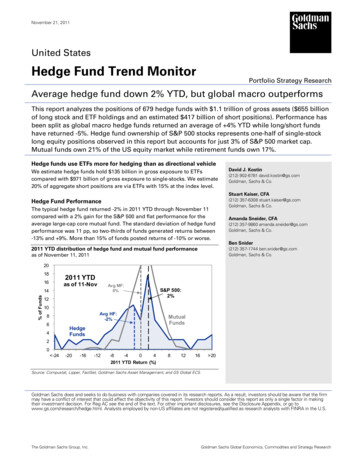
2018 PREQIN GLOBAL HEDGE FUND REPORT - SAMPLE PAGES3. HEDGE FUND MANAGEMENTASSET FLOWS IN 2017Change over2017EQUITYSTRATEGIESMULTI-STRATEGYRELATIVE VALUESTRATEGIES 1,054bn 894bn 485bn 354bn 8% 9% 14% 4%INDUSTRY GROWTH AS INFLOWS RETURNHaving suffered a year of net outflows(- 109.8bn) in 2016, hedge funds reversedthis trend in 2017 with net investor inflowsamounting to 49.5bn (as at November2017), with positive net flows recordedin all four quarters of the year (Fig. 3.1).However, almost as many hedge funds sawoutflows (43%) as inflows (44%) over thecourse of 2017, highlighting the continueddifficulties faced by many managers.Driven by this influx of investor capital, aswell as strong hedge fund returns in 2017( 11.41%), the industry’s assets continuedto grow throughout 2017, reaching 3.55tnas at November 2017, representing anincrease of 9% since the end of 2016. TheUS remains the largest market, holdingjust under three-quarters (74%) of industryassets.INFLOWS BY STRATEGYMulti-strategy funds recorded the greatestnet inflows ( 24.2bn) of any top-levelstrategy (Fig. 3.2), and with strong annualreturns of 10.09% in 2017, the strategy’saggregate industry assets grew 14% in the11 months to November 2017 to stand atFig. 3.1: Quarterly Hedge Fund Asset Flows, Q1 2015 - Q4 2017*6047.550Quarterly Asset Flows ( bn)Industry Assetsby Q1Q22015Q3Q4Q1Q22016Q3Q4*2017Source: Preqin Hedge Fund Online 485bn. In comparison, equity strategiesrecorded net outflows (- 32.6bn) over thecourse of 2017. However, despite this, theannual performance of equity strategies in2017 ( 15.01%) drove aggregate strategyassets up by 8.6% since the end of 2016 toNovember 2017.totalling 22.6bn in 2017 (as at November)it seems the significant amounts of capitalflowing into these strategies are goinginto the hands of only a small number ofmanaged futures managers.TOP PERFORMERS ATTRACTING INFLOWSPast performance remains a key factor indetermining a fund manager’s ability toattract new capital. As shown in Fig. 3.6,Only 32% of CTAs saw net inflows in2017 (Fig. 3.3); however, with net inflowsFig. 3.2: Hedge Fund Asset Flows by Core StrategyStrategy2015( bn)2016( bn)Q1 2017( bn)Q2 2017( bn)Q3 2017( bn)Q4 2017( bn)*2017( bn)IndustryAssets ( bn)% Changefrom 14.0%CTA24.625.57.210.4-4.09.022.627911.3%Macro nt Driven he StrategiesRelative Value StrategiesCredit 5.9%Equity otal Industry71.4-109.819.75.019.25.649.53,5479.2%*Q4 2017 asset flows estimated to 30 November 2017.18Source: Preqin Hedge Fund Online Preqin Ltd. 2018 / www.preqin.com
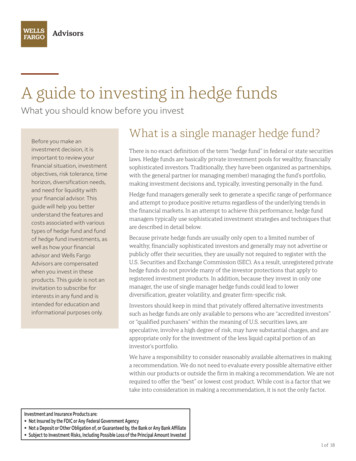
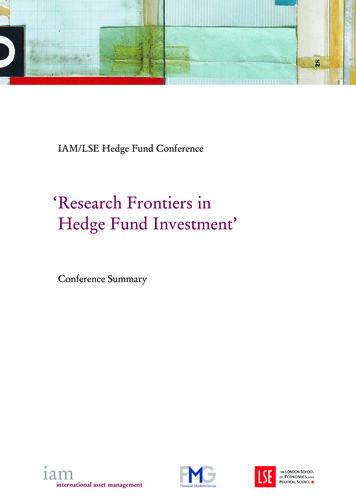
2018 PREQIN GLOBAL HEDGE FUND REPORT - SAMPLE PAGESIndustry Assetsby Strategy3. HEDGE NT DRIVENSTRATEGIESNICHESTRATEGIES 279bn 251bn 206bn 24bn 11% 6% 17% 64%Change over2017OUTLOOK2017 will help bring renewed optimism tomany industry participants, as investorslooked to allocate fresh capital to the assetclass. However, the success in fundraisingvaries significantly from manager tomanager based on strategy, region, sizeand performance. This emphasizes thethe majority (51%) of funds that generatedreturns of 5% or more in 2016 experiencednet inflows; by contrast, two-thirds offunds that generated a loss of greaterthan 5% in 2016 saw outflows in 2017.Therefore, although past performance maynot be indicative of future performance, itis a clear signifier of future asset flows.Fig. 3.3: Hedge Fund Asset Flows over 2017 by Core StrategyMulti-Strategy55%12%46%Equity Strategies43%Credit Strategies42%14%44%Relative Value Strategies40%16%44%Macro Strategies34%CTA32%0%13%Less than 100mn42%43%13% 100-499mn46% 500-999mn2%40%48% 1bn or More46%60%80%100%43%0%20%No Change57%40%OutflowInflowFig. 3.5: Hedge Fund Asset Flows over 2017 by Fund ManagerHeadquartersEurope15%38%No Change6%48%0% to 4.99%Rest of World47%7%46%5% or Greater40%60%80%100%14%19%-5% to -0.01%43%47%20%35%No %80%100%Proportion of FundsProportion of FundsInflow100%Fig. 3.6: Hedge Fund Asset Flows over 2017 by 2016 PerformanceAsia-Pacific0%80%Source: Preqin Hedge Fund OnlineLess than -5%40%20%60%Proportion of FundsSource: Preqin Hedge Fund Online44%52%52%Proportion of FundsNorth America37%53%23%Inflow21%41%14%20%Fig. 3.4: Hedge Fund Asset Flows over 2017 by Fund Size33%Event Driven Strategiesneed for fund managers and allocatorsalike to have access to comprehensivefund-level data to have the greatest insightinto the direction of capital flows in 2018and beyond.OutflowSource: Preqin Hedge Fund OnlineInflowNo ChangeOutflowSource: Preqin Hedge Fund Online19
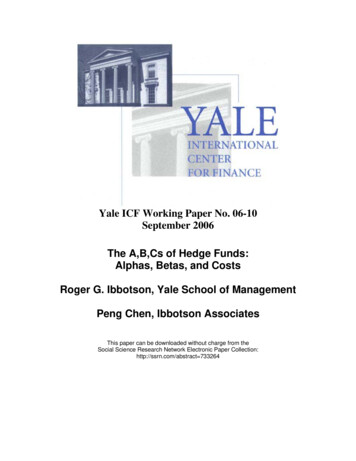
2018 PREQIN GLOBAL HEDGE FUND REPORT - SAMPLE PAGES4. PERFORMANCEPERFORMANCE BENCHMARKSFig. 4.1: Summary of Performance Benchmarks, As at December 2017 (Net Returns, Hedge 1.633.634.674.37Alternative Mutual 63.103.713.593.31Funds of Hedge Funds6.59-0.011.352.604.123.002.92Equity Strategies15.017.401.227.738.925.805.34Long/Short Equity12.315.662.676.818.244.984.68Long 98.292.3011.2212.928.217.22Alternative Mutual 534.685.945.275.01Funds of Hedge Funds11.12-0.392.114.165.854.794.46Macro -0.516.606.40Foreign Exchange1.226.211.773.041.212.993.25Alternative Mutual 0.981.711.633.173.03Funds of Hedge Funds0.371.630.040.681.282.292.44Event Driven Strategies11.7112.82-0.677.778.524.754.45Event 915.16-4.975.376.145.244.89Special er 18.6311.641.7210.4411.235.144.76Alternative Mutual 1.712.212.962.76Funds of Hedge Funds5.654.09-1.962.543.273.313.62Credit Strategies7.618.922.366.266.812.232.13Long/Short Credit7.178.96-0.445.155.492.622.53Fixed Income8.189.362.506.646.172.262.14Mortgage-Backed Strategies8.547.334.166.668.782.172.36Asset-Backed Lending6.907.757.587.418.870.851.16Specialist Credit9.4610.723.527.859.013.923.21Alternative Mutual 12.182.332.882.54Funds of Hedge Funds3.412.270.942.205.571.712.46Relative Value Strategies4.313.455.534.435.391.721.591.91Equity Market Neutral2.921.486.693.674.912.05Fixed Income Arbitrage5.815.313.174.764.881.901.89Relative Value Arbitrage5.117.126.086.107.622.432.23Statistical Arbitrage3.431.797.174.105.271.892.32Convertible Arbitrage7.335.492.585.125.792.492.32Alternative Mutual 051.331.691.791.51Funds of Hedge 096.163.526.566.822.582.52Alternative Mutual 42.012.862.672.71Funds of Hedge Funds5.54-0.411.262.103.732.742.70Niche StrategiesInsurance-Linked .2313.0612.277.904.214.63 Preqin Ltd. 2018 / www.preqin.com
2018 PREQIN GLOBAL HEDGE FUND REPORT - SAMPLE 75.653.304.703.823.57Funds of Hedge .277.956.87Funds of Hedge Funds15.69-2.215.876.207.145.684.99Emerging ry12.41Systematic7.58North America9.27Alternative Mutual FundsFunds of Hedge 719.73Latin 138.085.188.463.934.02Russia & Eastern Europe12.4416.63-0.429.300.438.3010.13Middle East & Israel9.835.942.816.1513.086.817.88UCITS Hedge Funds20.524.65-4.496.404.848.637.77Funds of Hedge Funds12.432.195.816.737.174.344.14Developed 870.801.633.634.674.37Trend .010.57-0.402.164.674.33Counter Trend4.410.090.441.632.685.074.614.45Pattern .511.361.233.213.313.13Option 20.673.236.085.63Funds of CTAs0.59-3.31-5.59-2.800.7710.149.57Emerging (Less than 100mn)10.908.231.876.937.194.053.82Small ( 100-499mn)11.386.822.796.947.703.973.70Medium ( 500-999mn)10.136.492.266.246.943.633.45Large ( 1bn or 135.054.50USD - CTAs3.501.050.521.683.694.754.49EUR - CTAs5.52-3.852.831.422.967.606.77USD - UCITS11.220.89-0.353.793.934.254.04EUR - UCITS4.840.662.122.533.353.463.14GBP - UCITS6.132.451.403.314.102.983.13CHF - UCITS3.56-1.670.720.851.542.962.87USD - Funds of Hedge Funds7.300.280.492.644.053.153.11EUR - Funds of Hedge Funds3.86-2.310.960.812.363.053.05Source: Preqin Hedge Fund Online*Please note, all performance information includes preliminary data for December 2017 based on net returns reported to Preqin in early January 2018. Although stated trendsand comparisons are not expected to alter significantly, final benchmark values are subject to change.27
2018 PREQIN GLOBAL HEDGE FUND REPORT - SAMPLE PAGES5. INDUSTRY OUTLOOK FOR 2018VIEW FROM THE INSIDEOver the course of 2017, the hedge fund industry saw improved hedge fund performance, growth in industry AUM, changes tofee structures and a rise in the number of new strategies entering the market. Using the results of Preqin’s surveys of over 350fund managers and 200 investors active in hedge funds, conducted in November and December 2017 respectively, we provide a moreindividual view of how industry participants see these trends from the ground.PRESSURE ON FEES REMAINS: AND SOME SEE THE RESTRUCTURING OF FEES AS KEY TO THEINDUSTRY’S FUTURE:Investor fee pressure and demand for transparency is stillthere- 5bn Asia-Pacific-Based Hedge Fund ManagerFees still need to come downThe investor demands of hurdles and other feeadjustments are partially due to funds chargingperformance fees when they shouldn’t and we think morefunds will adjust the way they approach fees in 2018- Sub- 50mn Hedge Fund Manager- US-Based Hedge Fund InvestorRECOGNIZED BRANDS CONTINUE TO ATTRACT ASSETS:Seems to be harder for managers to get over the 100mnand 250mn thresholds as most allocable assets seemdestined for the 1bn firms- 100mn US-Based Hedge Fund ManagerAll of the investments in 2016 and 2017 seem to be goingto the larger players, many of whom have far worseperformance than us, some even negative. This has beenparticularly frustrating WITH SOME SEEING POTENTIAL CONSEQUENCES:Large funds [are] becoming too large. [It is] easier tonegotiate good terms with smaller funds- US-Based Hedge Fund InvestorThere are too many assets in the industry and a decreasewould be healthy. The biggest managers have too manyassets to generate strong risk-adjusted returns- US-Based Hedge Fund Manager- Switzerland-Based Hedge Fund Manager2017 HAS SEEN AN INCREASE IN THE NUMBER OF RISK PREMIA,CRYPTOCURRENCY AND ARTIFICIAL INTELLIGENCE/MACHINELEARNING FUNDS. SOME VIEWS ARE POSITIVE:There are some positives from each, but some of thosepositives have been overshadowed by the attention andrush to join the crowd- Sub- 50mn US-Based Hedge Fund ManagerInvestor demand for these strategies has increased- Asia-Pacific-Based Hedge Fund ManagerAFTER A MORE POSITIVE YEAR, SENTIMENT WITHIN THEINDUSTRY SEEMS GENERALLY POSITIVE:Been a tough few years, hoping it gets less tough fromhere on out- 360mn US Hedge Fund ManagerThere is always demand, and funds will come and goaccording to their returns- Sub- 50mn Asia-Pacific-Based Hedge Fund ManagerWhen people are getting out, it is time to get in –behaviour is too sticky and people follow the crowd toomuch- 4bn US-Based Hedge Fund Investor BUT SOME ARE LESS SO:Let’s put it this way: yesterday was ETFs, today isrisk premia/cryptocurrency funds, tomorrow will besomething else, the following day another flavour, and soon, and so on.- US-Based Hedge Fund ManagerHype greatly exceeds reality- 75mn US-Based Hedge Fund Manager HOWEVER, CAUTION REMAINS:When the market corrects, it’ll be an interesting time tosee where people’s performance plays out- US-Based Hedge Fund Manager2018 will be challenging due to performance concerns visa vis the overall equities markets- Europe-Based Hedge Fund ManagerI continue to firmly believe that markets are enteringincreasingly dangerous territory; our fund must remaincautious and contrarian in its approach regardless ofshort-term results- US-Based Hedge Fund Manager36 Preqin Ltd. 2018 / www.preqin.com
2018 PREQIN GLOBAL HEDGE FUND REPORT - SAMPLE PAGES7. INVESTORSKNOW YOUR INVESTOR201762% 60%58% 58%201665%201561% 63%2014In this section we examine these allocatorsin more detail, based on data taken fromPreqin’s online platform, to help youunderstand the needs of institutions in2018 and really “Know Your Investor”.PROPORTION OF HEDGE FUND INDUSTRYCAPITAL COMING FROM INSTITUTIONALINVESTORS2013the umbrella of “institutional investor”fall many different types of institutionswith different sets of challenges andportfolio needs that hedge funds help tosolve. Therefore, gaining insight into thedifferences between types of investors –both on a macro level and an individualbasis – is an important step towardssecuring capital from these investors.45%of institutional investors allocate tohedge funds.2012Preqin estimates that institutionalinvestors allocate 2.06tn to hedgefunds, approximately 58% of all capitalinvested in the industry today. In capitalterms this is the highest level Preqin hasrecorded; however, the level has fallenproportionally from highs in 2013 asinstitutional inflows have slowed in aperiod of growing appetite from privatesources of wealth and retail clients.Nevertheless, gaining interest frominstitutional investors, with their long-terminvestment horizons and “sticky” capital,can be vital to the long-term developmentof a hedge fund business. However, under 2.06tnAmount of capital invested in hedgefunds by institutional investors.20115,287Number of investors tracked by Preqin.PUBLIC PENSION FUNDS47451%public pension funds invest in hedgefunds globally.of public pension funds actively investin hedge funds.Public pension funds have becomeprominent investors in hedge funds overthe past decade and their actions andactivity in the asset class have helpedshaped the industry we see today.There has been much focus on theseinvestors in recent years following thecuts made to hedge fund investmentsby CalPERS and a handful of otherhigh-profile pension funds. However,the “will they – won’t they?” debatearound the wider mass exit of publicretirement funds from investment inhedge funds is landing firmly on theside of public pension funds remainingcommitted to hedge fund investmentlong term. Today we see more publicpension funds investing in hedge fundsthan ever before, collectively investingtheir largest sum of capital on record.Much of the increase in capital comingfrom public pension funds continuesto be driven by new schemes makingtheir first investments in the asset class,particularly as new regions open up tothe possibility of hedge fund investment.60 21.0bnLargest allocation to hedge funds ofany public pension fund investor –ABP (managed by APG – All PensionsGroup).Recent relaxation of regulations in SouthKorea, for instance, has led to investorssuch as National Pension Service makingtheir first investments; others includingYellow Umbrella Mutual Aid Fund havebegun to consider investment for the firsttime. Although the average allocation tohedge funds by public pension funds hasremained stable since 2016 (at 7.9% ofAUM, Fig. 7.5), we have noted broaderchanges to their investment portfolios.Public pension funds continue to moveaway from a complete fund of hedge funds Preqin Ltd. 2018 / www.preqin.com
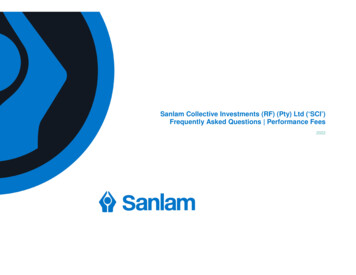
2018 PREQIN GLOBAL HEDGE FUND REPORT - SAMPLE PAGES8. OVERVIEW OF THE INDUSTRY BY STRATEGYIN FOCUS: ALTERNATIVERISK PREMIAFig. 8.1: Alternative Risk Premia Strategies Offered9%of fund managers offer a dedicated alternative risk premiaproduct, while14%operate a product with an alternative risk premia overlay.20184%Value61%Volatility39%Momentum31%Mean Reversion27%Carry18%Size/Liquidityof managers are planning to launch analternative risk premia product in 2018.12%Defensive6%Other12%0%?2%20%of managers plan to launch an alternative riskpremia product, but are unsure of when.11%42%of fund managers have seen increasedappetite from institutional investors foralternative risk premia products over 2017.40%60%80%Proportion of RespondentsSource: Preqin Fund Manager Survey, November 2017of all investors actively invest in alternativerisk premia, while a further12%31%of all investors active in alternative riskpremia plan to increase their allocation tothe strategy in 2018.are considering investing in 2018.Fig. 8.2: Sample Alternative Risk Premia Funds Launched in 2017FundManagerMan Alternative Style RiskPremiaPIMCO Multi-AssetAlternative Risk PremiaStrategy FundSystematica Alternative RiskPremiaAboutMan GroupMan Alternative Style Risk Premia aims to achieve medium-term absolute returns in all marketconditions across liquid asset classes. The fund employs a multi-strategy, multi-asset alternativerisk premia investment approach implemented through a quantitative and systematic process.The fund utilizes four trading styles in its
2018 PREQIN GLOBAL HEDGE FUND REPORT - SAMPLE PAGES CONTENTS CEO's Foreword - Mark O'Hare 4 1: 2018 PREQIN GLOBAL HEDGE FUND REPORT Keynote Address: Regulatory Impacts on the Securities Finance Industry - Glenn Horner, State Street 6 2: OVERVIEW OF THE HEDGE FUND INDUSTRY Timeline of Key Events in 2017 8 Hedge Funds: 2017 in Numbers 10