Transcription
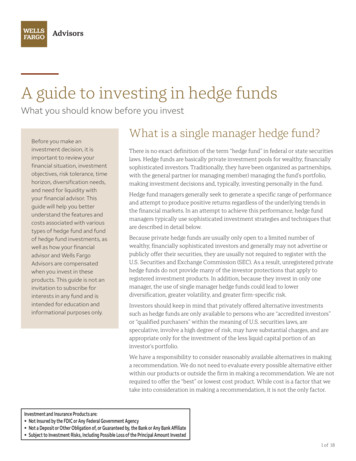
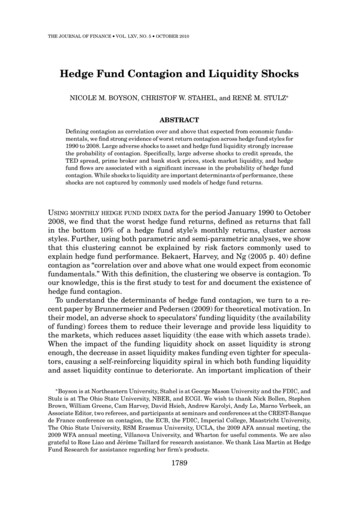
November 21, 2011United StatesHedge Fund Trend MonitorPortfolio Strategy ResearchAverage hedge fund down 2% YTD, but global macro outperformsThis report analyzes the positions of 679 hedge funds with 1.1 trillion of gross assets ( 655 billionof long stock and ETF holdings and an estimated 417 billion of short positions). Performance hasbeen split as global macro hedge funds returned an average of 4% YTD while long/short fundshave returned -5%. Hedge fund ownership of S&P 500 stocks represents one-half of single-stocklong equity positions observed in this report but accounts for just 3% of S&P 500 market cap.Mutual funds own 21% of the US equity market while retirement funds own 17%.Hedge funds use ETFs more for hedging than as directional vehicleWe estimate hedge funds hold 135 billion in gross exposure to ETFscompared with 971 billion of gross exposure to single-stocks. We estimate20% of aggregate short positions are via ETFs with 15% at the index level.David J. Kostin(212) 902-6781 david.kostin@gs.comGoldman, Sachs & Co.Stuart Kaiser, CFAHedge Fund PerformanceThe typical hedge fund returned -2% in 2011 YTD through November 11compared with a 2% gain for the S&P 500 and flat performance for theaverage large-cap core mutual fund. The standard deviation of hedge fundperformance was 11 pp, so two-thirds of funds generated returns between-13% and 9%. More than 15% of funds posted returns of -10% or worse.(212) 357-6308 stuart.kaiser@gs.comGoldman, Sachs & Co.Amanda Sneider, CFA(212) 357-9860 amanda.sneider@gs.comGoldman, Sachs & Co.Ben Snider2011 YTD distribution of hedge fund and mutual fund performance(212) 357-1744 ben.snider@gs.comGoldman, Sachs & Co.as of November 11, 201120182011 YTD16as of 11-NovAvg MF:0%% of Funds1412S&P 500:2%10Avg HF:-2%86HedgeFunds4MutualFunds20 -24-20-16-12-8-4042011 YTD Return (%)81216 20Source: Compustat, Lipper, FactSet, Goldman Sachs Asset Management, and GS Global ECS.Goldman Sachs does and seeks to do business with companies covered in its research reports. As a result, investors should be aware that the firmmay have a conflict of interest that could affect the objectivity of this report. Investors should consider this report as only a single factor in makingtheir investment decision. For Reg AC see the end of the text. For other important disclosures, see the Disclosure Appendix, or go towww.gs.com/research/hedge.html. Analysts employed by non-US affiliates are not registered/qualified as research analysts with FINRA in the U.S.The Goldman Sachs Group, Inc.Goldman Sachs Global Economics, Commodities and Strategy Research
November 21, 2011United StatesTable of contentsGoldman Sachs Hedge Fund Trend MonitorHedge fund ownership of the US equity marketHedge fund performance in 2011: Style matters“Stocks that matter most”: The hedge fund VIP ListThe impact of hedge funds: Look at the “concentrated” positionsTake a walk on the short side: Exploring hedge fund net exposureA “typical” hedge fundSectors: Funds increased Consumer Discretionary overweightSize: Large-cap stocks account for almost 50% of holdingsHedge funds and ETFs: Hedging tools, not investment vehiclesAppendix A: Hedge fund data tablesAppendix B: Drawbacks of our hedge fund holding analysisAppendix C: Hedge fund portfolio density and net long holdingsAppendix D: 100 largest hedge funds ranked by equity assetsAppendix E: 100 largest institutions ranked by equity assetsAppendix F: GS Portfolio Strategy Baskets on BloombergDisclosuresGoldman Sachs Global Economics, Commodities and Strategy Research3468101214161820213435363738392
November 21, 2011United StatesGoldman Sachs Hedge Fund Trend MonitorWe inaugurated our Hedge Fund Trend Monitor publication almost six years ago. Thisreport focuses on hedge fund positions at the start of 4Q 2011 and the meaningful changesfrom the previous quarter. The report is based on an analysis of 679 hedge funds with 638billion of long stock-specific and ETF equity assets and an estimated 417 billion of shortsingle-stock and ETF positions. Hedge fund holdings are priced as of September 30, 2011.Since the start of 4Q, the S&P 500 has risen by 11% while the typical hedge fund is flat.Hedge funds own 3% of US equity marketAt the end of 3Q 2011, hedge funds owned 320 billion of S&P 500 stocks, half of the 638 billion of long single-stock equity positions observed in this report. Hedge fundsowned an additional 121 billion of Russell 1000 constituents excluding S&P 500 stocksand 89 billion of Russell 2000 constituents. We estimate an additional 27 billion of UnitedStates stocks outside of the Russell 3000 and 27 billion of ADRs. Disclosed foreignholdings represented 54 billion of assets.Return distribution offers perspective on hedge fund performanceThe mean 2011 YTD hedge fund return equaled -2% as of November 11 with astandard deviation of returns of 11 percentage points. More than 15% of hedge fundsreturned -10% or worse. During the same period, the S&P 500 index returned 2% and theaverage large-cap core mutual fund was flat.Style explains variation in YTD hedge fund performance. The average global macrofund returned 4% year to date, outperforming both the market and the average large-capcore mutual fund. Equity long/short funds returned an average of -5%. The two hedge fundcategories posted similar returns during 1H 2011 with the average global macro fundfalling 1% and equity long/short funds essentially flat. However, in 3Q while the S&P 500plunged by 13.9% and equity long/short funds declined by 6.3%, global macro funds ralliedby 5.5%. The divergence was partially reversed during 4Q through November 11, withglobal macro funds falling 0.8% while equity long/short funds rose 2.1%.Size: Large-cap stocks account for almost 50% of holdingsThe tilt of aggregate hedge fund holdings towards large-cap stocks has been trendinghigher for almost 10 years. Roughly 45% of the aggregate assets of hedge funds wasinvested in stocks with equity capitalizations greater than 10 billion as of 3Q 2011, up from35% in 2002. Just 21% of aggregate assets is invested in small-cap stocks (below 2 billion).The typical hedge fund allocates 33% of its assets to large-cap stocks ( 10 billion) and 38%to small-cap stocks. The difference between the average and aggregate suggests that thehedge funds with the largest assets under management target large-cap stocks.ETFs: Hedge fund hedging tools, not investment vehiclesHedge funds continue to use ETFs more as a hedging tool than as a directionalinvestment vehicle, based on our analysis of 13-F and short interest filings. Weestimate that hedge funds hold 135 billion in gross exposure to ETFs compared with 971billion of gross exposure to single-stocks. ETFs now represent 4% of long assets, downfrom 6% in 1Q 2009 but up relative to recent quarters. Our analysis suggests the typicalhedge fund operates 36% net long (net/long), versus 46% in 2Q 2011. We estimate roughly20% of short positioning is conducted via ETFs with 15% occurring at the broad index level.Goldman Sachs Global Economics, Commodities and Strategy Research3
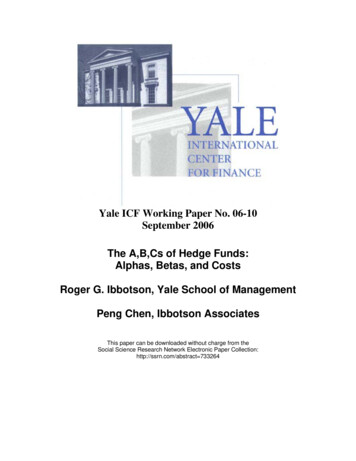
November 21, 2011United StatesHedge fund ownership of the US equity marketHedge Funds own approximately 3% of the US equity market (see Exhibit 1).Ownership by levered institutions compares with 33% for households, 21% for mutualfunds, 17% for retirement funds, and 13% for international investors. ETFs represent 4% ofthe US equity market.At the end of 3Q 2011, hedge funds owned 320 billion of S&P 500 stocks, half of the 638 billion of long single-stock equity positions observed in this report (see Exhibit2). Hedge fund holdings represent 3% of the equity market cap of S&P 500 stocks.Excluding S&P 500 stocks, hedge funds owned an additional 121 billion of Russell 1000market cap.Hedge fund ownership of large-cap stocks is low relative to small-cap stocks as itrequires more capital to own a sizable portion of market cap. Although hedge fundsown a greater dollar value of S&P 500 stocks compared with Russell 2000 stocks ( 320billion vs. 89 billion), hedge funds own a higher percentage of small-cap stocks (8% forRussell 2000 in aggregate vs. 3% for the S&P 500). In total, hedge funds owned 529 billionor 4% of Russell 3000 market cap.Of the remaining 109 billion of single stock holdings captured in this report, weestimate 27 billion of United States stocks outside of the Russell 3000 and 27billion of ADRs and 54 billion of disclosed foreign holdings. Our analysis does notcapture all foreign holdings of hedge funds because hedge funds are not required todisclose foreign holdings. Only shares of a foreign issuer traded on a United Statesexchange or quoted on the NASDAQ National Market System are reported in 13-F filings.Five foreign companies are in our Hedge Fund Very Important Position (VIP) List(Bloomberg ticker: GSTHHVIP ): ABX, VRX, BIDU, BP, and ESV.Hedge funds own 5.3% of the S&P 500 Consumer Discretionary sector (see Exhibit 3).This is not surprising as eight of the 20 stocks in our “most concentrated” hedge fundownership basket (Bloomberg: GSTHHFHI ) are Consumer Discretionary stocks (AZO,SHLD, AN, FDO, JCP, NFLX, EXPE and WYN). These stocks represent 5% of the sector’stotal market cap but excluding them reduces the sector’s hedge fund ownership to 4.2%,which is still the highest ownership of any sector.Hedge funds own 3.5% of the S&P 500 Information Technology sector. Eleven S&P 500Information Technology stock are in our Hedge Fund Very Important Position (VIP) ListAAPL, GOOG, and MSFT rank as the top three stocks in the basket.Goldman Sachs Global Economics, Commodities and Strategy Research4
November 21, 2011United StatesExhibit 1: Ownership of US corporate equity marketas of June 30, 2011100%Share ofUS Corporate Equity Market90%80%Households 33%70%Mutual Funds 21%60%50%Pension Funds 8%40%GovernmentRetirement Funds 8%30%International Investors 13%20%Hedge Funds 3%10%ETFs 4%Other ce: Federal Reserve, Lionshare via FactSet, and Goldman Sachs Global ECS Research.Exhibit 2: Hedge Fund ownership of Russell 3000Exhibit 3: Hedge Fund ownership of S&P 500 by sectoras of September 30, 2011as of September 30, 2011MarketCap( Bil)Hedge FundOwnershipValue%of Cap ( Bil) 10,53512,1901,1183.0 % 3203.64408.089Russell 3000 13,3084.0 % 529S&P 500Russell 1000Russell 2000Other United StatesCanadaUnited KingdomChinaBrazilTotal 27171084MarketCap( Bil)Consumer DiscretionaryInformation TechnologyMaterialsHealth CareFinancialsEnergyIndustrialsUtilitiesConsumer StaplesTelecommunication ServicesS&P 500 1,1172,0763501,2541,4191,1991,0474101,323339 10,535Hedge FundOwnership%Valueof Cap ( Bil)5.3 %3.53.33.13.12.72.32.11.91.4 5973113843332482553.0 % 320 638Source: Lionshare via FactSet and Goldman Sachs Global ECS Research.Goldman Sachs Global Economics, Commodities and Strategy ResearchSource: Lionshare via FactSet and Goldman Sachs Global ECS Research.5
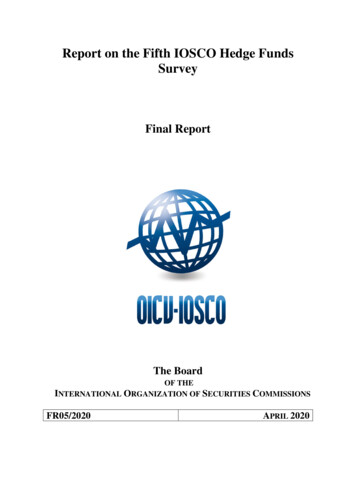
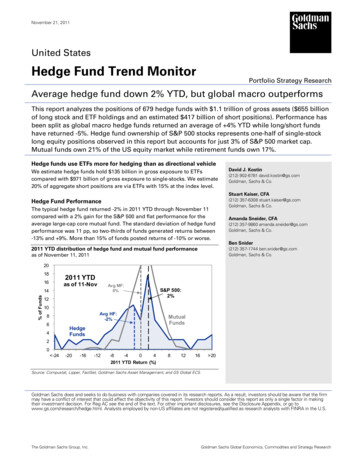
November 21, 2011United StatesHedge fund performance in 2011: Style mattersAs of November 11, the typical hedge fund had generated a YTD return of -2%compared with a 2% gain for the S&P 500 and flat performance for the average largecap core mutual fund (see Exhibit 4). The mean 2011 YTD return for a universe of 85hedge funds with current aggregate shareholder equity assets of 282 billion equaled -2%.The standard deviation of returns was 11 percentage points so two-thirds of the hedgefunds have generated YTD returns between -13% and 9%.Distribution of returns provides more perspective than a single point estimate. The60-fund Dow Jones Credit Suisse Blue Chip Hedge Fund IndexSM has returned -2% YTD, inline with our sample average. The distribution of YTD performance indicates that morethan 15% of hedge funds have generated returns of -10% or worse. As of November 11, theS&P 500 had returned 2% and the typical US large-cap core mutual fund had returned 0%.The performance difference between hedge fund styles is substantial. The averageglobal macro fund returned 4% year-to-date, outperforming both the market and theaverage large-cap core mutual fund. Equity long/short funds returned an average of -5%(see Exhibit 6). The two hedge fund categories posted similar returns during 1H 2011 withthe average global macro fund falling 1% and equity long/short funds essentially flat.However, in 3Q while the S&P 500 plunged by 13.9% and equity long/short funds declinedby 6.3%, global macro funds rallied by 5.5%. The divergence was partially reversed during4Q through November 11, with global macro funds falling 0.8% while equity long/shortfunds rose 2.1%.Exhibit 4: 2011 YTD distribution of hedge fund and mutual fund performanceas of November 11, 201120182011 YTD16as of 11-Nov% of Funds14Avg MF:0%12S&P 500:2%10Avg HF:-2%86MutualFundsHedgeFunds420 -24-20-16-12-8-4042011 YTD Return (%)81216 20Source: Compustat, Lipper, Dow Jones Indexes, FactSet, Goldman Sachs Asset Management, and GS Global ECS Research.Goldman Sachs Global Economics, Commodities and Strategy Research6
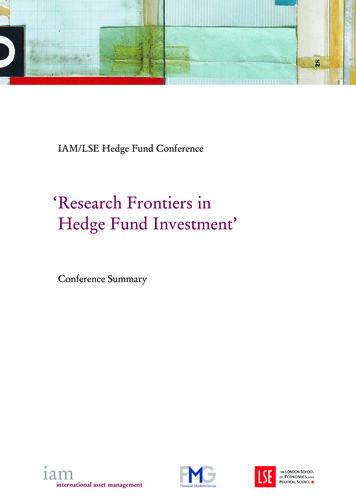
November 21, 2011United StatesExhibit 5: 4Q 2011 to-date distribution of hedge fund and mutual fund performanceas of November 11, 201120No. of AssetsFunds ( bil)Mutual Funds 262 461Hedge Funds85282S&P 5001816StdDev4.1 %4.12011 4QTD14% of Funds4QTDMeanReturn12.0 %1.312.0as of 11-Nov1210S&P 500:12%86MutualFundsHedgeFunds4Avg MF:12%Avg HF:1%20 -6-4-2024684Q 2011 QTD Return (%)101214 16Source: Compustat, Lipper, Dow Jones Indexes, FactSet, Goldman Sachs Asset Management, and GS Global ECS Research.Exhibit 6: Global macro hedge funds have outperformed S&P 500 and other funds YTDas of November 11, 2011AverageYTDReturnGlobal Macro FundsS&P 500Large Cap Core Mutual FundsHedge FundsEquity Long/Short Funds3.7 %2.30.2(1.6)(4.9)No. ofFundsAssets( bil)21 189262855046128256StdDev13 %41110Source: Compustat, Lipper, Dow Jones Indexes, FactSet, Goldman Sachs Asset Management, and GS Global ECS Research.Goldman Sachs Global Economics, Commodities and Strategy Research7
November 21, 2011United States“Stocks that matter most”: The hedge fund VIP listOur hedge fund VIP list (Bloomberg ticker: GSTHHVIP ) consists of stocks in whichfundamentally-driven hedge funds have a large stake. We define stocks that “mattermost” to hedge funds as the positions that appear most frequently among the top tenholdings within hedge fund portfolios. For this analysis, we limit our hedge fund universeto those funds with 10 to 200 distinct equity positions in an attempt to isolatefundamentally-driven investors from quantitative funds or funds that mirror private equityinvestments.Our hedge fund VIP list offers investment ideas and tracks long exposure of hedgefunds. By construction, the VIP list identifies the 50 stocks whose performance will largelyinfluence the long side of many fundamentally driven hedge funds. The VIP basket laggedthe S&P 500 by 1,293 bp during 2H 2008 (-41% vs. -29%). It outperformed the S&P 500 by1,391 bp in 2009 (40% vs. 27%) and by 443 bp in 2010 (19% vs. 15%). In 2011 YTD throughNovember 15, the VIP basket underperformed the S&P 500 by 347 bp (-1.7% vs. 1.8%).The basket of the 50 stocks that “matter most” has outperformed the S&P 500 by 60bp on a quarterly basis since 2001, with a Sharpe ratio of 0.22. As illustrated in Exhibit 7,the VIP list underperformed the S&P 500 during 3Q 2011 by 465 bp (-18.5% vs. -13.9%).Since then, the VIP list has outperformed the S&P 500 by 275 bp (14.2% vs. 11.5%).From an implementation standpoint, the hedge fund VIP list offers an efficient vehiclefor investors seeking to “follow the smart money” based on 13-F filings. The VIPbasket has a large-cap bias with a median market capitalization of 42 billion comparedwith 11 billion for the S&P 500.Our hedge fund VIP basket is not sector neutral to the S&P 500. The VIP list containsstocks from nine of the ten sectors with Utilities absent. The VIP basket overweights theConsumer Discretionary sector (22%) and underweights Industrials (2%) relative to thebroad market index.Turnover for the basket during 3Q 2011 was slightly below the historical average,with 14 new stocks entering the VIP list compared with an average quarterly turnover of 17stocks since 2001.Exhibit 7: Stocks that “matter most” have outperformed by 60 bp on average each quarter since 2001 (42 9Jun-0995Dec-0864 %3QYTD-18.5% -1.7%-13.9% 1.8%Jun-08Hit rate of outperformancesince May 2001ReturnsVIP ListS&P 500100Dec-0760 bp0.22Jun-07Average Excess Return (bp)Sharpe RatioCurrent 110105Dec-06269110Jun-06Standard Deviation115Dec-05674 bp18592(80)(785)Jun-05Maximum75th PercentileMedian25th PercentileMinimum(Relative Return vs. SPX)120Dec-04Quarterly Relative Return vs. SPXStocks that "Matter Most"Bloomberg: GSTHHVIP Jun-04Bloomberg GSTHHVIP 125Dec-03Stocks that "Matter Most"Hedge Fund Stocks Total Return (100 Dec 2003)as of November 15, 2011Source: Lionshare via FactSet, IDC and Goldman Sachs Global ECS Research.Goldman Sachs Global Economics, Commodities and Strategy Research8
November 21, 2011United StatesGSTHHVIP: 50 stocks that “matter most” to hedge fundsExhibit 8: Very Important Positions (VIP) for hedge funds50 stocks that most frequently appear among the largest 10 holdings of hedge fundsCompanyTickerAAPLApple Inc.GOOGGoogle Inc. Cl AMSFTMicrosoft Corp.JPMJPMorgan Chase & Co.PFEPfizer Inc.QCOMQUALCOMM Inc.GMGeneral Motors Co.LYBLyondellBasell Industries N.V. Cl ALiberty Interactive Corp. Interactive SeLINTABIDUBaidu Inc. ADSAMZNAmazon.com Inc.APCAnadarko Petroleum Corp.LVSLas Vegas Sands Corp.VVisa Inc.WFCWells Fargo & Co.CSCOCisco Systems Inc.XOMExxon Mobil Corp.CCitigroup Inc.CHTRCharter Communications Inc. Cl ACITCIT Group Inc.MAMasterCard Inc. Cl AWilliams Cos.WMBBPBP PLC ADSNewmont Mining Corp.NEMORCLOracle Corp.VCVisteon Corp.YHOOYahoo! Inc.AMTAmerican Tower Corp.Comcast Corp. Cl ACMCSAEXPEExpedia Inc.LEALear Corp.NWSANews Corp. Cl APMPhilip Morris International Inc.WLPWellPoint Inc.ABXBarrick Gold Corp.Crown Castle International Corp. CCICVSCVS Caremark Corp.Dollar Thrifty Automotive Group Inc DTGJNJJohnson & JohnsonPGProcter & Gamble Co.SUNSunoco Inc.Valeant Pharmaceuticals International VRXWMTWal-Mart Stores Inc.CHKChesapeake Energy Corp.EMCEMC Corp.ESVENSCO PLC ADSHess Corp.HESInternational Business Machines CoIBMMMacy's Inc.Occidental Petroleum Corp.OXYSub-sectorComputer HardwareInternet Software & ServicesSystems SoftwareOther Diversified Financial ServicesPharmaceuticalsCommunications EquipmentAutomobile ManufacturersSpecialty ChemicalsCatalog RetailInternet Software & ServicesInternet RetailOil & Gas Exploration & ProductionCasinos & GamingData Processing & Outsourced ServicesDiversified BanksCommunications EquipmentIntegrated Oil & GasOther Diversified Financial ServicesCable & SatelliteRegional BanksData Processing & Outsourced ServicesOil & Gas Storage & TransportationIntegrated Oil & GasGoldSystems SoftwareAuto Parts & EquipmentInternet Software & ServicesWireless Telecommunication ServicesCable & SatelliteInternet RetailAuto Parts & EquipmentMovies & EntertainmentTobaccoManaged Health CareGoldWireless Telecommunication ServicesDrug RetailTruckingPharmaceuticalsHousehold ProductsOil & Gas Refining & MarketingPharmaceuticalsHypermarkets & Super CentersOil & Gas Exploration & ProductionComputer Storage & PeripheralsOil & Gas DrillingIntegrated Oil & GasIT Consulting & Other ServicesDepartment StoresIntegrated Oil & GasAverageMedianEquityCap( bil) 2221380 7942No. of fundswith 10 to 200positionsowning 0212717212124233429AverageNo. of fundsportfolio weightwith stock aswhen stockTop 10 holdingranks among30-Sep-11Top 10 713513413513620166%6% of Equity Capowned byHedge 418181428323573112416153155111110 %5TotalReturnYTD21 )(17)312328%6Note: Based on our analysis of 558 hedge funds with 429 billion in equity assets that own between 10 and 200 individual stock positions.New stocks in basket listed in bold.Holdings as of September 30, 2011; Pricing as of November 15, 2011.Source: Lionshare via FactSet, IDC, and Goldman Sachs Global ECS Research.Goldman Sachs Global Economics, Commodities and Strategy Research9
November 21, 2011United StatesThe impact of hedge funds: Look at the “concentrated” positionsWe define “concentration” as the share of market capitalization owned in aggregateby hedge funds. The strategy of buying the 20 most concentrated stocks has a strong trackrecord over more than 10 years. Since 2001, the strategy has outperformed the market 69%of the time by an average of 271 bp per quarter (not annualized). The back test suggeststhat this strategy works in an upward trending market but tends to perform poorly duringchoppy or flat markets. The stocks in the basket tend to be mid-caps (at the lower end ofthe S&P 500 capitalization distribution), which have outperformed large-caps from 2004 to2007, contributing to the attractive back-test results. The baskets are not sector neutralversus the S&P 500.Stocks with the “most concentrated” hedge fund ownership underperformed theS&P 500 in 2011 YTD by 62 bp (1.2% vs. 1.8%). The “most concentrated” stocks laggedfor most of 2007 and 2008, but significantly outperformed in 2009 (81.4%% vs. 26.5%) and2010 ( 15.9% vs. 15.1%). Our “most concentrated” basket underperformed the S&P 500by 322 bp in 3Q 2011 (-17.1% vs. -13.9%) after outperforming by 230 bp in 1H 2011 (8.3% vs.6.0%).Our “least concentrated” basket underperformed the S&P 500 in 2011 YTD by 13 bp(1.7% vs. 1.8%). The “least concentrated” basket outperformed the market by 51 bp in 3Q2011 (-13.4% vs. -13.9%) and outperformed by 92 bp in 1H 2011 (6.9% vs. 6.0%).Exhibit 9: “Most concentrated” underperformed SPX by 62 bp YTD. “Least concentrated” underperformed by 13 bpas of November 15, ay-1050 %Feb-1069 %50Nov-09Hit rate of outperformancesince May 200160Aug-0954 bp0.15Feb-09271 bp0.3870May-09Avg Excess Return (bp)Sharpe RatioMOSTConcentrated GSTHHFHI 80Aug-0835490Nov-08709100Feb-08Standard Deviation110Aug-071,225 bp2872(195)(503)Nov-072,413 bp726347(240)(1347)LEASTConcentrated GSTHHFSL 120Feb-07Maximum75th PercentileMedian25th PercentileMinimum(relative returns vs. SPX)130May-07"Least"Relative Total Return (100 Feb 21, 2007)"Most" GSTHHFHI GSTHHFSL S&P 500 Hedge Fund Baskets140Quarterly Relative Return vs. SPXMay-08Hedge Fund ConcentrationSource: Lionshare via FactSet, IDC, and Goldman Sachs Global ECS Research.Goldman Sachs Global Economics, Commodities and Strategy Research10
November 21, 2011United StatesGoldman Sachs S&P 500 “concentrated” hedge fund basketsExhibit 10: The 20 most concentrated stocks in the S&P 500 Bloomberg: GSTHHFHI Holdings as of September 30, 2011; Pricing as of November 15, 2011S&P 500: Twenty MOST CONCENTRATED Hedge Fund Holdings (Bloomberg Ticker: GSTHHFHI)CompanyTickerSectorSub-sectorSears Holdings Corp.AutoNation Inc.E*TRADE Financial Corp.Family Dollar Stores Inc.AutoZone Inc.Beam IncLife Technologies Corp.Motorola Solutions Inc.Sunoco Inc.CareFusion Corp.VeriSign Inc.J.C. Penney Co. Inc.Williams Cos.Netflix Inc.Tenet Healthcare Corp.SLM Corp.Expedia Inc.INVESCO Ltd.Wyndham Worldwide Corp.DaVita XTHCSLMEXPEIVZWYNDVAConsumer DiscretionaryConsumer DiscretionaryFinancialsConsumer DiscretionaryConsumer DiscretionaryConsumer StaplesHealth CareInformation TechnologyEnergyHealth CareInformation TechnologyConsumer DiscretionaryEnergyConsumer DiscretionaryHealth CareFinancialsConsumer DiscretionaryFinancialsConsumer DiscretionaryHealth CareDepartment StoresAutomotive RetailInvestment Banking & BrokerageGeneral Merchandise StoresAutomotive RetailDistillers & VintnersLife Sciences Tools & ServicesCommunications EquipmentOil & Gas Refining & MarketingHealth Care EquipmentInternet Software & ServicesDepartment StoresOil & Gas Storage & TransportationInternet RetailHealth Care FacilitiesConsumer FinanceInternet RetailAsset Management & Custody BanksHotels Resorts & Cruise LinesHealth Care ServicesEquityCap( bil)GSTHHFHI Basket (average)S&P 500 (average)Total 25(7)(3)11229(51)(24)1113(14)1761%1% of equity capowned byHedge 8181825%5Source: Lionshare via FactSet, IDC and Goldman Sachs Global ECS Research.Exhibit 11: The 20 least concentrated stocks in the S&P 500 Bloomberg: GSTHHFSL Holdings as of September 30, 2011; Pricing as of November 15, 2011S&P 500: Twenty LEAST CONCENTRATED Hedge Fund Holdings (Bloomberg Ticker: GSTHHFSL)CompanyTickerCincinnati Financial Corp.CINFSigma-Aldrich Corp.SIALPublic StoragePSARoper Industries Inc.ROPEquity ResidentialEQRWaste Management Inc.WMChevron Corp.CVXStericycle Inc.SRCLBB&T Corp.BBTInternational Business Machines CIBMGeneral Electric Co.GEC.H. Robinson Worldwide Inc.CHRWMcCormick & Co. Inc.MKCVulcan Materials Co.VMCIllinois Tool Works Inc.ITWExxon Mobil Corp.XOMAT&T Inc.TT. Rowe Price Group Inc.TROWJohnson & JohnsonJNJHCP sFinancialsInformation TechnologyIndustrialsIndustrialsConsumer StaplesMaterialsIndustrialsEnergyTelecom ServicesFinancialsHealth CareFinancialsProperty & Casualty InsuranceSpecialty ChemicalsSpecialized REITsElectrical Components & EquipmentResidential REITsEnvironmental & Facilities ServicesIntegrated Oil & GasEnvironmental & Facilities ServicesRegional BanksIT Consulting & Other ServicesIndustrial ConglomeratesAir Freight & LogisticsPackaged Foods & MeatsConstruction MaterialsIndustrial MachineryIntegrated Oil & GasIntegrated Telecommunication ServicesAsset Management & Custody BanksPharmaceuticalsSpecialized REITsGSTHHFSL Basket (average)S&P 500 (average)EquityCap( tal 2%1% of equity capowned byHedge 60.60.60.60.60.60.60.60.60.5%5.1Source: Lionshare via FactSet, IDC and Goldman Sachs Global ECS Research.Goldman Sachs Global Economics, Commodities and Strategy Research11
November 21, 2011United StatesTake a walk on the short side: Exploring hedge fund net exposureShort positions shed light on the “other side” of fund portfoliosWe combined 655 billion of single-stock and ETF long holdings in 13-F filings of 679hedge funds with our estimate of hedge fund short positions. We estimate hedge fundsaccounted for 85% of total short interest positions, or 417 billion of the 491 billion insingle-stock, ETF and market index short interest positions filed with exchanges as ofSeptember 30, 2011. Our analysis suggests the typical hedge fund operates 36% net long(net/long), versus 46% in 2Q 2011. We estimate roughly 20% of short positioning isconducted via ETFs with 15% occurring at the broad index level.Short positions offer more comprehensive insight to hedge fund sector tilts. Ouranalysis of short interest data suggests that hedge fund sector net exposure may differfrom what 13-F filings of long positions would indicate.During prior quarters, short interest data suggested that hedge funds used allocationdifferences between long and short portfolios to “hedge” their long exposure. Since2010, large allocation differences further skew sector positioning relative to theRussell 3000. Hedge fund long exposure shows funds are overweight ConsumerDiscretionary relative to the Russell 3000 (18.5% versus 12.3%). Short interest dataindicates Consumer Discretionary accounts for 15.8% of all short positions. Combininglong and short data, hedge funds appear to hold a 23.2% net weighting in ConsumerDiscretionary and are more overweight relative to the Russell 3000 than long exposuresuggests. Similar portfolio skew occurs in the overweights of the Materials and Energysectors and underweights of the Financials, Consumer Staples, and Industrials sectors.Hedge funds’ net long weighting in Consumer Discretionary is the highest of allsectors. Hedge funds are most overweight the sector relative to the Russell 3000 (23% vs.12%). Mutual funds are only 30 bp overweight relative to the index (13%).Hedge Funds reduced net exposure to all S&P 500 sectors during 3Q 2011. Financialsnet long exposure in fell the most relative to 2Q 2011 (18% net long versus 39% lastquarter).Exhibit 12: Estimated hedge fund long, short, and net exposure, by sector ( in billions)Holdings as of September 30, 2011; pricing as of November 15, 2011Overweight / ck PositionsETF PositionsHedge Fund LONG 1191 121 462 48 722 74 1213 124 742 76 140 15 141 15 591 60 382 40 792 81 63817 655SHORTStock PositionsETF PositionsEstimated SHORT 588 66 163 19 2912 41 5818 76 419 50 72 9 113 14 368 43 248 32 5313 66 33384 417 1875545 % 672960 % 1153244 % 2004839 % 1262534 % 24640 % 3016% 1031728 % 72821 % 1481518 % 1,07223736 %23 %121,088 bp12 %4859 bp14 %10359 bp20 %19147 bp11 %15(924)bp100 %100E
Hedge fund holdings represent 3% of the equity market cap of S&P 500 stocks. Excluding S&P 500 stocks, hedge funds owned an additional 121 billion of Russell 1000 market cap. Hedge fund ownership of large-cap stocks is low relative to small-cap stocks as it requires more capital to own a sizable portion of market cap. Although hedge funds