Transcription
Cost of Care Survey 2015Genworth 2015Cost of Care SurveyHome Care Providers, Adult Day Health Care Facilities,Assisted Living Facilities and Nursing Homes130568 03/20/15
Cost of Care Survey 2015Long term care plans start withthe Genworth 2015 Cost of Care SurveyThe Genworth Cost of Care Survey has beenthe foundation for long term care planning since2004. Knowing the costs of different types ofcare — whether the care is provided at homeor in a facility — can help you plan for theseexpenses. The 2015 survey, conducted byCareScout, is the most comprehensive ofits kind, covering 440 regions across the U.S.and based on data collected from more than47,000 provider survey outreaches.70%How important is it?This depth of detail can help you make morelocalized, personalized estimates of what longterm care may cost you.For more than 40 years, Genworth has been aleading provider of long term care insurance.*Just as important, we have an ongoing commitmentto educating consumers, financial professionals,policymakers and others on the importance ofplanning for long term care.An advance plan is essential to managing theimpacts of long term care. The cost data in thissurvey report is a great starting point because itcould help you understand whether you mightneed to pursue alternative funding sources forpotential care.Take the first step and start thinking about whatyour long term care plan will look like.At least 70% of people overthe age of 65 will require someform of long term care servicesand support during their lives.*** L ong term care insurance is underwritten by Genworth Life Insurance Company and in New Yorkby Genworth Life Insurance Company of New York. Administrative Office: Richmond, VA** 2015 Medicare & You, National Medicare Handbook, Centers for Medicare & Medicaid Services, September 20141
Cost of Care Survey 20152
Cost of Care Survey 2015ContentsUnderstanding Long Term CareSummary of 2015 Survey Findings . 4Paying for Long Term Care Services . 6The True Impact of Long Term Care. 8Start the Planning Process . 9Cost of Care MapsHomemaker Services. 12Home Health Aide Services. 13Adult Day Health Care . 14Assisted Living Facility (One Bedroom – Single Occupancy) . 15Nursing Home (Semi-Private Room) . 16Nursing Home (Private Room) . 17National and State Cost of Care Tables . 18Homemaker ServicesHome Health Aide ServicesAdult Day Health CareAssisted Living Facility (One Bedroom – Single Occupancy)Nursing Home (Semi-Private Room)Nursing Home (Private Room)Data Table End Notes . 71AppendixRegion Definitions (Counties) . 72Methodology . 853
Cost of Care Survey 2015Summary of 2015 Survey FindingsOver the past 12 years, Genworth has uncovered several trends in the long term care services landscape.Not surprisingly, the cost of all types of care has steadily risen over the years — from homemaker services tonursing home care. However, the cost of care provided in people’s homes has not risen by the same degreeas care provided in facilities. Genworth’s experience shows that the majority of claims begin in the home.Plus, our research shows that being able to stay at home is very important for most people thinking aboutbuying long term care insurance.* In other words, this gradual increase in cost for home care is good newsfor many consumers.Long term care can be provided in a variety of settings. A licensed health care practitioner, such as aphysician, registered nurse or social worker, can determine a plan of care that could include the following:COMMUNITYHOMEHomemaker Services: Service providing help withhousehold tasks that cannot be managed alone.Homemaker services includes “hands-off”care suchas cooking, cleaning and running errands.4Home Health Aide Services: Home health aides offerservices to people who need more extensive care.It is “hands-on” personal care, but not medical care.This is the rate charged by a non-Medicare certified,licensed agency.Adult Day Health Care (ADC): Provides social andsupport services in a community-based, protectivesetting. Various models are designed to offersocialization, supervision and structured activities.Some programs may provide personal care,transportation, medical management and meals.* Genworth LTCi Purchaser Study, 2012NATIONALMEDIANHOURLY RATEINCREASEOVER2014FIVE-YEARANNUALGROWTH1 202.63%1.61%NATIONALMEDIANHOURLY RATEINCREASEOVER2014FIVE-YEARANNUALGROWTH1 201.27%1.03%NATIONALMEDIANDAILY RATEINCREASEOVER2014FIVE-YEARANNUALGROWTH1 695.94%2.79%
Cost of Care Survey 2015FACILITYAssisted Living Facility (ALF): Residentialarrangements providing personal care andhealth services. The level of care may not be asextensive as that of a nursing home. Assistedliving is often an alternative to a nursing home,or an intermediate level of long term care.Nursing Home Care: These facilities often providea higher level of supervision and care than AssistedLiving Facilities. They offer residents personal careassistance, room and board, supervision, medication,therapies and rehabilitation, and on-site nursingcare 24 hours a day.NATIONALMEDIANMONTHLY RATEINCREASEOVER2014FIVE-YEARANNUALGROWTH1 3,6002.86%2.48%Semi-Private RoomNATIONALMEDIANDAILY RATEINCREASEOVER2014FIVE-YEARANNUALGROWTH1 2203.77%3.53%Private RoomNATIONALMEDIANDAILY RATEINCREASEOVER2014FIVE-YEARANNUALGROWTH1 2504.17%3.95%Percentage increase represents the compound annual growth rate for surveys conducted from 2010 to 2015.1 5
Cost of Care Survey 2015Paying for Long Term Care ServicesGenerally speaking, there are four ways to obtain long term care services. You can pay for serviceson your own (self-fund), rely on family and friends for help, work with Medicare/Medicaid, or use long termcare insurance. Keep in mind that you may combine more than one of these solutions to help cover yourlong term care costs.Self-FundingIf you have a pool of money set aside forretirement expenses, it could be a source offunds for long term care costs. Or if a lovedone needs long term care, your income maybe adequate to cover their expenses.Medicare/MedicaidMedicare and Medicaid may contribute towardlong term care expenses; however, there maybe specific coverage limitations and assetrequirements that you should be aware of.Family and FriendsYou may also plan to rely on family or friends.This can be a great solution for familiescommitted to providing care, but it canbe physically and emotionally demanding.Long Term Care Insuranceand other Funding SolutionsIf you qualify for long term care insurance, it canbe a way to help pay for long term care services.There are also products that combine long termcare protection with life insurance and annuities.Having a plan that incorporates these types of solutions can help you get the kind of care you wantand need, whether it’s provided in your home or in a facility. Such a plan can also help reduce the burdenplaced on family and friends who have volunteered to help care for you, and protect your assets from thecost of care.6
Cost of Care Survey 20157
Cost of Care Survey 2015The True Impact of Long Term CareAs highlighted in this survey report, long term carecan have a major financial impact. While anticipatingthis impact is extremely important, it is only one ofmany components to address when planning. Theimpacts can extend far beyond dollars, affectingcareers and personal lives.For instance, being a caregiver can eat away at worktime and leisure time, impacting both income andwell-being. Caregivers’ health and relationships canbe affected by the demands they face. Small andlarge expenses can crop up, from groceries for aloved one to home modifications like ramps andgrab handles. It all adds up over time.But often, taking a step back from these everydaypressures and emotional and physical challengescan offer new opportunities as part of the caregiverexperience. By making adjustments, caregiverscan find ways to adapt and change perspectives.There are also many places in the community to findsupport and education on the caregiving journey.8Family Caregivers Speak UpALMOSTHALF(46%) of family caregivers spent morethan 5,000 each year in caregiving costs.†33%spent more than30 hours per weekon caregiving66%experienced care-relateddistractions such asphone calls and emailswhile working60%said caregiving dutieshad a negative effecton their jobs† “Senior Care Cost Index.” Caring.com. Caring, Inc.,Sept. 2014. Web. 13 Feb. 2015. dex-2014
Cost of Care Survey 2015Start the Planning ProcessAny plan is almost always better than none. Genworth can help you kick-start your own planning processwith informative publications and tools.Begin the journey for the long term.Let’s Talk: Conversationsthat make a differenceGenworth 2015Cost of Care OnlineThe Plan for LivingWorkbookIt can be difficult to talk to lovedones about what the future mayhold. Get the conversationstarted with “Let’s Talk.” Theinformation and tools offeredon genworth.com/lets-talk willhelp you prepare for productiveconversations. Talking now andtaking charge can prepare youand your loved ones for life’stwists and turns.Our website —genworth.com/costofcare —provides much more informationabout the cost of care. Theinteractive map features daily,monthly and annual long termcare rates for 440 regionsthroughout the U.S., offers theability to compare up to threelocations, and calculates projectedcosts for up to 30 years out.Outline your goals for acomfortable and fulfillingretirement. “The Plan for LivingWorkbook” identifies some risksyou may face and provides thetools to help you develop anaction plan for the long term.9
Cost of Care Survey 2015Genworth 2015 Cost of Care MapsGenworth 2015 Cost of CareNational and State Data Tables11
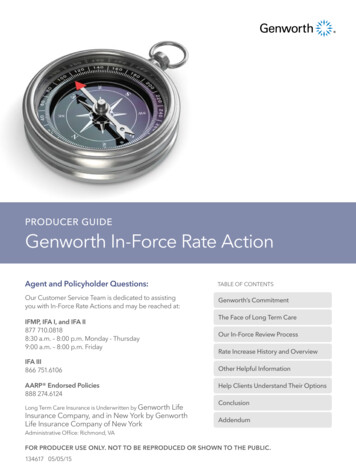
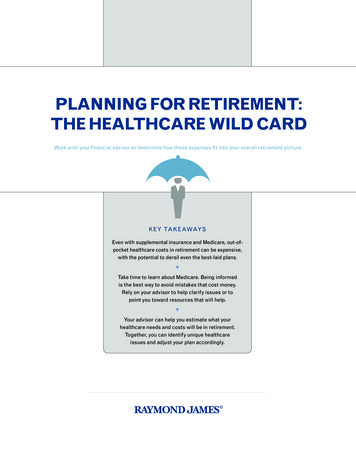
12CANV 48,048AK 59,488 51,480OR 49,764WA 54,088AZ 45,760UT 48,048ID 43,769HI 54,912NM 43,426CO 49,718WY 46,561MT 52,624TX 42,328OKMOLAAL 36,608TN 40,704KYGAFL 41,184SCDC 45,760NJ 46,332MD 44,616DE 45,760RI 53,768CT 45,760MA 54,340NH 52,899ME 50,336Numbers exclude Puerto RicoNC 40,040VA 41,184PA 41,184WVNY 48,048VT 48,048 46,790 36,608 41,184OH 43,564 43,426IN 43,472MI 45,485USA 44,616MS 36,608 34,320ARIL 48,048WI 48,048 38,896 43,472IA 51,343MN 53,768 43,426KS 43,426NE 50,222SD 49,764ND 59,854Home Care: Homemaker Services Median Annual Cost
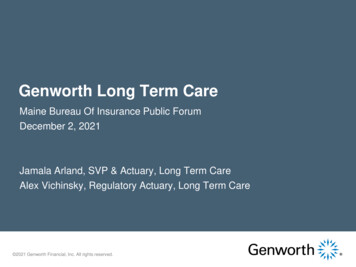
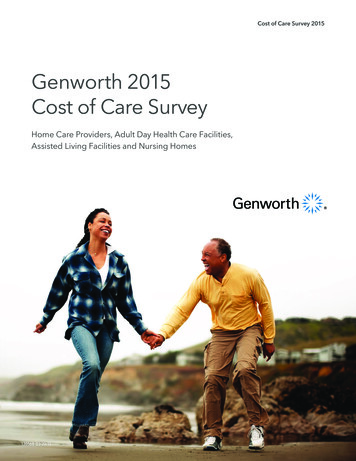
13CANV 49,489AK 59,488 52,624OR 51,480WA 54,912AZ 45,760UT 48,048ID 46,332HI 56,056NM 46,057CO 50,336WY 49,421MT 52,624TX 42,603OK 46,561KS 45,760NE 52,624SD 52,006ND 62,142LAAL 37,752TN 41,184KYGAFL 43,472SCDC 50,336NJ 48,506MD 45,760DE 50,336RI 56,925CT 50,336MA 57,200NH 54,912ME 50,794Numbers exclude Puerto RicoNC 41,710VA 43,472PA 47,911NYVT 50,336 52,624 42,328WV 36,608 41,184OH 45,348 43,907IN 44,616MI 46,904USA 45,760MS 37,752 36,608ARIL 49,192WI 50,336 38,896MO 43,472IA 52,624MN 57,200Home Care: Home Health Aide Services Median Annual Cost
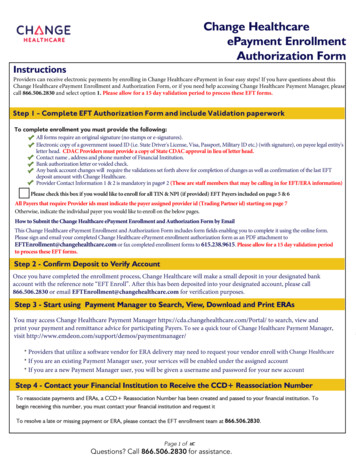
14CANV 18,070AK 31,829 20,020OR 23,010WA 17,563AZ 20,800UT 23,140ID 30,225HI 17,225NM 25,618CO 16,900WY 13,000MT 24,765KSTX 9,100OK 15,600 20,800NE 14,560SD 18,720ND 19,562LA 16,250ARAL 9,425TN 16,120KYGANYFL 16,900SCDC 25,740NJ 22,165MD 20,540DE 17,995RI 17,290CT 20,150MA 16,900NH 16,900ME 28,080Numbers exclude Puerto RicoNC 13,260VA 16,900PAVT 32,136 22,100 15,600 14,381WV 18,720 15,600OH 14,300 17,430IN 20,800MI 20,800USA 17,904MS 9,100IL 17,550WI 16,900 20,800MO 20,795IA 15,600MN 20,267Community Care: Adult Day Health Care Median Annual Cost
15CANV 38,850AK 68,430 45,000OR 46,560WA 55,500AZ 41,010UT 36,000ID 38,880HI 48,000NM 42,000CO 45,000WY 46,800MT 42,720TX 42,540OK 40,140KS 50,250NE 43,530SD 36,276ND 38,865LAAL 36,900TN 40,740KYGANY 49,200FL 37,800SCRI 63,900CT 66,900MA 63,600NH 61,230DC 94,050NJ 68,700MD 46,800DE 68,940VTME 57,600Numbers exclude Puerto RicoNC 36,000VA 47,196PA 42,660 37,500WV 42,000 34,560OH 46,680 40,200IN 44,310MI 39,000USA 43,200MS 37,800 36,120ARIL 48,600WI 47,760 36,750MO 30,300IA 42,000MN 41,613 48,240Facility Care: Assisted Living Facility (One Bedroom — Single Occupancy) Median Annual Cost
16CANV 86,140AK 281,415 89,396OR 95,904WA 96,933AZ 70,080UT 63,875ID 83,220HI 124,830NM 74,643CO 83,950WY 80,300MT 76,650TX 51,100OKLAAL 69,715TN 70,080KYGAFL 87,600SCDC 98,550NJ 116,800MD 101,379DE 109,500RI 93,075CT 146,000MA 128,845NH 115,340ME 100,375Numbers exclude Puerto RicoNC 75,190VA 80,483PA 69,350WVNY 131,758VT 102,018 105,485 102,748 66,795OH 76,650 75,920IN 78,475MI 90,703USA 80,300MS 74,825 56,575ARIL 64,788WI 90,064 56,575MO 55,663IA 63,875MN 84,406 53,290KS 60,225NE 71,785SD 72,770ND 100,375Facility Care: Nursing Home (Semi-Private Room) Median Annual Cost
17CANV 98,550AK 281,415 104,025OR 102,018WA 105,631AZ 85,045UT 76,650ID 88,513HI 135,050NM 85,410CO 93,531WY 89,243MT 80,300TX 68,620OK 60,225KS 65,700NE 79,570SD 77,380ND 104,938LAAL 76,267TN 75,555KYGAFL 96,725SCDC 98,550NJ 127,750MD 110,230DE 117,895RI 103,113CT 158,775MA 139,580NH 122,275ME 107,675Numbers exclude Puerto RicoNC 82,125VA 92,688PA 75,008WVNY 136,437VT 105,120 113,150 107,631 71,175OH 85,775 87,235IN 91,250MI 99,098USA 91,250MS 80,300 62,050ARIL 74,460WI 99,499 65,850MO 60,773IA 68,255MN 96,021Facility Care: Nursing Home (Private Room) Median Annual Cost
USAI Cost of Care Survey 2015USAMINIMUMHomemakerServicesRATE RANGEMEDIANMAXIMUMMEDIANANNUAL RATE1FIVE-YEARANNUALGROWTH2 8 20 40 44,6162% 8 20 40 45,7601% 10 69 242 17,9043% 600 3,600 11,250 43,2002% 90 220 1,255 80,3004% 101 250 1,255 91,2504%HOMEHourly RatesHome HealthAide ServicesCOMMUNITYHourly RatesAdult DayHealth CareDaily RatesAssistedLiving Facility(One Bedroom –Single Occupancy)FACILITYMonthly RatesNursing Home(Semi-PrivateRoom)Daily RatesNursing Home(Private Room)Daily Rates18
Cost of Care Survey 2015I AlabamaAlabamaMINIMUMHomemakerServicesRATE RANGEMEDIANMAXIMUMMEDIANANNUAL RATE1FIVE-YEARANNUALGROWTH2 13 16 21 36,6081% 13 17 27 37,7522% 20 36 122 9,4258% 930 3,075 6,524 36,9002% 130 191 289 69,7154% 140 209 396 76,2674%HOMEHourly RatesHome HealthAide ServicesCOMMUNITYHourly RatesAdult DayHealth CareDaily RatesAssistedLiving Facility(One Bedroom –Single Occupancy)FACILITYMonthly RatesNursing Home(Semi-PrivateRoom)Daily RatesNursing Home(Private Room)Daily Rates19
AlaskaI Cost of Care Survey 2015AlaskaMINIMUMHomemakerServicesRATE RANGEMEDIANMAXIMUMMEDIANANNUAL RATE1FIVE-YEARANNUALGROWTH2 22 26 29 59,4880% 24 26 29 59,4881% 84 122 168 31,8297% 800 5,703 8,250 68,4301% 461 771 1,255 281,4155% 461 771 1,255 281,4157%HOMEHourly RatesHome HealthAide ServicesCOMMUNITYHourly RatesAdult DayHealth CareDaily RatesAssistedLiving Facility(One Bedroom –Single Occupancy)FACILITYMonthly RatesNursing Home(Semi-PrivateRoom)Daily RatesNursing Home(Private Room)Daily Rates20
Cost of Care Survey 2015I ArizonaArizonaMINIMUMHomemakerServicesRATE RANGEMEDIANMAXIMUMMEDIANANNUAL RATE1FIVE-YEARANNUALGROWTH2 10 20 25 45,7601% 14 20 25 45,7600% 65 80 138 20,8001% 1,400 3,418 7,072 41,0102% 130 192 550 70,0802% 164 233 650 85,0451%HOMEHourly RatesHome HealthAide ServicesCOMMUNITYHourly RatesAdult DayHealth CareDaily RatesAssistedLiving Facility(One Bedroom –Single Occupancy)FACILITYMonthly RatesNursing Home(Semi-PrivateRoom)Daily RatesNursing Home(Private Room)Daily Rates21
ArkansasI Cost of Care Survey 2015ArkansasMINIMUMHomemakerServicesRATE RANGEMEDIANMAXIMUMMEDIANANNUAL RATE1FIVE-YEARANNUALGROWTH2 11 17 21 38,8961% 11 17 21 38,8961% 48 80 119 20,8005% 1,100 3,063 5,900 36,7504% 113 155 435 56,5752% 130 180 865 65,8503%HOMEHourly RatesHome HealthAide ServicesCOMMUNITYHourly RatesAdult DayHealth CareDaily RatesAssistedLiving Facility(One Bedroom –Single Occupancy)FACILITYMonthly RatesNursing Home(Semi-PrivateRoom)Daily RatesNursing Home(Private Room)Daily Rates22
Cost of Care Survey 2015I CaliforniaCaliforniaMINIMUMHomemakerServicesRATE RANGEMEDIANMAXIMUMMEDIANANNUAL RATE1FIVE-YEARANNUALGROWTH2 12 23 35 51,4802% 12 23 35 52,6242% 25 77 195 20,0200% 698 3,750 10,650 45,0001% 93 245 913 89,3964% 144 285 913 104,0254%HOMEHourly RatesHome HealthAide ServicesCOMMUNITYHourly RatesAdult DayHealth CareDaily RatesAssistedLiving Facility(One Bedroom –Single Occupancy)FACILITYMonthly RatesNursing Home(Semi-PrivateRoom)Daily RatesNursing Home(Private Room)Daily Rates23
ColoradoI Cost of Care Survey 2015ColoradoMINIMUMHomemakerServicesRATE RANGEMEDIANMAXIMUMMEDIANANNUAL RATE1FIVE-YEARANNUALGROWTH2 13 22 30 49,7182% 13 22 31 50,3361% 47 65 210 16,9003% 2,050 3,750 8,850 45,0002% 173 230 650 83,9503% 179 256 650 93,5313%HOMEHourly RatesHome HealthAide ServicesCOMMUNITYHourly RatesAdult DayHealth CareDaily RatesAssistedLiving Facility(One Bedroom –Single Occupancy)FACILITYMonthly RatesNursing Home(Semi-PrivateRoom)Daily RatesNursing Home(Private Room)Daily Rates24
Cost of Care Survey 2015I ConnecticutConnecticutMINIMUMHomemakerServicesRATE RANGEMEDIANMAXIMUMMEDIANANNUAL RATE1FIVE-YEARANNUALGROWTH2 16 20 25 45,7602% 16 22 33 50,3360% 20 78 86 20,1501% 2,551 5,575 10,800 66,9005% 195 400 480 146,0003% 215 435 505 158,7753%HOMEHourly RatesHome HealthAide ServicesCOMMUNITYHourly RatesAdult DayHealth CareDaily RatesAssistedLiving Facility(One Bedroom –Single Occupancy)FACILITYMonthly RatesNursing Home(Semi-PrivateRoom)Daily RatesNursing Home(Private Room)Daily Rates25
DelawareI Cost of Care Survey 2015DelawareMINIMUMHomemakerServicesRATE RANGEMEDIANMAXIMUMMEDIANANNUAL RATE1FIVE-YEARANNUALGROWTH2 15 20 25 45,7600% 18 22 25 50,3361% 50 69 82 17,995-3% 5,061 5,745 8,175 68,9403% 225 300 326 109,5006% 232 323 350 117,8956%HOMEHourly RatesHome HealthAide ServicesCOMMUNITYHourly RatesAdult DayHealth CareDaily RatesAssistedLiving Facility(One Bedroom –Single Occupancy)FACILITYMonthly RatesNursing Home(Semi-PrivateRoom)Daily RatesNursing Home(Private Room)Daily Rates26
Cost of Care Survey 2015I District of ColumbiaDistrict of ColumbiaMINIMUMHomemakerServicesRATE RANGEMEDIANMAXIMUMMEDIANANNUAL RATE1FIVE-YEARANNUALGROWTH2 18 20 22 45,7601% 19 22 23 50,3361% 61 99 107 25,7404% 4,950 7,838 8,600 94,05013% 270 270 270 98,550N/A 270 270 270 98,550-6%HOMEHourly RatesHome HealthAide ServicesCOMMUNITYHourly RatesAdult DayHealth CareDaily RatesAssistedLiving Facility(One Bedroom –Single Occupancy)FACILITYMonthly RatesNursing Home(Semi-PrivateRoom)Daily RatesNursing Home(Private Room)Daily Rates27
FloridaI Cost of Care Survey 2015FloridaMINIMUMHomemakerServicesRATE RANGEMEDIANMAXIMUMMEDIANANNUAL RATE1FIVE-YEARANNUALGROWTH2 10 18 29 41,1842% 10 19 29 43,4721% 50 65 156 16,9003% 1,000 3,150 8,280 37,8004% 170 240 475 87,6003% 180 265 505 96,7253%HOMEHourly RatesHome HealthAide ServicesCOMMUNITYHourly RatesAdult DayHealth CareDaily RatesAssistedLiving Facility(One Bedroom –Single Occupancy)FACILITYMonthly RatesNursing Home(Semi-PrivateRoom)Daily RatesNursing Home(Private Room)Daily Rates28
Cost of Care Survey 2015I GeorgiaGeorgiaMINIMUMHomemakerServicesRATE RANGEMEDIANMAXIMUMMEDIANANNUAL RATE1FIVE-YEARANNUALGROWTH2 8 18 33 41,1841% 8 18 33 41,1841% 20 60 119 15,6002% 619 2,880 6,840 34,5604% 115 183 255 66,7953% 120 195 679 71,1753%HOMEHourly RatesHome HealthAide ServicesCOMMUNITYHourly RatesAdult DayHealth CareDaily RatesAssistedLiving Facility(One Bedroom –Single Occupancy)FACILITYMonthly RatesNursing Home(Semi-PrivateRoom)Daily RatesNursing Home(Private Room)Daily Rates29
HawaiiI Cost of Care Survey 2015HawaiiMINIMUMHomemakerServicesRATE RANGEMEDIANMAXIMUMMEDIANANNUAL RATE1FIVE-YEARANNUALGROWTH2 18 24 30 54,9124% 18 25 30 56,0562% 54 66 95 17,2250% 1,384 4,000 8,892 48,0001% 263 342 562 124,8302% 263 370 616 135,0503%HOMEHourly RatesHome HealthAide ServicesCOMMUNITYHourly RatesAdult DayHealth CareDaily RatesAssistedLiving Facility(One Bedroom –Single Occupancy)FACILITYMonthly RatesNursing Home(Semi-PrivateRoom)Daily RatesNursing Home(Private Room)Daily Rates30
Cost of Care Survey 2015I IdahoIdahoMINIMUMHomemakerServicesRATE RANGEMEDIANMAXIMUMMEDIANANNUAL RATE1FIVE-YEARANNUALGROWTH2 15 19 26 43,7692% 17 20 26 46,3324% 62 116 210 30,2258% 1,800 3,240 5,450 38,8800% 166 228 290 83,2204% 176 243 369 88,5133%HOMEHourly RatesHome HealthAide ServicesCOMMUNITYHourly RatesAdult DayHealth CareDaily RatesAssistedLiving Facility(One Bedroom –Single Occupancy)FACILITYMonthly RatesNursing Home(Semi-PrivateRoom)Daily RatesNursing Home(Private Room)Daily Rates31
IllinoisI Cost of Care Survey 2015IllinoisMINIMUMHomemakerServicesRATE RANGEMEDIANMAXIMUMMEDIANANNUAL RATE1FIVE-YEARANNUALGROWTH2 15 21 28 48,0482% 15 22 33 49,1921% 32 68 93 17,5502% 1,278 4,050 9,840 48,6002% 112 178 1,035 64,7883% 130 204 1,035 74,4603%HOMEHourly RatesHome HealthAide ServicesCOMMUNITYHourly RatesAdult DayHealth CareDaily RatesAssistedLiving Facility(One Bedroom –Single Occupancy)FACILITYMonthly RatesNursing Home(Semi-PrivateRoom)Daily RatesNursing Home(Private Room)Daily Rates32
Cost of Care Survey 2015I IndianaIndianaMINIMUMHomemakerServicesRATE RANGEMEDIANMAXIMUMMEDIANANNUAL RATE1FIVE-YEARANNUALGROWTH2 12 19 28 43,4721% 13 20 28 44,6161% 30 80 120 20,8005% 1,600 3,693 7,860 44,3100% 100 215 339 78,4754% 150 250 450 91,2504%HOMEHourly RatesHome HealthAide ServicesCOMMUNITYHourly RatesAdult DayHealth CareDaily RatesAssistedLiving Facility(One Bedroom –Single Occupancy)FACILITYMonthly RatesNursing Home(Semi-PrivateRoom)Daily RatesNursing Home(Private Room)Daily Rates33
IowaI Cost of Care Survey 2015IowaMINIMUMHomemakerServicesRATE RANGEMEDIANMAXIMUMMEDIANANNUAL RATE1FIVE-YEARANNUALGROWTH2 18 22 30 51,3432% 18 23 30 52,6242% 44 60 152 15,6003% 1,534 3,500 9,425 42,0002% 115 175 270 63,8754% 148 187 298 68,2554%HOMEHourly RatesHome HealthAide ServicesCOMMUNITYHourly RatesAdult DayHealth CareDaily RatesAssistedLiving Facility(One Bedroom –Single Occupancy)FACILITYMonthly RatesNursing Home(Semi-PrivateRoom)Daily RatesNursing Home(Private Room)Daily Rates34
Cost of Care Survey 2015I KansasKansasMINIMUMHomemakerServicesRATE RANGEMEDIANMAXIMUMMEDIANANNUAL RATE1FIVE-YEARANNUALGROWTH2 14 19 25 43,4261% 15 20 35 45,7602% 50 80 155 20,8004% 2,300 4,188 7,500 50,2504% 135 165 241 60,2253% 145 180 288 65,7003%HOMEHourly RatesHome HealthAide ServicesCOMMUNITYHourly RatesAdult DayHealth CareDaily RatesAssistedLiving Facility(One Bedroom –Single Occupancy)FACILITYMonthly RatesNursing Home(Semi-PrivateRoom)Daily RatesNursing Home(Private Room)Daily Rates35
KentuckyI Cost of Care Survey 2015KentuckyMINIMUMHomemakerServicesRATE RANGEMEDIANMAXIMUMMEDIANANNUAL RATE1FIVE-YEARANNUALGROWTH2 13 19 24 43,4263% 16 19 24 43,9072% 40 67 180 17,4302% 1,181 3,350 10,125 40,2006% 168 208 790 75,9204% 175 239 805 87,2355%HOMEHourly RatesHome HealthAide ServicesCOMMUNITYHourly RatesAdult DayHealth CareDaily RatesAssistedLiving Facility(One Bedroom –Single Occupancy)FACILITYMonthly RatesNursing Home(Semi-PrivateRoom)Daily RatesNursing Home(Private Room)Daily Rates36
Cost of Care Survey 2015I LouisianaLouisianaMINIMUMHomemakerServicesRATE RANGEMEDIANMAXIMUMMEDIANANNUAL RATE1FIVE-YEARANNUALGROWTH2 8 15 31 34,3201% 8 16 31 36,6081% 35 63 116 16,2502% 600 3,010 4,722 36,1200% 116 155 400 56,5754% 112 170 500 62,0504%HOMEHourly RatesHome HealthAide ServicesCOMMUNITYHourly RatesAdult DayHealth CareDaily RatesAssistedLiving Facility(One Bedroom –Single Occupancy)FACILITYMonthly RatesNursing Home(Semi-PrivateRoom)Daily RatesNursing Home(Private Room)Daily Rates37
MaineI Cost of Care Survey 2015MaineMINIMUMHomemakerServicesRATE RANGEMEDIANMAXIMUMMEDIANANNUAL RATE1FIVE-YEARANNUALGROWTH2 16 22 34 50,3362% 16 22 34 50,794-1% 76 108 168 28,0802% 1,935 4,800 8,880 57,6002% 189 275 409 100,3752% 215 295 443 107,6751%HOMEHourly RatesHome HealthAide ServicesCOMMUNITYHourly RatesAdult DayHealth CareDaily RatesAssistedLiving Facility(One Bedroom –Single Occupancy)FACILITYMonthly RatesNursing Home(Semi-PrivateRoom)Daily RatesNursing Home(Private Room)Daily Rates38
Cost of Care Survey 2015I MarylandMarylandMINIMUMHomemakerServicesRATE RANGEMEDIANMAXIMUMMEDIANANNUAL RATE1FIVE-YEARANNUALGROWTH2 9 20 26 44,6161% 11 20 27 45,7600% 50 79 96 20,5401% 1,750 3,900 8,950 46,8004% 189 278 368 101,3795% 200 302 464 110,2306%HOMEHourly RatesHome HealthAide ServicesCOMMUNITYHourly RatesAdult DayHealth CareDaily RatesAssistedLiving Facility(One Bedroom –Single Occupancy)FACILITYMonthly RatesNursing Home(Semi-PrivateRoom)Daily RatesNursing Home(Private Room)Daily Rates39
MassachusettsI Cost of Care Survey 2015MassachusettsMINIMUMHomemakerServicesRATE RANGEMEDIANMAXIMUMMEDIANANNUAL RATE1FIVE-YEARANNUALGROWTH2 14 24 31 54,3401% 16 25 34 57,2001% 30 65 93 16,9002% 1,988 5,300 9,495 63,6003% 225 353 525 128,8453% 225 382 489 139,5804%HOMEHourly RatesHome HealthAide ServicesCOMMUNITYHourly RatesAdult DayHealth CareDaily RatesAssistedLiving Facility(One Bedroom –Single Occupancy)FACILITYMonthly RatesNursing Home(Semi-PrivateRoom)Daily RatesNursing Home(Private Room)Daily Rates40
Cost of Care Survey 2015I MichiganMichiganMINIMUMHomemakerServicesRATE RANGEMEDIANMAXIMUMMEDIANANNUAL RATE1FIVE-YEARANNUALGROWTH2 10 20 26 45,4851% 10 21 28 46,9042% 35 80 175 20,8005% 800 3,250 8,465 39,0005% 187 249 363 90,7034% 197 272 464 99,0984%HOMEHourly RatesHome HealthAide ServicesCOMMUNITYHourly RatesAdult DayHealth CareDaily RatesAssistedLiving Facility(One Bedroom –Single Occupancy)FACILITYMonthly RatesNursing Home(Semi-PrivateRoom)Daily RatesNursing Home(Private Room)Daily Rates41
MinnesotaI Cost of Care Survey 2015MinnesotaMINIMUMHomemakerServicesRATE RANGEMEDIANMAXIMUMMEDIANANNUAL RATE1FIVE-YEARANNUALGROWTH2 15 24 32 53,7681% 16 25 35 57,2000% 44 78 125 20,2672% 876 3,468 10,500 41,6134% 107 231 380 84,4065% 167 263 424 96,0215%HOMEHourly RatesHome HealthAide ServicesCOMMUNITYHourly RatesAdult DayHealth CareDaily RatesAssistedLiving Facility(One Bedroom –Single Occupancy)FACILITYMonthly RatesNursing Home(Semi-PrivateRoom)Daily RatesNursing Home(Private Room)Daily Rates42
Cost of Care Survey 2015I MississippiMississippiMINIMUMHomemakerServicesRATE RANGEMEDIANMAXIMUMMEDIANANNUAL RATE1FIVE-YEARANNUALGROWTH2 15 16 25 36,6081% 15 17 25 37,7521% 35 35 75 9,100-11% 1,525 3,150 6,600 37,8003% 165 205 259 74,8253% 177 220 300 80,3003%HOMEHourly RatesHome HealthAide ServicesCOMMUNITYHourly RatesAdult DayHealth CareDaily RatesAssistedLiving Facility(One Bedroom –Single Occupancy)FACILITYMonthly RatesNursing Home(Semi-PrivateRoom)Daily RatesNursing Home(Private Room)Daily Rates43
MissouriI Cost of Care Survey 2015MissouriMINIMUMHomemakerServicesRATE RANGEMEDIANMAXIMUMMEDIANANNUAL RATE1FIVE-YEARANNUALGROWTH2 10 19 28 43,4721% 10 19 28 43,4721% 45 80 204 20,7953% 700 2,525 6,400 30,3002% 114 153 260 55,6633% 130 167 380 60,7733%HOMEHourly RatesHome HealthAide ServicesCOMMUNITYHourly RatesAdult DayHealth CareDaily RatesAssistedLiving Facility(One Bedroom –Single Occupancy)FACILITYMonthly RatesNursing Home(Semi-PrivateRoom)Daily RatesNursing Home(Private Room)Daily Rates44
Cost of Care Survey 2015I MontanaMontanaMINIMUMHomemakerServicesRATE RANGEMEDIANMAXIMUMMEDIANANNUAL RATE1FIVE-YEARANNUALGROWTH2 18 23 25 52,6244% 21 23 25 52,6243% 40 95 233 24,7657% 1,000 3,560 6,000 42,7204% 170 210 287 76,6504% 175 220 287 80,3003%HOMEHourly RatesHome HealthAide ServicesCOMMUNITYHourly RatesAdult DayHealth CareDaily RatesAssistedLiving Facility(One Bedroom –Single Occupancy)FACILITYMonthly RatesNursing Home(Semi-PrivateRoom)Daily RatesNursing Home(Private Room)Daily Rates45
NebraskaI Cost of Care Survey 2015NebraskaMINIMUMHomemakerServicesRATE RANGEMEDIANMAXIMUMMEDIANANNUAL RATE1FIVE-YEARANNUALGROWTH2 19 22 26 50,2225% 20 23 26 52,6244% 25 56 165 14,5604% 1,985 3,628 6,225 43,5301% 113 197 273 71,7853% 133 218 600 79,5704%HOMEHourly RatesHome HealthAide ServicesCOMMUNITYHourly RatesAdult DayHealth CareDaily RatesAssistedLiving Facility(One Bedroom –Single Occupancy)FACILITYMonthly RatesNursing Home(Semi-PrivateRoom)Daily RatesNursing Home(Private Room)Daily Rates46
Cost of Care Survey 2015I NevadaNevadaMINIMUMHomemakerServicesRATE RANGEMEDIANMAXIMUMMEDIANANNUAL RATE1FIVE-YEARANNUALGROWTH2 17 21 25 48,0481% 17 22 25 49,4891% 60 70 100 18,0701% 1,500 3,238 5,889 38,8503% 110 236 277 86,1404% 135 270 508 98,5505%HOMEHourly RatesHome HealthAide ServicesCOMMUNITYHourly RatesAdult DayHealth CareDaily RatesAssistedLiving Facility(One Bedroom –Single Occupancy)FACILITYMonthly RatesNursing Home(Semi-PrivateRoom)Daily RatesNursing Home(Private Room)Daily Rates47
New HampshireI Cost of Care Su
Cost of Care Survey 2015 The Genworth Cost of Care Survey has been the foundation for long term care planning since 2004. Knowing the costs of different types of care — whether the care is provided at home or in a facility — can help you plan for these expenses. The 2015 survey, conducted by CareScout, is the most comprehensive of