Transcription
Performance Analytics:Financial WorkbookLast updated: 5/12/2021 2021 Autotask Corporation
Performance Analytics WorkbooksTable of ContentsTable of ContentsTable of Contents1Welcome!1Get Started with Performance Analytics3Setting Up Your Workbook4Refresh Data and View Your Charts8Using the Financial Workbook9Viewing Key Financial Metrics14Financial Gauges16Financial Trending - Year to Date19Financial Trending: Year Over Year29Explore General Financial Data36Resource Utilization44Explore Margin47Financial Analysis: Current and Previous Fiscal Year49Labor Summary and Details: Current and Previous Years52Take Your Workbook to the Next Level54Add Linked Charts to PowerPoint Presentations55Customizing Your Data Display57Add or Update an Advanced Where Clause64Frequently Asked Questions - FAQs66About the Workbooks Data Cache69Contacting Customer Support70 2021 Autotask Corporation l Page 1 of 1
Performance Analytics WorkbooksWelcome!Welcome!Whether you are already using business metrics to help manage your business, or you are just beginning to realize thebenefits of analyzing your business data, Autotask Performance Analytics (formerly Performance Dashboards) will makethis task easier.What is a Performance Analytics Workbook?Every customer or potential customer, every ticket and project task, every sales opportunity and quote is stored in yourAutotask database. Your database tells the story of your business. And as more business owners are realizing, this storycan provide useful insights into how to make your business better.Autotask Workbooks pull out the information you need, and presents it in an easy and accessible format.lllllEach workbook brings together core metrics for one area of your business workflow to analyze your business'strends, successes, and challenge points.Workbooks present data visually so you can compare and analyze at a glance.Workbooks are easy to set up; simply open the workbook, enter the credentials provided by Autotask, and you'reready to go.Workbooks are even easier to use. Click one button to refresh data directly from pre-selected Autotask Performance Dashboards Data Cache and then start scanning the charts.Workbooks are portable; you can work anywhere. All you need is a computer that can open an MS Excel (version2010 or greater) file and, to update your data, a network connection. And, workbooks are compatible with SharePoint and Sky Drive.lWorkbooks bring together related data on one worksheet so you can easily compare relationships and trends.lWorkbooks have some basic features that any user can customize for their own business preferences.Workbooks require access to the Workbooks Data Cache, a fee based service.Ready to get your workbooks?Autotask Performance Analytics workbooks are available through your Autotask Account Manager.Workbooks are not supported on Macs. The MS Excel version for Macs does not support key Performance Analytics features.Ready to set up your new Workbooks?Go here: "Get Started with Performance Analytics" on page 3 2021 Autotask Corporation l Page 1 of 71
Performance Analytics WorkbooksWelcome!Looking for information about a specific workbook?If you are reading the User Guide for a specific workbook, click the link below to open a page in the Autotask OnlineHelp where you can download a PDF User Guide for any workbook type.Download a Performance Analytics Workbook User GuideNeed help from Customer Support?Find out more here: "Contacting Customer Support" on page 70 2021 Autotask Corporation l Page 2 of 71
Performance Analytics WorkbooksGet Started with Performance AnalyticsGet Started with Performance AnalyticsThis section provides general information on the Performance Analytics Workbook requirements and how to configureyour workbooks. For details on the tabs in a specific workbook, refer to the individual workbook information.If you are reading the Performance Analytics: All Workbooks User Guide, use the links below to go directly to theindividual workbooks.If you are reading the User Guide for a specific workbook, click the link below to open a page in the Autotask OnlineHelp where you can download a PDF User Guide for any workbook type.Download a Performance Analytics Workbook User GuideIf you are using a printed copy of the User Guide, enter this URL into a Web browser's address bar to open the Help .htm.What You GetWhen you sign up for Performance Analytics Workbooks, you will receive:lA Performance Analytics Workbooks file for each workbook you signed up to receivelCredentials to access the Workbooks Data Cache to download and refresh your datalA sample PowerPoint presentation with charts that you can link to your service desk workbookslA User Guide in PDF formatRequirementsTo use Autotask Performance Analytics workbooks, you need the following:lMicrosoft Excel 2010 or later running on a Windows operating systemThe MS Excel version for Macs does not support key features of the Performance Analytics workbooks, forexample, slicer filters.lWorkbooks Data Cache access credentialsDepending on your Autotask package, there may be a monthly fee to access the Workbooks Data Cache.lInternet access when downloading and refreshing data. 2021 Autotask Corporation l Page 3 of 71
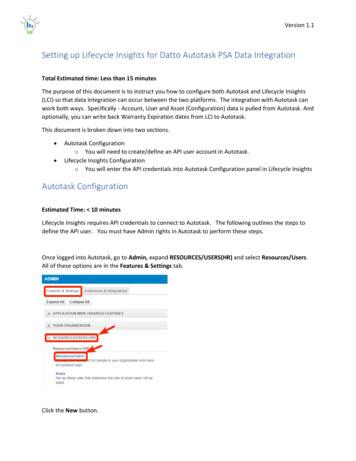
Performance Analytics WorkbooksGet Started with Performance AnalyticsSetting Up Your WorkbookWhen you receive your workbook files and user credentials from Autotask, you must configure each workbook separately.There are currently several different Analytics Workbooks and workbook versions available. Your workbook maynot have all the options described here. If you don't see an item on your Config page, you can move on to the nextitem.To Begin1. Copy all attachments from the email you received from Autotask to your local drive or network.The email includes your credentials to access the Workbooks Data Cache: Database Server, Database Name,User ID, and Password.Be sure to keep a copy of your credentials in a secure location.2. Open a workbook file in Excel.3. Click the Config worksheet tab.Initial Setup and ConfigurationBe sure to have the following Workbooks Data Cache credentials ready: Database Server, Database Name, User ID, andPassword.1. On the Config worksheet, click Setup Workbook.2. Enter the credentials you received from Autotask exactly as provided by Autotask: Database Server, DatabaseName, User ID and Password.Your connection information is case sensitive.Use characters as specified by Provisioning. Do not leave empty spaces before, after, or within the specified characters.If information is entered incorrectly, the setup will fail. 2021 Autotask Corporation l Page 4 of 71
Performance Analytics WorkbooksGet Started with Performance AnalyticsFOR SALES WORKBOOK V 1.2 - You can store your connection credentials in a wbsetup.txt file. Futureworkbook updates will reference this file to load your credentials.Set up the wbsetup.txt file as follows. Be sure to type the credentials exactly as provided by Autotask:On line 1 of the file type your [Database Server]On line 2 type your - [Database Name]On line 3 type your [User ID]Optionally, on line 4 type the [Password]Save the files as wbsetup.txt in the same directory as your Sales Workbook file. The wbsetup.txt file mustreside in the same directory as your workbook.3. Optionally, enter an 'Advanced Where' clause to selectively limit the amount of data that is downloaded. The number and type of advanced where clauses will vary depending on which workbook you are configuring. You can skipthis field now and add an Advanced Where Clause at a later time. Refer to "Add or Update an Advanced WhereClause" on page 64.4. Click Next Step. In the next minute or two (subject to connectivity and quantity of data), your workbook will:Connect to your Workbooks Data Cache, download your site configuration and write it to the workbook.Download the data required for the workbook, for example, ticket data for a weekly or daily service workbook.Recalculate and update all workbook charts.5. When the configuration and download are complete, complete the additional Config tab options described below.Company NameEnter your company's name in the Company Name field. This name will display on the Home page.If you are configuring a Client Workbook, this name will also appear on your report covers.Time Zone (Service Desk, Client, and Projects workbooks only) 2021 Autotask Corporation l Page 5 of 71
Performance Analytics WorkbooksGet Started with Performance AnalyticsAutotask stores all ticket detail dates in UTC. In order to see ticket create and complete dates in your time zone, you mustspecify that zone.lSelect the correct Time Zone and then click Update Timezone. Time zones are sorted by GMT /- order.Autotask Zone, Currency Symbol, and Fiscal Year (Sales workbook v 1.2)Several Sales workbook tabs, for example, Forecast This Month, provide a list of the opportunities included in the tabdata. In the list, you can click the item ID field to open the item's detail record in Autotask. To access the correct records,you must select your Autotask Zone here.Your zone number appears in the base URL of you Autotask application. For example, if you access Autotask athttps://ww3.autotask.net, your Autotask zone is 3.Currency Symbol and Current Fiscal Year (Sales workbook v 1.2 and Financial only)The Service Desk and Client Workbooks fiscal year is based on the calendar year. The Config page does notinclude a Fiscal Year option. If you need to change the fiscal year for a Service Desk or Client workbook, pleasecontact Autotask Customer Support. Refer to "Contacting Customer Support" on page 70.llTo specify the currency symbol that will appear on graphs, metrics and tables, select a currency from the menu.Click Update.To specify the beginning date of your current fiscal year, select the month and year from the menus. Click Update.Advanced Where ClausesWhen you download data from the data cache, that download includes all data specific to your workbook for the currentand previous year. You may not want to work with all of your data. Advance Where clauses let you limit the data by specificparameters. You can specify Advanced Where clauses when you complete your initial setup, or you can add the clausesat any time. Once added, the clauses will filter data when you refresh. For more details on Advanced Where Clauses, referto "Add or Update an Advanced Where Clause" on page 64.Save Your Password (Optional)You can save your Workbooks Data Cache password rather than enter it every time you refresh your data.Your password will be saved without encryption in Excel. If this is a security problem for you, do not use this feature.For each workbook, do the following.1. In your Workbook, click the Excel Data menu option.2. Click Connections. The Workbook Connections window opens.3. In the list of Connections, click the connection indicated below for the workbook you are configuring:For the Service Desk and Client workbooks click "AT Ticket Detail Data".For the Sales workbook click "AT Opportunity Detail Data". 2021 Autotask Corporation l Page 6 of 71
Performance Analytics WorkbooksGet Started with Performance Analytics4. Click Properties.5. In the Connection Properties window, click the Definition tab.6. Click the Save Password check box and then click OK.When you click Save Password, a security message may open. To proceed and save your passwordwithout encryption, click Yes. If you do not want to save your password without encryption, click Cancel. Youcan then enter your password every time you refresh data.7. For Sales Workbooks, only, return to the list of connections and click"AT Opportunity Detail Closed".Repeat steps 4 through 6 for the additional Sales related field.8. For all workbooks, return to the list of connections and click "AT WarehouseUpdate".9. Repeat steps 4 through 6.10. Click Close.11. Save the workbook. 2021 Autotask Corporation l Page 7 of 71
Performance Analytics WorkbooksGet Started with Performance AnalyticsRefresh Data and View Your ChartsOnce you have completed the initial configuration, you can begin to view your data.For details on the individual workbooks, refer to Using the Service Desk Workbooks, Using Client Workbooks, Using SalesWorkbooks , "Using the Financial Workbook" on page 9 or Using the Projects Workbook.Refresh Your DataYou can refresh your data daily. You will need a network connection to refresh.Since the workbooks use only selected data, the data updates quickly.1. Go to the Home tab in your workbook and click Refresh Data.2. If you saved your password, you are done. If not, enter your password.You will be prompted for the password twice. This is normal. Provide the password both times.3. Once the refresh is done, save the file.The refresh will not include any changes that were made to data items in Autotask Admin that are included in the workbook data, for example, queue names or priorities. To fully update your workbook after you make Administrativechanges in Autotask, you must re-configure the workbook from the Config tab. Refer to "Initial Setup and Configuration" on page 4.The Performance Analytics Workbooks are a unique subset of data and are not related to Autotask Report DataWarehouse. Autotask does not support any use of the Workbooks related data tables in a SQL reporting environment .For more information on the workbook data, refer to "About the Workbooks Data Cache" on page 69.There's More!To learn about more options to customize your workbook , refer to "Take Your Workbook to the Next Level" on page 54.Additional HelpIf you need information that you cannot find in the Help, or you have experienced a workbook related technical problem,please contact Autotask Customer Support. Refer to "Contacting Customer Support" on page 70. 2021 Autotask Corporation l Page 8 of 71
Performance Analytics WorkbooksUsing the Financial WorkbookUsing the Financial WorkbookHow much time do you spend monitoring the financial health of your business? More than you want to? Not enough? Ormaybe both?And, are you looking at the right data? Do you know how to find the data you should be monitoring? And what do the numbers really mean?The answers to these questions are as varied as the IT Service Providers that use Autotask to manage their businesses.But, there is one question that has only one right answer. Should you be monitoring your business financial data? Theanswer is always yes, regardless of how well you think your business is doing.But sifting through reports and spreadsheets can be tedious and time consuming. And when you find the data you need,how do you get the most from it?That's why the Autotask Financials workbook takes this:and turns it into dashboards like these: 2021 Autotask Corporation l Page 9 of 71
Performance Analytics WorkbooksUsing the Financial Workbook 2021 Autotask Corporation l Page 10 of 71
Performance Analytics WorkbooksUsing the Financial WorkbookKey metrics are pulled out of your Autotask database and grouped for quick analysis. The data can be updated daily fromyour Autotask database in about a minute.Six workbook tabs display a range of financial data in gauges and charts that provide a quick assessment of, and help togain insight into, revenue trends, costs and margin, and time and resource utilization. You can set plan goals for revenueand for billable resource hours and then compare those goals against actual revenue and hours in the workbook charts.Metrics that MatterThe Metrics worksheet tab includes up to 14 key metrics. Out of the box, you'll see thirteen metrics selected to provide anoverview of your business's financial pulse. Get a quick assessment, by selected month, of overall revenue compared tocost of goods sold and gross margin. See how many clients are generating revenue and how many are costing youmoney, and how much.Refer to "Viewing Key Financial Metrics" on page 14.Worksheet TabsGaugesOn the Gauges tab, when you select a month from the menu or the revenue indicator line, key metrics at the top of thepage immediately update to display your company’s activity for the selected month. Below the general metrics, colorcoded gauges for up to 20 metrics give you a quick visual indicator, by percentage, of how your company performed compared to your business plan. You can select from 26 different metrics to display. For each gauge, you can adjust the 2021 Autotask Corporation l Page 11 of 71
Performance Analytics WorkbooksUsing the Financial Workbookranges to meet your business needs.Refer to "Financial Gauges" on page 16.Financial TrendsSometimes you need to look at the big picture and see how each month fits into the overall trends for the fiscal year. TheFinancial Trends tab provides 22 charts that break out key metrics for year to date. Metrics include trends for revenue, costof goods, and margin. They compare those trends to plan targets, and they break out data by account, revenue type, andcontract type.Refer to "Financial Trending - Year to Date" on page 19.Year Over Year TrendsRegardless of what is happening in the current year, to get the best handle on how your business is doing you shouldknow how the current year compares to the previous year. The charts on the Year Over Year tab take 13 key metric trendsand compare them to the previous year. You can use these charts to see if you're making progress towards your long termgoals, especially if you are trying to move towards higher revenue clients, or a recurring service model. You can also learnif you're addressing issues you've experienced in the past, or developing negative trends that you did not experience in theprevious year.Refer to "Financial Trending: Year Over Year" on page 29.Explore - General Financial DataWhen you see the trends in your business, you get an idea of where things are going well and where you might need tomake some changes. Now you need to find out the details of what is driving the bigger picture. On the Explore tab you canfilter the metrics in the 16 charts to drill down to specifics by quarter, month, contract type, revenue category, billing type,client, and even individual contract.Refer to "Explore General Financial Data" on page 36.UtilizationIn most businesses, the largest percentage of the operating budget comes from labor costs. On the Utilization tab you canexplore details of your labor costs. The 6 charts break out hours worked by metrics like month, type of time, billable type,and resource. You can drill down to details with 6 filters: year, month, individual resource, type of time, and work type.Refer to "Resource Utilization" on page 44.MarginGross margin, that is, revenue minus cost of goods sold, is a critical indicator of business health. The Margin tab scatterchart presents an overall view of the relationship between your business revenue and gross margin percentage, includingwhere your gross margin percentage fell into the negative range. You can filter the chart data by quarter, month, contracttype, contract category, and account.Refer to "Explore Margin" on page 47.Financials Current and Financials Previous 2021 Autotask Corporation l Page 12 of 71
Performance Analytics WorkbooksUsing the Financial WorkbookThese two worksheets store the data from the current and previous years that appear in the workbook charts and tables.Data is presented in a spreadsheet, grouped and sorted to correspond to the visual presentations. These spreadsheetsare formatted so the data is easy to read. Sparklines provide a quick visual key to trends over time.On the Financials Current worksheet, you add the values for your company's Plan targets. You can also manually enterdata for additional revenue sources, costs of goods sold, and operating expenses that are not included in your Autotaskdata.Refer to "Financial Analysis: Current and Previous Fiscal Year" on page 49.Labor Current and Labor PreviousThese two worksheets store the labor data from the current and previous year that appears in the workbook charts andtables. Data is presented as a spreadsheet, grouped and sorted into Labor Summary and Labor Details data. Thesespreadsheets are formatted so the data is easy to read.Labor Summary data includes totals for service versus indirect labor, and labor totals by tasks and tickets. Labor Detailspresent data for individual resources including metrics like service and indirect hours, service hours as the percent of total,and burden rate per hour. Sparklines provide a quick visual key to trends over time. This worksheet is also where youenter your Plan target resource hours by month.Refer to "Labor Summary and Details: Current and Previous Years" on page 52. 2021 Autotask Corporation l Page 13 of 71
Performance Analytics WorkbooksUsing the Financial WorkbookViewing Key Financial MetricsThe Metrics worksheet tab displays data in a table format that includes indicator icons and sparklines to provide a quickassessment of your financial metrics that matter.lSelect a month from the menu in the upper right corner to immediately view data for the selected month.When you receive the workbook, the table displays the following 13 preselected metrics:MetricDescriptionMetrics reflect the month specified in the Select Month field.RevenueTotal revenueRecurring Service RevenueRevenue from recurring services% Recurring Ser- The percent of total revenue generated by recurring servicesvice RevenueCost of GoodsSoldTotal cost of goods soldGross MarginTotal revenue minus the total cost of goods soldGross MarginpercentageTotal gross margin divided by total revenueOperatingExpensesTotal operating expense from indirect labor and Other operating expenses. In the Labor Current worksheet, you can manually enter Other Operating Expenses that are not stored in the Autotask database.EBITDAEarnings Before Interest, Taxes, Depreciation, and AmortizationAverage Revenue per ClientTotal Revenue divided by number of clients invoiced 2021 Autotask Corporation l Page 14 of 71
Performance Analytics WorkbooksUsing the Financial WorkbookMetricDescriptionAccounts withover 10,000*Number of accounts that generated over 10,000 in revenueRevenue fromOver 10,000*Total amount of revenue coming from accounts that generated over 10,000% of Revenuefrom Over10,000*Percent of total revenue that comes from accounts that generated over 10,000Accounts marginLost MoneyNumber of accounts that lost money based on Gross Margin* You can adjust this amount to suit your company's revenue. Refer to "Customizing Your Data Display" on page 57.Metrics reflect the month specified in the Select Month field. Year to date metrics reflect all revenue from the beginning of the current Fiscal Year through the specified month.The table below describes the data displayed for each metric.Display FeatureDescriptionSelect MonthThis menu appears above the Metrics table to the right. Select amonth to display the metrics for that month.Actual totals versus TargetThe total amount for the for the selected month and the targetvalue set for the metricYear To Date Actual totalsversus TargetThe year to date total, through the selected month, for the specified metric and the target year to date value (sum of year todate target values for current and preceding monthsRed dot indicatorFlags metrics that do not meet the specified targetChange between the current and previous month,with green or red arrowsThe current month total minus the previous month's total. Greenand red arrows indicate whether the change is downward orupward.The value of the difference between the two months appears tothe right of the arrows.Sparkline graphsTwo small graphs display data for all months. One shows trendsfrom month to month and the other shows which months met theplanned target. 2021 Autotask Corporation l Page 15 of 71
Performance Analytics WorkbooksUsing the Financial WorkbookFinancial GaugesOn this worksheet, color coded gauges give you a quick visual indicator, by percentage, of how your company performedcompared to your business plan. You can display up to twenty of the twenty six available metrics, and easily change yourselection at any time.Key MetricsThree key metrics: Revenue, Cost of Goods, and Gross Margin (revenue minus cost of goods) are displayed at the top ofthe Gauges worksheet. These metrics are drawn from the month indicated above the metrics. When you change themonth, the key metrics and gauges update immediately.Change the Display MonthThere are two methods to change which month's data appears on this worksheet.lSelect a month from the Select Month menu in the upper right corner of the worksheet.lMove the green dot on the Revenue line below the Select Month field.To move the green dot to a new location, click and drag the scroll bar beneath the revenue line, or click the directional arrows at either end of the scroll bar. When you move the dot, the month in the Select Month field updatesautomatically.Viewing the Gauges 2021 Autotask Corporation l Page 16 of 71
Performance Analytics WorkbooksUsing the Financial WorkbookEach gauge represents a different metric and has three, color coded segments. Each segment represents a different percentage range. The color of the segment represents the status of that range.For metrics where you want to exceed your Plan target, the highest range is the most desirable and it is green.lRed (low end) - the plan was not met and the total is cause for concern.lYellow (in between) - the total did not meet the plan, but came within an acceptable rangelGreen (high end) - the total met or exceeded the planFor some metrics, for example, Cost of Goods Sold, your goal will be to keep your total at or below plan. In that case thehighest range is the least desirable range and appears as red.lGreen (low end) - the total was well below the plan targetlYellow (in between) - costs did not exceed the plan, but came very close or met planlRed (high end) - total costs exceeded the plan targetAdjusting the Gauge SettingsYou can change which of the 26 available metrics displays in any gauge.lSelect a new metric from the menu below the gauge.If you do not use a particular metric, or do not have data to drive the metric, select "Unselected". This willzero out the gauge.To meet your business preferences, you can also modify the range for the gauge segments, for example, you may want toset your yellow range at 90 to 100% instead of the default 75 to 100%. You can also set the maximum percentage to be displayed on the gauge. 2021 Autotask Corporation l Page 17 of 71
Performance Analytics WorkbooksUsing the Financial Workbook1. Below the gauge, locate the Low setting for the Red, Yellow, or Green range, or the Chart High setting.2. Double click in the cell with the current % value and change the value, orClick in the cell and edit the value in the Formula Bar.3. Click Enter. Save the worksheet. 2021 Autotask Corporation l Page 18 of 71
Performance Analytics WorkbooksUsing the Financial WorkbookFinancial Trending - Year to DateIn addition to looking at your metrics on a month to month basis, you will want to see how each month fits into the overalltrends for the fiscal year. The Financial Trends tab provides twenty-two charts that break out key metrics for year to date.Charts are grouped by Revenue Trends, Cost of Goods Sold, and Gross Margin. In each section, the basic metric trendsare presented year to date, by month. Some charts compare the actual data to Plan targets. Other charts present theactual data by account, revenue type, or contract type.Key MetricsFive key metrics, calculated year to date, are displayed across the top of the worksheet: Revenue, COGS (Cost of GoodsSold), Gross Margin, Op Expenses (Operating Expenses), EBITA (Earnings before interest, taxes, and amortization)Revenue TrendsThese nine charts look at revenue totals to show how your revenue compares to your business plan, and how it is distributed between clients and contract types.Revenue versus PlanY Axis Revenue (1000s)X Axis MonthsColumns Actual monthly revenueRed line Monthly revenue Plan targetsView posted revenue for each month compared to monthly revenue Plan targets.Has your revenue trended mostly close to, or above plan values so far this year? Did you see growth in revenue overall? 2021 Autotask Corporation l Page 19 of 71
Performance Analytics WorkbooksUsing the Financial WorkbookCumulative Revenue versus PlanY Axis Revenue (1000s)X Axis MonthsColumns Cumulative monthly revenueRed line Cumulative monthly revenue PlanView posted revenue for each month, cumulative from monthto month, compared to cumulative values of monthly revenuePlan targets.Some months will have revenue perform very well against plan while other months might fall short. What is often mostimportant is the cumulative performance year to date.YTD Revenue by Contract TypeEach color coded segment represents the percentage of totalrevenue generated by the corresponding contract type.See the legend on your chart to determine the color to contracttype association.The actual percentage value for a segment appears in whitetext in that segment.Hover over a segment in the worksheet to display details.Compare the amount of revenue generated by different contract types.All revenue is not created equal. The revenue by contract type tells you what types of contracts are generating the mostrevenue. 2021 Autotask Corporation l Page 20 of 71
Performance Analytics WorkbooksUsing the Financial WorkbookRevenue by Contract TypeY Axis RevenueX Axis MonthsLines Each color coded line represents a contract type. Seethe legend on your chart to determine the color to contracttype association.View revenue by contract type on a month to month basis andas a year to date trend.Compare revenue generated from different contract types.How is the revenue from each
Autotask Zone, Currency Symbol, and Fiscal Year (Sales workbook v 1.2) Several Sales workbook tabs, for example, Forecast This Month, provide a list of the opportunities included in the tab data. In the list, you can click the item ID field to open the item's detail record in Autotask. To access the correct records,