Transcription
Performance Analytics:Service WorkbooksLast updated: 5/12/2021 2021 Autotask Corporation
Performance Analytics WorkbooksTable of ContentsTable of ContentsTable of Contents1Welcome!1Get Started with Performance Analytics3Setting Up Your Workbook4Refresh Data and View Your Charts8Using the Service Desk Workbooks9Viewing Key Service Metrics13Dashboard: 10 Week or 10 Day View14Dashboard: 10 Week or 10 Day View (SLA and Survey)22Service Desk Timeline View28Explore Your Data31Dashboard: Rolling Four Week Comparison35Ticket Backlog Dashboard37Data Analysis and Tickets Detail Tabs44Take Your Workbook to the Next Level46Add Linked Charts to PowerPoint Presentations47Customizing Your Data Display49Add or Update an Advanced Where Clause56Frequently Asked Questions - FAQs58About the Workbooks Data Cache61Contacting Customer Support62 2021 Autotask Corporation l Page 1 of 1
Performance Analytics WorkbooksWelcome!Welcome!Whether you are already using business metrics to help manage your business, or you are just beginning to realize thebenefits of analyzing your business data, Autotask Performance Analytics (formerly Performance Dashboards) will makethis task easier.What is a Performance Analytics Workbook?Every customer or potential customer, every ticket and project task, every sales opportunity and quote is stored in yourAutotask database. Your database tells the story of your business. And as more business owners are realizing, this storycan provide useful insights into how to make your business better.Autotask Workbooks pull out the information you need, and presents it in an easy and accessible format.lllllEach workbook brings together core metrics for one area of your business workflow to analyze your business'strends, successes, and challenge points.Workbooks present data visually so you can compare and analyze at a glance.Workbooks are easy to set up; simply open the workbook, enter the credentials provided by Autotask, and you'reready to go.Workbooks are even easier to use. Click one button to refresh data directly from pre-selected Autotask Performance Dashboards Data Cache and then start scanning the charts.Workbooks are portable; you can work anywhere. All you need is a computer that can open an MS Excel (version2010 or greater) file and, to update your data, a network connection. And, workbooks are compatible with SharePoint and Sky Drive.lWorkbooks bring together related data on one worksheet so you can easily compare relationships and trends.lWorkbooks have some basic features that any user can customize for their own business preferences.Workbooks require access to the Workbooks Data Cache, a fee based service.Ready to get your workbooks?Autotask Performance Analytics workbooks are available through your Autotask Account Manager.Workbooks are not supported on Macs. The MS Excel version for Macs does not support key Performance Analytics features.Ready to set up your new Workbooks?Go here: "Get Started with Performance Analytics" on page 3 2021 Autotask Corporation l Page 1 of 63
Performance Analytics WorkbooksWelcome!Looking for information about a specific workbook?If you are reading the User Guide for a specific workbook, click the link below to open a page in the Autotask OnlineHelp where you can download a PDF User Guide for any workbook type.Download a Performance Analytics Workbook User GuideNeed help from Customer Support?Find out more here: "Contacting Customer Support" on page 62 2021 Autotask Corporation l Page 2 of 63
Performance Analytics WorkbooksGet Started with Performance AnalyticsGet Started with Performance AnalyticsThis section provides general information on the Performance Analytics Workbook requirements and how to configureyour workbooks. For details on the tabs in a specific workbook, refer to the individual workbook information.If you are reading the Performance Analytics: All Workbooks User Guide, use the links below to go directly to theindividual workbooks.If you are reading the User Guide for a specific workbook, click the link below to open a page in the Autotask OnlineHelp where you can download a PDF User Guide for any workbook type.Download a Performance Analytics Workbook User GuideIf you are using a printed copy of the User Guide, enter this URL into a Web browser's address bar to open the Help .htm.What You GetWhen you sign up for Performance Analytics Workbooks, you will receive:lA Performance Analytics Workbooks file for each workbook you signed up to receivelCredentials to access the Workbooks Data Cache to download and refresh your datalA sample PowerPoint presentation with charts that you can link to your service desk workbookslA User Guide in PDF formatRequirementsTo use Autotask Performance Analytics workbooks, you need the following:lMicrosoft Excel 2010 or later running on a Windows operating systemThe MS Excel version for Macs does not support key features of the Performance Analytics workbooks, forexample, slicer filters.lWorkbooks Data Cache access credentialsDepending on your Autotask package, there may be a monthly fee to access the Workbooks Data Cache.lInternet access when downloading and refreshing data. 2021 Autotask Corporation l Page 3 of 63
Performance Analytics WorkbooksGet Started with Performance AnalyticsSetting Up Your WorkbookWhen you receive your workbook files and user credentials from Autotask, you must configure each workbook separately.There are currently several different Analytics Workbooks and workbook versions available. Your workbook maynot have all the options described here. If you don't see an item on your Config page, you can move on to the nextitem.To Begin1. Copy all attachments from the email you received from Autotask to your local drive or network.The email includes your credentials to access the Workbooks Data Cache: Database Server, Database Name,User ID, and Password.Be sure to keep a copy of your credentials in a secure location.2. Open a workbook file in Excel.3. Click the Config worksheet tab.Initial Setup and ConfigurationBe sure to have the following Workbooks Data Cache credentials ready: Database Server, Database Name, User ID, andPassword.1. On the Config worksheet, click Setup Workbook.2. Enter the credentials you received from Autotask exactly as provided by Autotask: Database Server, DatabaseName, User ID and Password.Your connection information is case sensitive.Use characters as specified by Provisioning. Do not leave empty spaces before, after, or within the specified characters.If information is entered incorrectly, the setup will fail. 2021 Autotask Corporation l Page 4 of 63
Performance Analytics WorkbooksGet Started with Performance AnalyticsFOR SALES WORKBOOK V 1.2 - You can store your connection credentials in a wbsetup.txt file. Futureworkbook updates will reference this file to load your credentials.Set up the wbsetup.txt file as follows. Be sure to type the credentials exactly as provided by Autotask:On line 1 of the file type your [Database Server]On line 2 type your - [Database Name]On line 3 type your [User ID]Optionally, on line 4 type the [Password]Save the files as wbsetup.txt in the same directory as your Sales Workbook file. The wbsetup.txt file mustreside in the same directory as your workbook.3. Optionally, enter an 'Advanced Where' clause to selectively limit the amount of data that is downloaded. The number and type of advanced where clauses will vary depending on which workbook you are configuring. You can skipthis field now and add an Advanced Where Clause at a later time. Refer to "Add or Update an Advanced WhereClause" on page 56.4. Click Next Step. In the next minute or two (subject to connectivity and quantity of data), your workbook will:Connect to your Workbooks Data Cache, download your site configuration and write it to the workbook.Download the data required for the workbook, for example, ticket data for a weekly or daily service workbook.Recalculate and update all workbook charts.5. When the configuration and download are complete, complete the additional Config tab options described below.Company NameEnter your company's name in the Company Name field. This name will display on the Home page.If you are configuring a Client Workbook, this name will also appear on your report covers.Time Zone (Service Desk, Client, and Projects workbooks only) 2021 Autotask Corporation l Page 5 of 63
Performance Analytics WorkbooksGet Started with Performance AnalyticsAutotask stores all ticket detail dates in UTC. In order to see ticket create and complete dates in your time zone, you mustspecify that zone.lSelect the correct Time Zone and then click Update Timezone. Time zones are sorted by GMT /- order.Autotask Zone, Currency Symbol, and Fiscal Year (Sales workbook v 1.2)Several Sales workbook tabs, for example, Forecast This Month, provide a list of the opportunities included in the tabdata. In the list, you can click the item ID field to open the item's detail record in Autotask. To access the correct records,you must select your Autotask Zone here.Your zone number appears in the base URL of you Autotask application. For example, if you access Autotask athttps://ww3.autotask.net, your Autotask zone is 3.Currency Symbol and Current Fiscal Year (Sales workbook v 1.2 and Financial only)The Service Desk and Client Workbooks fiscal year is based on the calendar year. The Config page does notinclude a Fiscal Year option. If you need to change the fiscal year for a Service Desk or Client workbook, pleasecontact Autotask Customer Support. Refer to "Contacting Customer Support" on page 62.llTo specify the currency symbol that will appear on graphs, metrics and tables, select a currency from the menu.Click Update.To specify the beginning date of your current fiscal year, select the month and year from the menus. Click Update.Advanced Where ClausesWhen you download data from the data cache, that download includes all data specific to your workbook for the currentand previous year. You may not want to work with all of your data. Advance Where clauses let you limit the data by specificparameters. You can specify Advanced Where clauses when you complete your initial setup, or you can add the clausesat any time. Once added, the clauses will filter data when you refresh. For more details on Advanced Where Clauses, referto "Add or Update an Advanced Where Clause" on page 56.Save Your Password (Optional)You can save your Workbooks Data Cache password rather than enter it every time you refresh your data.Your password will be saved without encryption in Excel. If this is a security problem for you, do not use this feature.For each workbook, do the following.1. In your Workbook, click the Excel Data menu option.2. Click Connections. The Workbook Connections window opens.3. In the list of Connections, click the connection indicated below for the workbook you are configuring:For the Service Desk and Client workbooks click "AT Ticket Detail Data".For the Sales workbook click "AT Opportunity Detail Data". 2021 Autotask Corporation l Page 6 of 63
Performance Analytics WorkbooksGet Started with Performance Analytics4. Click Properties.5. In the Connection Properties window, click the Definition tab.6. Click the Save Password check box and then click OK.When you click Save Password, a security message may open. To proceed and save your passwordwithout encryption, click Yes. If you do not want to save your password without encryption, click Cancel. Youcan then enter your password every time you refresh data.7. For Sales Workbooks, only, return to the list of connections and click"AT Opportunity Detail Closed".Repeat steps 4 through 6 for the additional Sales related field.8. For all workbooks, return to the list of connections and click "AT WarehouseUpdate".9. Repeat steps 4 through 6.10. Click Close.11. Save the workbook. 2021 Autotask Corporation l Page 7 of 63
Performance Analytics WorkbooksGet Started with Performance AnalyticsRefresh Data and View Your ChartsOnce you have completed the initial configuration, you can begin to view your data.For details on the individual workbooks, refer to "Using the Service Desk Workbooks" on page 9, Using Client Workbooks,Using Sales Workbooks , Using the Financial Workbook or Using the Projects Workbook.Refresh Your DataYou can refresh your data daily. You will need a network connection to refresh.Since the workbooks use only selected data, the data updates quickly.1. Go to the Home tab in your workbook and click Refresh Data.2. If you saved your password, you are done. If not, enter your password.You will be prompted for the password twice. This is normal. Provide the password both times.3. Once the refresh is done, save the file.The refresh will not include any changes that were made to data items in Autotask Admin that are included in the workbook data, for example, queue names or priorities. To fully update your workbook after you make Administrativechanges in Autotask, you must re-configure the workbook from the Config tab. Refer to "Initial Setup and Configuration" on page 4.The Performance Analytics Workbooks are a unique subset of data and are not related to Autotask Report DataWarehouse. Autotask does not support any use of the Workbooks related data tables in a SQL reporting environment .For more information on the workbook data, refer to "About the Workbooks Data Cache" on page 61.There's More!To learn about more options to customize your workbook , refer to "Take Your Workbook to the Next Level" on page 46.Additional HelpIf you need information that you cannot find in the Help, or you have experienced a workbook related technical problem,please contact Autotask Customer Support. Refer to "Contacting Customer Support" on page 62. 2021 Autotask Corporation l Page 8 of 63
Performance Analytics WorkbooksUsing the Service Desk WorkbooksUsing the Service Desk WorkbooksThere are two Service Desk Workbooks to help you analyze the trends in the Service workflow of your business. Eachpresents key data about your tickets from start to finish so you can determine what is working and where there are potential problems.Weekly Analysis provides a long term view of your workflow. If you're responsible for overall management of thebusiness, you can look at trends over time. Is your backlog growing or shrinking? Are there certain days or timesthat you're not meeting your SLA first response? What are your customers saying about your service (Surveyresponses)? If you can answer these types of questions, you can adjust resource management, billing rates, andprocedures to optimize your process.Daily Analysis presents your day to day workflow. If you manage the daily operations of your company's servicebusiness, you can get the information you need to manage the workload proactively. What issues need your immediate attention and where do you need the most resources? Are there any unexpected increases in new tickets,high priority tickets, or ticket backlog and what is the cause? This information can help you spot and manage potential problems before they develop.Both workbooks include basic Metrics, Dashboard, and Timeline views that present the same data, but the timeframe forthat data is by week or by the day, depending on the workbook. Each workbook also includes several worksheets thatfocus on short term data or long term trends. 2021 Autotask Corporation l Page 9 of 63
Performance Analytics WorkbooksUsing the Service Desk WorkbooksMetrics that MatterThe Metrics worksheet tab includes 10 key metrics that were selected to provide an overview of how your Service workflow is performing.You can set a target for each metric for the designated time frame. Sparkline graphs and charts provide a quick assessment of the overall trend for each metric, and when it is meeting its target.Refer to "Viewing Key Service Metrics" on page 13.Dashboard and Timeline ViewsThese worksheets present data for all tickets in the specified time period.On each analytics worksheet, you can scan critical high level data at the top of the page. Weekly workbooks display datafor the previous 10 weeks. Daily workbooks display data for the previous 10 days.Both workbooks display the following data:lThe overall count of Backlogged, New, and Closed ticketslThe total difference between New and Completed tickets (Change)lThe percent of tickets that met their SLA first response and resolution targetslYour overall customer survey ratingBelow these metrics on the analytics worksheet, related data is presented in a collection of easy to follow charts. 2021 Autotask Corporation l Page 10 of 63
Performance Analytics WorkbooksUsing the Service Desk WorkbooksDashboard: 10 Week or 10 Day ViewThis dashboard presentation looks at multiple views of the following data: Opening Backlog, Completed Tickets, New Tickets, and Tickets by Group.For details, refer to "Dashboard: 10 Week or 10 Day View" on page 14.Dashboard: 10 Week or 10 Day SLAThis dashboard presentation looks at multiple views of Service Level Agreement (SLA) or Survey data.For details, refer to "Dashboard: 10 Week or 10 Day View" on page 14.Dashboard: 2 Month View (Weekly Analysis only)This dashboard presentation compares the most recent four week activity to the previous four weeks, for six key indicators: Backlog, New Tickets by Priority, New Tickets by day of week, Hours Worked on completed tickets, Service LevelAgreements first response met, and Service Level Agreements resolution met.For details, refer to "Dashboard: Rolling Four Week Comparison" on page 35.Dashboard: Backlog (Daily Analysis only)This dashboard presentation provides an immediate assessment of current ticket backlog. Four charts present backlogdata by age and activity. Nine additional charts break down backlog by specific characteristics including priority, issuetype, sub-issue type, queues, top 5 clients, top 5 resources, group and first response met.For details, refer to "Ticket Backlog Dashboard" on page 37.Weekly or Daily TimelineThis interactive dashboard presentation lets you view trends at weekly intervals over a 10 week (Weekly Analysis) periodor over a 10 day period (Daily Analysis). Slide the Ticket Balance scroll bar to view multiple data comparisons in theseareas: Opening Backlog, New Tickets, Completed Tickets, Service Level Agreements (SLA) and Survey Results.For details, refer to "Service Desk Timeline View" on page 28.ExploreThis powerful and flexible interactive dashboard lets you filter all data on the worksheet by multiple criteria, for example, byticket Status, and/or Priority. Learn details like which issue types generate the most critical tickets or which resources areassigned to the most tickets in your backlog. The Ticket Count in the header reflects how many tickets meet the selectedcriteria.The individual charts on this page fall into three groups: Trending and Activity, Top 5 Lists, and Service Level Agreementand Survey. Below the charts, you can view a list of all the tickets that fall under the selected criteria.For details, refer to "Explore Your Data" on page 31. 2021 Autotask Corporation l Page 11 of 63
Performance Analytics WorkbooksUsing the Service Desk WorkbooksData Analysis TabsThese worksheets allow you to view, compare, and quickly access the data visually represented in the Dashboards andTimeline Views. Data is grouped and sorted to correspond to the visual presentations. You can also view a list of all ticketsincluded in the data analyzed for this workbook.Ticket AnalysisThis tab contains, in table format, all the ticket data that drives the service desk charts. Data is grouped by Opening Balances, Tickets Opened, Tickets Closed, and Service Level performance. It is then sorted within groups by the criteriapresented in the graphs and charts, for example, By Priority or By Hours Worked. Each group is sub-totaled. Refer to"Data Analysis and Tickets Detail Tabs" on page 44.Backlog Analysis (Daily Analysis only)This tab contains backlog data by resource, in table format and grouped by Opening Balances, Tickets Opened, TicketsClosed, and Service Level performance. Data is sorted within groups by the ticket characteristics and other attributes thatappear in the charts on the Backlog tab, for example, Priority or Hours Worked. Each group is sub-totaled. Refer to "TicketBacklog Dashboard" on page 37.Ticket DetailThe ticket detail lists all tickets included in the data analyzed for this workbook, that is tickets created during the specifiedtime period, closed during the specified time periods, and all backlogged tickets. Refer to "Data Analysis and TicketsDetail Tabs" on page 44. 2021 Autotask Corporation l Page 12 of 63
Performance Analytics WorkbooksUsing the Service Desk WorkbooksViewing Key Service MetricsThe Metrics worksheet tab includes 10 key metrics that were selected to provide an overview of how your Service workflow is performing.You can set a target for each metric for the designated time frame.You can instantly see the following:lValues for the selected metrics for the previous three weeks (Weekly Analysis) or the previous three days (DailyAnalysis).lWhether or not a metric has met its target for each time frame. A red icon indicates a missed target.lA sparkline graph that shows the overall trend for the previous 10 weeks or 10 days.llA sparkline bar chart that shows where the target was met or missed for the previous 10 weeks or 10 days. Greenindicates the target was met, red indicates a missed target.The target specified for each metric.The total ticket count for 7 of these metrics appears at the top of each dashboard and the timeline views.For information on setting targets, changing labels, and changing which data displays, refer to "Customizing Your DataDisplay" on page 49. 2021 Autotask Corporation l Page 13 of 63
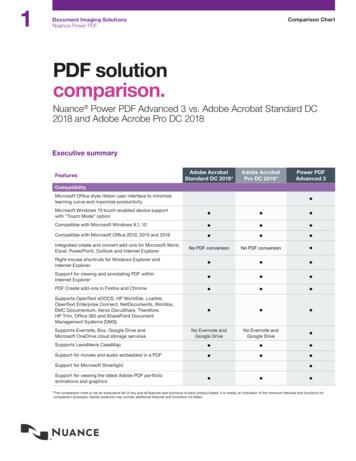
Performance Analytics WorkbooksUsing the Service Desk WorkbooksDashboard: 10 Week or 10 Day ViewIn each workbook, 10 Day or 10 Week, this worksheet displays up to 10 charts grouped into four types of ticket relateddata. Above each group you can click a hyperlink to quickly jump to another group.In your workbook, hover over any point in a chart to see details for that point.About the Graphs in this TopicThe graphs included in this topic were taken from the 10 Week workbook, with the exception of the New Tickets per Hourchart. The 10 Day workbook includes most of the same charts except instead of showing data by week, the data is presented by day. The charts display and compare the same type of data in a different time frame.In the examples below, when the table description indicates that the x or y axis weeks, for the Daily Workbookthe x or y axis days.Opening BacklogIt's important to monitor trends in your ticket backlog, both on a day to day and long term basis. Is it moving up, down, orstaying steady over time?When you look at the Daily analysis, you can spot a trend as it starts to build, or see a spike over a short time. You can drilldown to determine if it's just a chance occurrence or if you need to make some changes.When you look at the weekly analysis, you can see trends over an extended time. Improvements can validate what youhave been doing, and poor results can point out problems that were not spotted or addressed on the daily level.New, Completed, and Opening BacklogY Axis Number of ticketsX Axis WeeksSecondary value axis Number in BacklogBlue New Tickets, Red Completed Tickets, Green BacklogCompare the number of new tickets (blue, left column) to thenumber of completed tickets (red, right column).The green line follows the opening backlog count for tickets byweek during the same time period.Insight: How are your backlog of new and completed tickets trending? The opening backlog is an indication of your team'sability to keep up with new tickets. When the backlog is accelerating, you might want to see if it’s due to more new ticketsor decreased ticket completion. 2021 Autotask Corporation l Page 14 of 63
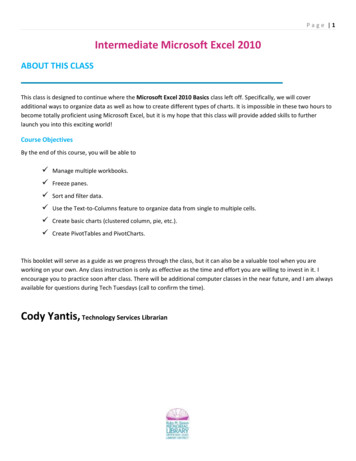
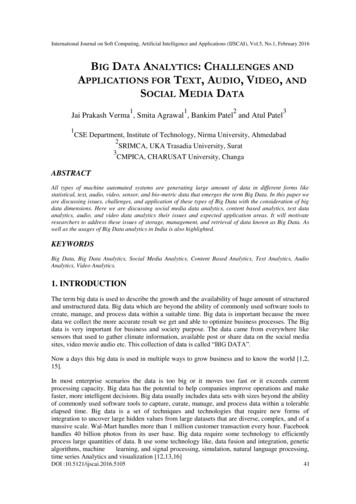
Performance Analytics WorkbooksUsing the Service Desk WorkbooksAge of Opening BacklogY Axis Number of ticketsX Axis WeeksBlue 0 - 14 Days, Red 7 - 14 Days, Green 14 - 30 Days,Purple Over 30 DaysView the number of tickets in backlog (y axis) by week (x axis)and by how long they have been open. Each colored line represents a number range for days that tickets have been open.Insight: How is your backlog aging? This chart shows the backlog over 30 days has grown from 65 tickets to over 100.This aging of backlog is a predictor of future SLA resolution and survey issues. The upward trend in tickets over 30 dayswould be apparent even at the Daily level.Distribution of Priorities in Opening BacklogInsight: Are you addressing the highest priority concerns of your clients? This chart indicates how the distribution of youropening backlog by priority is trending. You can see here that the number of medium priority tickets is growing but the number of high priority tickets has remained constant.Y Axis Number of ticketsX Axis WeeksBlue Critical, Red High, Green Medium, Purple LowView the number of tickets (y axis) in backlog by week (x axis)and priority.Each column is divided by color; each color represents a ticketPriority. The order of priority from the x axis is from highest tolowest. In this chart, High (red) appears at the bottom becausethere are no Critical (blue) tickets. 2021 Autotask Corporation l Page 15 of 63
Performance Analytics WorkbooksUsing the Service Desk WorkbooksChanges in Opening BacklogY Axis Number of ticketsX Axis WeeksBlue Total ticketsView the number of tickets added or removed from the backlogby week. The x axis displays weeks. The y axis displays the number of tickets added to backlog (more tickets completed thanadded) above the y axis, and the decrease in number of ticketsin backlog (more tickets completed than added) below the yaxis.Insight: How has the backlog changed from week to week? This chart provides an easy to view indication of the weekswhen the team completed more tickets than they created. In this chart, we started out strong but in the recent weeks havenot been able to keep up.New Tickets per Hour (Daily Analysis Only)Y Axis Number of ticketsX Axis Date/TimeBlue Number of New TicketsView the number of tickets created(y axis) by date and time (x axis).Insight: This chart is targeted to day to day service management. At what time of day do you experience the highestvolume for ticket creation? Does it vary by day? Is there a pattern that you can follow so you can assign your resourcesaccordingly?Completed TicketsCompare week by week or day by day how many tickets were completed over the last 10 weeks or 10 days. You can alsocompare the time it took to complete them. 2021 Autotask Corporation l Page 16 of 63
Performance Analytics WorkbooksUsing the Service Desk WorkbooksCompleted Tickets - Distribution of Total Hours WorkedY Axis Number of ticketsX Axis WeeksBlue Under 15 minutes, Red 15 - 30 minutes, Green 30minutes - 1 hour,Purple 1 to 16 hours, Turquoise Over 16 hours.View the number of tickets (y axis) completed by week (x axis)for the previous 10 weeks. Each column displays, by color, therange required to complete the tickets. Time increases from thex axis, with blue (under 15 minutes), at the bottom of thecolumn. This chart does not include any light blue (over 16hours).Insight: How many tickets are closed at each time category? This chart shows the total number of closed tickets groupedby the amount of time it took to close them. A spike in the number of hours it takes to complete tickets over a couple ofdays might mean fewer available resources or a cluster of difficult tickets. But a spike over a longer period may also be anindication of a larger problem to address, or that you won’t be able to keep up with ticket volumes.Completed Tickets - Total Hours WorkedY Axis Number of ticketsX Axis WeeksBlue Total hoursView how many total hours your team logged on tickets thatwere completed during a given week.Insight: How many hours were logged on this week’s completed tickets? This chart shows the total hours spent on ticketsto close them, including time spent in previous weeks (or days). A drop in the total hours for a week is an indicator of eitherless work being done or if the volume of tickets is the same and issue types are the same, it means increased productivityfrom the team that can accommodate higher volume of tickets.New TicketsSee how many new tickets are added each week and on which days. Compare new tickets by priority. 2021 Autotask Corporation l Page 17 of 63
Performance Analytics WorkbooksUsing the Service Desk WorkbooksNew Tickets - Distribution by Day of Week (Weekly only)Y Axis Number of ticketsX Axis WeeksBlue Monday, Red Tuesday, Green Wednesday, Purple Thursday,Turquoise FridayView how many tickets (y axis) were created by week (x axis)and then by day in that week. Columns display days of theweek by color with Monday (blue) at the bottom followed byTuesday, Wednesday, Thursday, and Friday.Insight: Do you consistently get the same number of tickets per day? This chart shows you the number of tickets comingin for each day. Based on the distributions in the chart, you can plan to have the staffing necessary.Total New Tickets by Day of Week (Weekly only)Y Axis Number of ticketsX Axis Days of the weekBlue Total hoursView how many tickets were added for each day of the weekover the previous 10 weeks.Insight: What’s been the busiest weekday for new ticket volume of the past 10 weeks? In this chart, you can see Friday’sticket volume is lowest so it’s the best time for your weekly staff meeting or for staff vacation. 2021 Autotask Corporation l Page 18 of 63
Performance Analytics WorkbooksUsing
Autotask Zone, Currency Symbol, and Fiscal Year (Sales workbook v 1.2) Several Sales workbook tabs, for example, Forecast This Month, provide a list of the opportunities included in the tab data. In the list, you can click the item ID field to open the item's detail record in Autotask. To access the correct records,