Transcription
A Forrester Total EconomicProject Director:Impact StudyDean DavisonCommissioned ByAutotaskThe Total EconomicImpact Of Autotask’sUnified IT BusinessManagement PlatformSeptember 2016
Table Of ContentsExecutive Summary . 3Disclosures . 4TEI Framework And Methodology . 5Analysis . 6Financial Summary . 15Study Conclusions . 16Autotask: Overview . 17Appendix A: Glossary . 18Appendix B: Total Economic Impact Overview . 19ABOUT FORRESTER CONSULTINGForrester Consulting provides independent and objective research-basedconsulting to help leaders succeed in their organizations. Ranging in scope from ashort strategy session to custom projects, Forrester’s Consulting services connectyou directly with research analysts who apply expert insight to your specificbusiness challenges. For more information, visit forrester.com/consulting. 2016, Forrester Research, Inc. All rights reserved. Unauthorized reproduction is strictly prohibited.Information is based on best available resources. Opinions reflect judgment at the time and are subject tochange. Forrester , Technographics , Forrester Wave, RoleView, TechRadar, and Total Economic Impactare trademarks of Forrester Research, Inc. All other trademarks are the property of their respectivecompanies. For additional information, go to www.forrester.com.
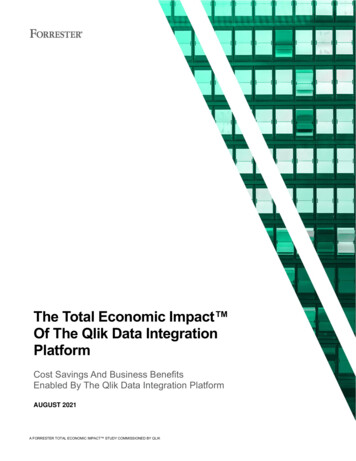
3Executive SummaryAutotask provides a technology platform that combinesProfessional Services Automation (PSA) and AutotaskEndpoint Management (AEM). The unified solutionstreamlines the delivery of IT services, ticketing, and billingwith contract terms and service-level agreements (SLAs).Autotask commissioned Forrester Consulting to conduct aTotal Economic Impact (TEI) study and examine thepotential return on investment (ROI) that IT service providersmay realize by using PSA and AEM together. This studydescribes how using Autotask had an impact on twocustomers and provides a framework of costs and benefits forreaders to evaluate the potential financial impact of Autotaskon their organizations.Autotask provides a unified technology platformfor professional services automation andendpoint management.The benefits and costs for the organizations thatForrester interviewed are: Improved productivity: 378,000. Reduced customer turnover: 513,000. Cost of Autotask license: 226,195. Cost of configuration: 42,000.To better understand the benefits, costs, and risks associated Cost of employee training: 16,962.with Autotask, Forrester interviewed two existing customerswith years of experience using Autotask. The organizationsare both using Autotask’s PSA that is unified with AEM at thedevice, data, invoice, and reporting level. The combination allows service desk, operations, dispatch, and field technicians tounderstand contracted SLAs and quickly prioritize customer requests to optimize delivery.Prior to using AEM, the organizations used Autotask’s PSA and resource management tools that were integrated in thetraditional manner with Remote Monitoring and Management (RMM). However, these tools were still disconnected in manyways, requiring significant amounts of data to be processed and filtered manually. Previous to using AEM, when technicianshad to make service calls, they had to take the time to look up the contract to determine the exact SLAs before knowing howto prioritize service calls.After using AEM, the information was accessible in the PSA system in tickets and reports. This reduced the need to accessboth systems, and many redundant processes were automated completely. The director at one of the firms said: “Autotaskgives us greater visibility of all our data and our customer issues across the board. Everybody is using the same dashboardand working to the same information. On average, these tools improved the productivity of our billable personnel by 1 hourevery day.”AUTOTASK INCREASES PRODUCTIVITY OF BILLABLE EMPLOYEESForrester built a financial model based on a 30-user implementation, with the results shown in Figure 1. The analysisdemonstrates realized benefits of 738,595 compared with incurred costs of 248,210. The final results are a net presentvalue (NPV) of 490,385.FIGURE 1Financial Summary Showing Three-Year Risk-Adjusted ResultsROI:198%Source: Forrester Research, Inc.Benefits PV: 738,595Costs PV: 248,210Payback:3.7 months
4›Benefits. The following risk-adjusted benefits are representative of those experienced by the companies interviewed: Improved productivity of billable personnel. Productivity for billable employees increased by an average of 1hour per day, and 50% of the increase was attributed to Autotask for a savings over three years totaling 378,000. Reduced cost of customer turnover. Customer service improved to higher levels, and the net result was thatcustomer turnover dropped 12%. The cost of replacing the customers that would have been lost without the increasein service level performance saved the organization 513,000 over three years.›Costs. The following risk-adjusted costs are representative of costs incurred by the companies interviewed: License cost for Autotask. Autotask pricing for PSA is based on active users, and pricing for AEM is based on thenumber of endpoints. For an organization with 30 billable employees and 2,500 endpoints, the cost totals 226,195over three years. Cost to implement Autotask. One professional was hired for one month from Autotask to handle theimplementation, including the effort to codify existing contracts into the system, at a cost of 42,000. Cost to train employees. Employees attended a two-day training course that incurred a productivity cost of 16,962.DisclosuresThe reader should be aware of the following:›The study is commissioned by Autotask and delivered by Forrester Consulting. It is not meant to be used as a competitiveanalysis.›Forrester makes no assumptions as to the potential ROI that other organizations will receive. Forrester strongly advisesthat readers use their own estimates within the framework provided in the report to determine the appropriateness of aninvestment in Autotask.›Autotask reviewed and provided feedback to Forrester, but Forrester maintains editorial control over the study and itsfindings and does not accept changes to the study that contradict Forrester's findings or obscure the meaning of the study.›Autotask provided the customer name for the interviews but did not participate in the interviews.
5TEI Framework And MethodologyINTRODUCTIONFrom the information provided in the interviews, Forrester constructed a Total Economic Impact (TEI) framework for thoseorganizations considering implementing Autotask. The objective of the framework is to identify the cost, benefit, flexibility,and risk factors that affect the investment decision, to help organizations understand how to take advantage of specificbenefits, reduce costs, and improve the overall business goals of winning, serving, and retaining customers.APPROACH AND METHODOLOGYForrester took a multistep approach to evaluate the impact that Autotask can have on an organization (see Figure 2).Specifically, we:›Interviewed Autotask marketing, sales, and consulting personnel, along with Forrester analysts, to gather data relative tothe marketplace.›Interviewed two organizations currently using Autotask to obtain data with respect to costs, benefits, and risks.›Constructed a financial model representative of the interviews using the TEI methodology. The financial model ispopulated with the cost and benefit data obtained from the interviews.›Risk-adjusted the financial model based on issues and concerns the interviewed organizations highlighted in the interview.Risk adjustment is a key part of the TEI methodology. While the interviewed organizations provided cost and benefitestimates, some categories included a broad range of responses or had a number of outside forces that might haveaffected the results. For that reason, some cost and benefit totals have been risk-adjusted and are detailed in eachrelevant section.Forrester employed four fundamental elements of TEI in modeling Autotask’s service: benefits, costs, flexibility, and risks.Given the increasing sophistication that enterprises have regarding ROI analyses related to IT investments, Forrester’s TEImethodology serves to provide a complete picture of the total economic impact of purchase decisions. Please see AppendixB for additional information on the TEI methodology.FIGURE 2TEI ApproachPerformdue diligenceSource: Forrester Research, Inc.Conduct customerinterviewsConstruct financialmodel using TEIframeworkWritecase study
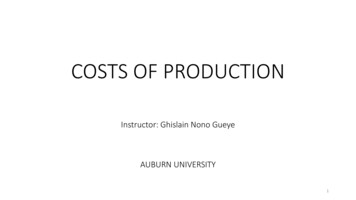
6AnalysisINTERVIEW HIGHLIGHTSForrester interviewed two organizations that use Autotask. Both organizations had about two years of experience using PSAand six to eight months of experience using a unified PSA/AEM platform from Autotask. The financial analysis in this studyblends the experience of the two companies and builds a financial model based on a 30-user organization. Both companiesprovided similar feedback to Forrester relative to their size about the customer experience and financial benefits of usingAutotask.INDUSTRYREGIONINTERVIEWEEBILLABLE EMPLOYEESOrganization AUnited StatesCEO10 contact center agents and2,000 endpointsEuropeHead, project managementoffice250 contact center and fieldtechnical employees and 20,000endpointsOrganization BResultsThe interview revealed that the organizations realized benefitsthat included:›››Efficiency. Autotask had an impact on not only the productivityof billable employees but also backroom operations. Oneexecutive said: “Usually the accounts department is following upand asking, ‘Can we bill yet?’ Today our delivery teams areproactively telling the accounts group when it’s time to bill theclient. It’s a small change, but makes a significant impact onhow a company operates.”Accountability. The organizations were more responsive tocustomers. As part of a larger initiative to improve performanceoverall, using Autotask PSA and AEM together contributed toone organization reducing its average response time by 28%and meeting SLA response times 10% more frequently. “Whena call comes into the call center, our people can immediatelysee the SLAs and call history, which allows them to make betterdecisions about promising a return call or immediatelyescalating to a Level 2 technician. The lag time betweendecision and action is significantly reduced.”“Autotask gives us greatervisibility of all our data andour customer issues across theboard. Everybody is using thesame dashboard and workingto the same information.” Head of project management office,Organization BIntelligence. One executive told Forrester: “We are able to look at a customer’s contract, value of the customer, and howmany tickets they’ve created. We analyze the tickets to identify root causes that are impacting the customer. We areproactively solving customers’ problems, which not only cuts down the tickets that we receive but demonstrates to thecustomer that we are proactive and engaged in helping solve their problems.”
7FIGURE 3Response Time Results Of One OrganizationSource: Forrester Research, Inc.
8BENEFITSBased on the interviews, Forrester constructed a composite company and an associated ROI analysis that illustrates theareas financially affected. The composite organization is representative of the two companies that Forrester interviewed andis used to present the aggregate financial analysis in the next section. The composite organization was able to avoid coststhrough improved productivity of billable personnel and a reduced cost of customer turnover.Improved Productivity Of Billable PersonnelThe financial model is built around a company size of 30 billable employees, which lies between the twocompanies that Forrester interviewed. Specifically:›The organization improved productivity by 1 hour per day. For 260 working days per year, that results in 7,800saved hours, which is equivalent to four employees per year.›It rolled out comprehensive programs for employee productivity. The programs included Autotask tools butwere more comprehensive than just the tools. Over two years, this organization increased the average billabletime for employees from 34% to 87%.›The increased productivity allowed the organization to service its growing customer base without hiring anadditional four employees, which avoided costs of 140,000 over three years.›Forrester risk-adjusted this benefit downward by 10% to account for variability that readers may experience.The risk-adjusted benefit totaled 378,000 over three years.TABLE 1Improved Productivity Of Billable PersonnelRef.MetricA1Billable employees affected by toolsA2Annual hours saved (1 hour per employee perday for 260 days per year)A3Equivalent full-time employees (divided by2,080 working hours/year, rounded)A4Average burdened salaryA5Percent of improvement that is attributable tousing Autotask, assuming other influentialfactorsAtImproved productivity of billable personnelRisk adjustmentAtrImproved productivity of billable personnel(risk-adjusted)Source: Forrester Research, ear 1Year 2Year 33030307,8007,8007,800444 70,000 70,000 70,00050%50%50% 140,000 140,000 140,000 126,000 126,000 10% 126,000
9Reduced Cost Of Customer TurnoverUsing a unified PSA/AEM solution, the organization significantly improved its customer service. Specifically:›Response times increased by 28%, and the organization attained its response time SLAs 10% morefrequently.›Customer satisfaction increased by 3% to a 96.6% survey rating.›Satisfaction among unhappy customers was reduced by 48% to only 3% of customers.The financial impact of improvements in customer satisfaction resulted in more customers renewing their servicecontracts. From the time before using Autotask to the time after using Autotask, renewal rates increased andcustomer turnover decreased. The impact equated to:›A reduction in customer turnover that was equivalent to 12% of the organization’s annual revenue.›An equivalent benefit per year of 180,000. The previous cost of replacing this revenue would have requiredthe equivalent of 1.5 sales reps per year at a total cost of salary and commission of 180,000.›A financial savings over three years of 540,000. Forrester risk-adjusted this benefit downward by 5%,resulting in a three-year savings of 513,000. See the section on Risks for more detail.TABLE 2Reduced Cost Of Customer TurnoverRef.B1MetricReduced value of customers that previouslyterminated contracts annuallyCalculationB2Bookings revenue that sales reps did notneed to replace due to lower turnoverB1 * 10 millionB3Average quota per salespersonB2/ 800,000B4Burdened salary and commissionBtReduced cost of customer turnoverRisk adjustmentBtrReduced cost of customer turnover(risk-adjusted)Source: Forrester Research, Inc.B3*B4Year 1Year 2Year 312%12%12% 1,200,000 1,200,000 1,200,0001.51.51.5 120,000 120,000 120,000 180,000 180,000 180,000 171,000 171,000 5% 171,000
10Total BenefitsTable 3 shows the total of all benefits as well as associated present values, discounted at 10%. Over three years,the organization expects all benefits to total a net present value of 738,595.TABLE 3Total Benefits (Risk-Adjusted)Ref.AtrBtrBenefitImproved productivityof billable personnelReduced cost ofcustomer turnoverTotal benefitsSource: Forrester Research, Inc.InitialYear 1Year 2Year 3TotalPresentValue 0 126,000 126,000 126,000 378,000 313,343 0 171,000 171,000 171,000 513,000 425,252 0 297,000 297,000 297,000 891,000 738,595
11COSTSThe composite organization incurred the following costs:›License and initial configuration cost for Autotask.›Cost to implement Autotask.›Cost to train employees.License And Initial Configuration Cost For AutotaskThe organization paid license fees to Autotask. The pricing for PSA is based on the number of active users, andthe price for AEM is based on the number of active endpoints. The total cost included setup fees and license feesthat totaled 226,195 for a 30-user model. Because the model is based on list prices for Autotask, Forrester didnot risk-adjust this cost.TABLE 4License Cost For AutotaskRef.MetricC1PSA configurationC2PSA license cost (per user)C3AEM configurationC4AEM license cost (per endpoint)CtLicense and initial configurationcosts for AutotaskCtrCalculationInitialYear 2Year 3 5,995 75 per month*30 users 27,000 27,000 27,000 45,000 45,000 45000 72,000 72,000 72,000 72,000 72,000 72,000 4,200 1.50 permonth *2,500endpointsC1 C2 C3 C4 10,195Risk adjustment 0%License and configuration costs forAutotask(risk-adjusted) 10,195Source: Forrester Research, Inc.Year 1
12Cost To Implement AutotaskThe organization hired one professional services personnel from Autotask, primarily to codify existing contracts inthe unified PSA/AEM system. In addition to the licensing prices, the organization paid for 160 hours at 250 perhour for a total investment of 40,000. Forrester risk-adjusted this cost upward by 5%, resulting in a cost of 42,000.TABLE 5Cost To Implement AutotaskRef.D1MetricOne Autotask professional for onemonthD2Average hourly costDtCost to implement AutotaskDtrCalculation160 hoursInitial160 250D1*D2 40,000Risk adjustment 5%Cost to implement Autotask(risk-adjusted) 42,000Source: Forrester Research, Inc.Year 1Year 2Year 3
13Cost To Train EmployeesThe organization put its 30 billable employees through two days of training to use Autotask. While the team didrequire a short learning curve to effectively leverage the new tools, the benefit realized was nearly instantaneous,as using the tools was intuitive and, in some cases, automated. The total cost for training 30 employees was 16,154. Forrester risk-adjusted this cost upward by 5%, resulting in a risk-adjusted cost of 16,962.TABLE 6Cost To Train EmployeesRef.E1MetricTwo days of training for 30employees (in years)E2Average burdened salaryEtCost to train employeesEtrCalculation30*8*2InitialYear 1Year 2Year 3480 70,000E1/2,080*E2 16,154Risk adjustment 5%Cost to train employees(risk-adjusted) 16,962Source: Forrester Research, Inc.Total CostsTable 7 shows the total of all costs as well as associated present values, discounted at 10%. Over three years, theorganization expects costs to total a net present value of 248,210.TABLE 7Total Costs (Risk-Adjusted)Ref.CtrDtrEtrBenefitLicense cost forAutotaskCost to configureAutotaskCost to trainemployeesTotal costsSource: Forrester Research, Inc.InitialYear 1Year 2Year 3TotalPresentValue 10,195 72,000 72,000 72,000 226,195 189,248 42,000 0 0 0 42,000 42,000 16,962 0 0 0 16,962 16,962 69,157 72,000 72,000 72,000 285,157 248,210
14RISKSForrester defines two types of risk associated with this analysis: “implementation risk” and “impact risk.” Implementation riskis the risk that a proposed investment in Autotask may deviate from the original or expected requirements, resulting in highercosts than anticipated. Impact risk refers to the risk that the business or technology needs of the organization may not bemet by the investment in Autotask, resulting in lower overall total benefits. The greater the uncertainty, the wider the potentialrange of outcomes for cost and benefit estimates.Quantitatively capturing implementation risk and impact risk by directly adjusting the financial estimates results providesmore meaningful and accurate estimates and a more accurate projection of the ROI. In general, risks affect costs by raisingthe original estimates, and they affect benefits by reducing the original estimates. The risk-adjusted numbers should be takenas “realistic” expectations since they represent the expected values considering risk.Table 8 shows the values used to adjust for risk and uncertainty in the cost and benefit estimates for the organization.Readers are urged to apply their own risk ranges based on their own degree of confidence in the cost and benefit estimates.TABLE 8Benefit And Cost Risk AdjustmentsBenefitsAdjustmentImproved productivity of billable personnel 10%Reduced cost of customer turnover 5%CostsAdjustmentLicense and configuration cost for Autotask 0%Cost to implement Autotask 5%Cost to train employees 5%Source: Forrester Research, Inc.
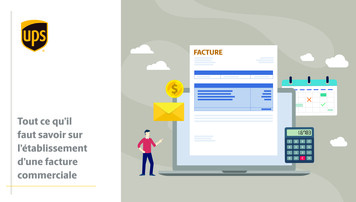
15Financial SummaryThe financial results calculated in the Benefits and Costs sections can be used to determine the ROI, NPV, and paybackperiod for the organization’s investment in Autotask. Table 9 below shows the risk-adjusted ROI, NPV, and payback periodvalues. These values are determined by applying the risk-adjustment values from Table 8 in the Risks section to theunadjusted results in each relevant cost and benefit section.FIGURE 4Net Benefits Chart (Risk-Adjusted) 700,000 600,000 500,000 400,000 300,000 200,000 100,000 0( 100,000)( 200,000)InitialYear 1Total costsTotal benefitsYear 2Year 3Net benefits (cumulative)Source: Forrester Research, Inc.TABLE 9Net Benefits (Risk-Adjusted)InitialCostsYear 2Year 3TotalPresent Value( 69,157)( 72,000)( 72,000)( 72,000)( 285,157)( 248,210) 0 297,000 297,000 297,000 891,000 738,595( 69,157) 225,000 225,000 225,000 605,843 490,385BenefitsNet benefitsYear 1ROIPaybackSource: Forrester Research, Inc.198%3.7 months
16Study ConclusionsForrester interviewed two organizations using a unified implementation of Autotask PSA and AEM tools. Despite differencesbetween the organizations’ size and geography, both realized similar costs and benefits relative to company size.Organization A recognized a time savings equivalent to 1 hour per day per technician, 50% of which was attributed to usingAutotask. Organization B achieved similar results on a considerably larger scale as part of a broader initiative to improveefficiency, which included Autotask.By building a financial model that is representative of both organizations and based on a 30-user organization,Forrester developed a model that shows that the investment in Autotask may be recouped in less than four monthsand result in a 198% ROI. Specifically:›For a 30-user company, a first-year investment of 141,157 yielded annual benefits of 297,000 and a netbenefit of 605,848 in three years.›The organizations also realized additional performance results such as reduced customer response times,improvements in achieving SLA targets, and increases in customer satisfaction that contributed to customerretention; these benefits are expected to have a further impact on ROI results.
17Autotask: OverviewThe following information is provided by Autotask. Forrester has not validated claims and does not endorse Autotask or itsofferings.AUTOTASK’S UNIFIED IT BUSINESS MANAGEMENT PLATFORM IS ENTIRELY UNIQUE TO OUR INDUSTRY.Our platform centralizes people, devices and data and automates processes and workflows associated with CRM, time andmaterials, projects, SLAs, and RMM. Unlike other combined solutions, our Endpoint Management doesn’t just integrate withAutotask, it IS Autotask. By combining Remote Monitoring and Management (RMM) with the Professional ServicesAutomation (PSA) service delivery engine, we enables MSPs and ITSPs to deliver superior service quality, higher profitabilityand a superior user experience.Legacy PSA AEM integrations can be complicated, time consuming and frequently create barriers to efficiency that are veryfamiliar to ITSPs:›Ticket inefficiency: single ticket queues with no intelligent routing or workflows.›Inflexibility: rigid workflows that make it difficult to alter processes for individual customers, devices or monitors.›Disparate reporting: no ability to consolidate device, delivery and service data for context and contractual cross-reference.Only Autotask’s unified IT Business Management platform provides the following benefits to ITSPs:›One company to maintain and support the integration and the two products.›Improved efficiency and actionable, unified analytics: Advanced ticket integration, routing and handling. Real-time asset database with contract compliance and dashboard visibility. Single Sign-On for secure, convenience, seamless navigation. Unified ticket experience makes it easier to identify, resolve, and document incidents. Integrated dashboards and analytics that elevate insights and guide continuous service improvement.›Setup and deployment are easy: Simple, streamlined set-up with preconfigured dashboards to allow you to quickly get upand running.While legacy integrations are “tactical,” providing moderate efficiency but nothing else, Autotask’s unified platform isstrategic. We give IT service providers a simple, scalable, SaaS architecture that enables a level of efficiency and scalabilitythat is unachievable using traditional integrations and on-prem solutions:›9,000 global technology service providers rely on Autotask to track KPIs and identify growth opportunities.›Our born-in-the-cloud user interface with 99.99% uptime, four years running.›We offer localized support and free training around the globe.For more information, visit www.autotask.com.
18Appendix A: GlossaryDiscount rate: The interest rate used in cash flow analysis to take into account the time value of money. Companies settheir own discount rate based on their business and investment environment. Forrester assumes a yearly discount rate of10% for this analysis. Organizations typically use discount rates between 8% and 16% based on their current environment.Readers are urged to consult their respective organizations to determine the most appropriate discount rate to use in theirown environment.Net present value (NPV: The present or current value of discounted future net cash flows given an interest rate (thediscount rate). A positive project NPV normally indicates that the investment should be made, unless other projects havehigher NPVs.Present value (PV: The present or current value of (discounted cost and benefit estimates given at an interest rate (thediscount rate. The PV of costs and benefits feed into the total NPV of cash flows.Payback period: The breakeven point for an investment. This is the point in time at which net benefits (benefits minus costsequal initial investment or cost).Return on investment (ROI: A measure of a project’s expected return in percentage terms. ROI is calculated by dividing netbenefits (benefits minus costs by costs).A NOTE ON CASH FLOW TABLESThe following is a note on the cash flow tables used in this study. The initial investment column contains costs incurred at“time 0” or at the beginning of Year 1. Those costs are not discounted. All other cash flows in years 1 through 3 arediscounted using the discount rate at the end of the year. PV calculations are calculated for each total cost and benefitestimate. NPV calculations are not calculated until the summary tables are the sum of the initial investment and thediscounted cash flows in each year.Sums and present value calculations of the Total Benefits, Total Costs, and Cash Flow tables may not exactly add up, assome rounding may occur.
19Appendix B: Total Economic Impact OverviewTotal Economic Impact is a methodology developed by Forrester Research that enhances a company’s technology decisionmaking processes and assists vendors in communicating the value proposition of their products and services to clients. TheTEI methodology helps companies demonstrate, justify, and realize the tangible value of IT initiatives to both seniormanagement and other key business stakeholders. TEI assists technology vendors in winning, serving, and retainingcustomers.The TEI methodology consists of four components to evaluate investment value: benefits, costs, flexibility, and risks.BENEFITSBenefits represent the value delivered to the user organization — IT and/or business units — by the proposed product orproject. Often, product or project justification exercises focus just on IT cost and cost reduction, leaving little room to analyzethe effect of the technology on the entire organization. The TEI methodology and the resulting financial model place equalweight on the measure of benefits and the measure of costs, allowing for a full examination of the effect of the technology onthe entire organization. Calculation of benefit estimates involves a clear dialogue with the user organization to understandthe specific value that is created. In addition, Forrester also requires that there be a clear line of accountability establishedbetween the measurement and justification of benefit estimates after the project has been completed. This ensures thatbenefit estimates tie back directly to the bottom line.COSTSCosts represent the investment necessary to capture the value, or benefits, of the proposed project. IT or the business unitsmay incur costs in the form of fully burdened labor, subcontractors, or materials. Costs consider all the investments andexpenses necessary to deliver the proposed value. In addition, the cost category within TEI captures any incremental costsover the existing environment for ongoing costs associated with the solution. All costs must be tied to the benefits that arecreated.FLEXIBILITYWithin the TEI methodology, direct benefits represent one part of the investment value. While direct benefits can typically bethe primary way to justify a project, Forrester believes that organizations should be able to mea
Autotask provides a technology platform that combines Professional Services Automation (PSA) and Autotask Endpoint Management (AEM). The unified solution streamlines the delivery of IT services, ticketing, and billing with contract terms and service-level agreements (SLAs). Autotask commissioned Forrester Consulting to conduct a