Transcription
World Academy of Science, Engineering and Technology 3 2007EEG Waves Classifier using Wavelet Transformand Fourier TransformMaan M. ShakerWillians filtering are used for the extraction of the featuresfrom each EEG channel, and NN is used as task classifier(these tasks include: open eye, mouse forward, mousebackward and standing). Khidhir A.S. M. (2000) proposed aprocedure to study the human state or movement (these statesinclude: open eye, mouse forward, mouse backward, andstanding) from EEG signal only [6]. The autocorrelation,wavelets, and Principal Component Analysis (PCA) were thetypes of the processing used. The Neural Network (NN) isused to recognize the state. The autocorrelation signal is usedinstead of the signal itself to decrease the complexity of theNN. PCA is used to reduce the dimensionality of the EEGsignal. Finally, wavelet analysis is used as a classifier prior tothe NN.The aim of this work is to calculate the EEG waves (delta,theta, alpha, and beta) using Discrete Wavelet Transforms(DWT) followed by discrete Fast Fourier Transform (FFT).Abstract—The electroencephalograph (EEG) signal is one of themost widely signal used in the bioinformatics field due to its richinformation about human tasks. In this work EEG wavesclassification is achieved using the Discrete Wavelet TransformDWT with Fast Fourier Transform (FFT) by adopting the normalizedEEG data. The DWT is used as a classifier of the EEG wave’sfrequencies, while FFT is implemented to visualize the EEG waves inmulti-resolution of DWT. Several real EEG data sets (real EEG datafor both normal and abnormal persons) have been tested and theresults improve the validity of the proposed technique.Keywords—Bioinformatics, DWT, EEG waves, FFT.I. plex irregular signals that may provide informationabout underlying neural activities in the brain [1].Electroencephalograms are recordings of the tiny electricalpotentials (generally less than 300µV) produced by the brain[2-3].The brain waves recorded from the scalp have smallamplitude of approximately 100µV. The frequencies of thesebrain waves range from 0.5 to 100 Hz, and their characteristicsare highly dependent on the degree of activity of the cerebralcortex [4]. Generally, in normal persons, the brain waves maybe classified as belonging to one of four wave groups. Thespectra of these waves are called [3]:1. The Delta waves which include all the waves in the EEGbelow 3.5 Hz. They occur in deep sleep, in childhood, and inserious organic brain disease.2. The Theta waves have frequencies between 4 and 7 Hz.These occur mainly during the childhood, but they also occurduring emotional stress in some adults.3. The Alpha waves are rhythmic waves occurring at afrequency range between 8 and 13 Hz, which are found in allnormal persons when they are awake in a quiet, resting state ofcerebration.4. The Beta waves are very low amplitude, and highfrequency range between 13 and 30 Hz. They are affected bymental activity.Many researchers tried to investigate these EEG wavesactivities recently. Suleiman A.B. R. (2001) proposed a newapproach for describing and classifying the EEG brain naturaloscillations (delta, theta, alpha, and beta) frequencies usingWigner-Ville analysis with Choi-Willians filtering and NeuralNetwork (NN) [5]. The Wigner-Ville analysis and Choi-EII. THEORETICAL CONCEPTS: DISCRETE WAVELETTRANSFORMS (DWT)The DWT means choosing subsets of the scales ( a ) andpositions ( b ) of the wavelet mother ψ (t ) .a aψ (a ,b ) (t ) 2 2 ψ (2 2 (t b)) .(1)Choosing scales and positions are based on powers of two,which are called dyadic scales and positions { a j 2; b j ,k 2 j jk } ( j and k integers). Equation (1) shows thatit is possible to built a wavelet for any function by dilating afunction ψ (t ) with a coefficient 2 , and translating theresulting function on a grid whose interval is proportionalj jto 2 [7].Contracted (compressed) versions of the wavelet functionmatch the high-frequency components, while dilated(stretched) versions match the low-frequency components.Then, by correlating the original signal with wavelet functionsof different sizes, the details of the signal can be obtained atseveral scales. These correlations with the different waveletfunctions can be arranged in a hierarchical scheme utiondecomposition algorithm separates the signal into “details” atdifferent scales and a coarser representation of the signalnamed “approximation” [8-10].The algorithm of the DWT decomposition andreconstruction can be summarized by following procedure:Dr. Maan M. Shaker is assistance professor in OptoelectronicsEngineering, Technical College of Mosul, Mosul, Iraq (e-mail:maanms 56@yahoo.com).723
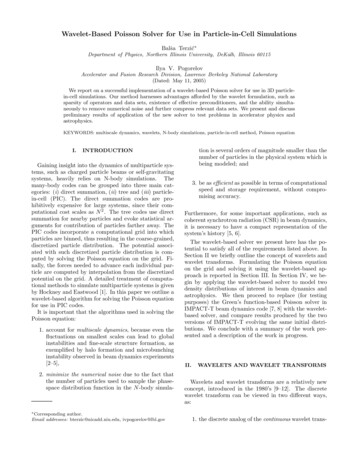
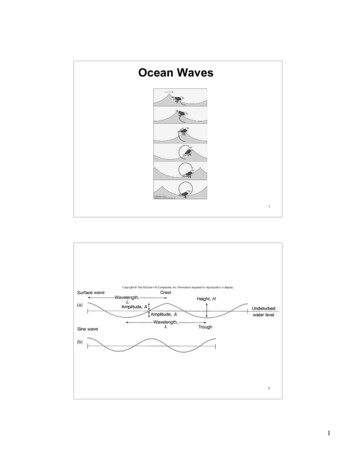
World Academy of Science, Engineering and Technology 3 2007 Given a signal “s” of length n. Starting from s, the first stepproduces two sets of coefficients: approximation coefficientscA1, and detail coefficients cD1. These vectors are obtainedby convolving s with the low-pass filter Lo D forapproximation, and with the high-pass filter Hi D for detail,followed by dyadic decimation. This is shown in Fig. (1.a).The length of each filter is equal to 2N. If n length (s), thesignals F and G are of length n 2N - 1, and then thecoefficients cA1 and cD1 are of lengthfloor (n 1) N2Fig. 2 The tree of the multi-decomposition (multi-level) of thesignal s(2)Floor means that the length of the coefficients rolled to thenearest integer. The next step splits the approximation coefficients cA1into two parts using the same scheme, replacing s by cA1 andproducing cA2 and cD2 as shown in Fig. (1.b), and so on. So,the wavelet decomposition of the signal s analyzed at level ihas the following structure: [cAi, cDi. cD1]. The structure in Fig. 2 contains i 3, as shown in theterminal of the tree. Conversely, starting from cAi and cDi, the inverse discretewavelet transform (IDWT) reconstructs cAi-1, inverting thedecomposition step by inserting zeros and convolving theresults with the reconstruction filters, as shown in Fig. 3 [8],[10].III. EEG WAVES CLASSIFICATIONThe discrete wavelet transform (DWT) has main advantagesover many conventional methods in the separation of waves. Itprovides an optimal resolution in both the time and thefrequency domains (i.e., dividing the signals into variousmulti-level frequencies), and it eliminates the requirement ofsignal stationary [9].Fig. 3 The algorithm of the IDWTThe proposed approach is summarized in the followingsteps:A. Normalizing the DataBrian waves occur during the activity of brain cells andhave frequency range (3-30) Hz [2]. The signal should benormalized prior to any analysis on the EEG waves to rejectundesired signals. The normalization is performed by bandpass filtering the signal (3–30) Hz (four poles Elliptic filter isused), and then signal amplitude is carefully adjusted.B. Data Decomposition using DWTDWT chooses only a subset of scales and positions. DWTworks as filters where the signals are divided into two bands ateach a specified level called approximations and detailssignals. The approximations (A) are the high-scale, lowfrequency components of the signal. The details (D) are thelow-scale, high-frequency components. The samples of thesignal are dividing by 2 and this is called sub-sampling, asshown in Fig. 4. The data obtained after normalization stageserves as the input data to the DWT decompositions, which isalso known as Sub-band Coding, and could be repeated forfurther decomposition. At every level, the sub-sampling willFig. 1 The algorithm of the DWT, (a) one decomposition of thesignal s, (b) decomposition at each level724
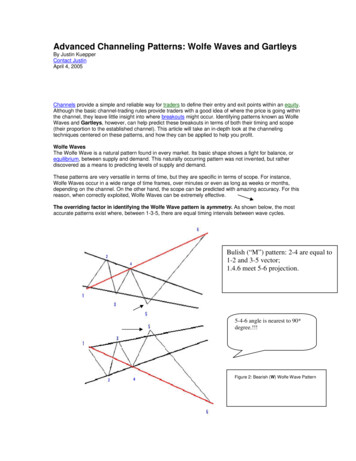
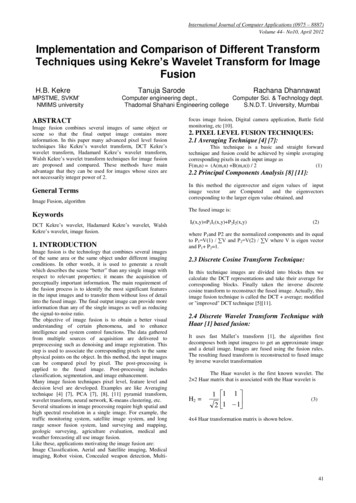
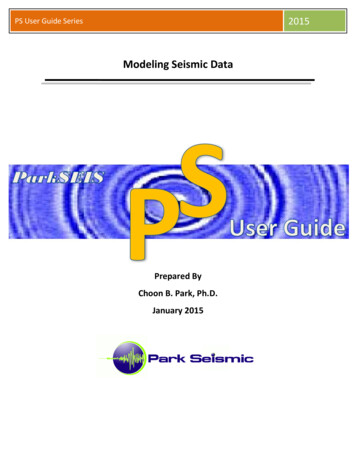
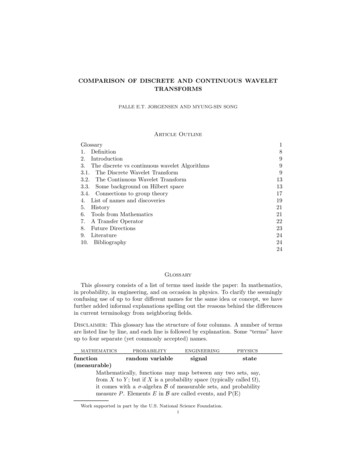
World Academy of Science, Engineering and Technology 3 2007result in half the number of samples. The procedure of thesub-band coding of the EEG data can be visualized [11], asshown in Fig. 5. In this work, a four-level multi-resolutiondecomposition using Daubechies4 wavelets is implemented.Each level could characterize the frequencies of the EEG databand.Fig. 4 The filtering process of the DWTC. Fast Fourier Transform (FFT) of each level in DWTlevels:Fourier analysis is extremely useful for data analysis, as itbreaks down a signal into constituent sinusoids of differentfrequencies. For sampled vector data, Fourier analysis isperformed using the discrete Fourier transform (DFT). Thefast Fourier transform (FFT) is an efficient algorithm forcomputing the DFT of a sequence; it is not a separatetransform. It is particularly used in area such as signalprocessing, where its uses range from filtering and frequencyanalysis to power spectrum estimation [9], [12]. Computationusing FFT of each level gives an indication to the frequenciesthat the bands contained in. Fig. 6 summarizes the flow chartof the EEG waves classification software.Fig. 6 Flow chart of EEG waves classification procedure.IV. PRACTICAL RESULTSThe EEG real data were recorded for both normal personsand epilepsy persons. The data were recorded as occipitalregion “O1” with earlobe “A1” as reference electrode .Thedata were transferred to the computer using NI-PCI-6023EDAQ, with sampling rate of 12 kHz. The length of each datarecorded is 10 sec (i.e. 120000 samples)[13]. Then, theamplitude of EEG data is normalized at ( 1) to be suitable forthe analysis.EEG waves classification contains two main processes: (a)EEG filtering, and (b) decomposition of the filtered signals.A. EEG Data FilteringThe digital filter used in the EEG waves classification is 4thorder pass band Elliptic filter, and the setting of the band passfrequencies is from (3-to-30) Hz. The filtered signals haveonly EEG waves (delta, theta, alpha, and beta) so this meansthat undesired frequencies (such as spikes) have been rejected.Fig. 7 shows the EEG data after filtering using the describeddigital filter. The main feature extracting from this Fig. is thatthe signals contain low frequencies. Figs. (7.a.1) and (7.b.1)represent the raw data before filtering for both the real data ofnormal person, and real data of abnormal person, respectively.Figs. (7.a.2) and (7.b.2) represent the filtered data for the sametwo persons above.Fig. 5 Sub-band coding algorithm of the DWT725
World Academy of Science, Engineering and Technology 3 20071.51.AmplitudeAmplitudeFrequency content of 4.(a.1)1.5111.522.53Time 0.5-0.5-1-10.511.522.5Time (sec)(b.1)33.544.55-1.50.0200.511.522.5Time (sec)33.544.55(b.2)0.01Fig. 7 The data before and after filtering for normalperson and abnormal person, where the left columnrepresents the raw data and right column represents thefiltered data0050100150frequency (Hz)(a)-64x 10Frequency content of D13.532µV /Hz2.521.510.50050100150frequency (Hz)(b)-54x 10Frequency content of D23.532µV /Hz2.521.510.50050100150frequency (Hz)(c)-4x 10Frequency content of D31.81.61.42µV /Hz1.210.80.60.4Fig. 8 Multi-level decomposition of real data of normal person0.20050100150frequency (Hz)(d)-3x 10Frequency content of D41.41.210.82µV /HzAmplitude0.51.50.5-1.5 0052-0µV /Hz-1.50.60.40.20050100150frequency (Hz)(e)Fig. 10 FFT of each DWT level of real data of normal person726
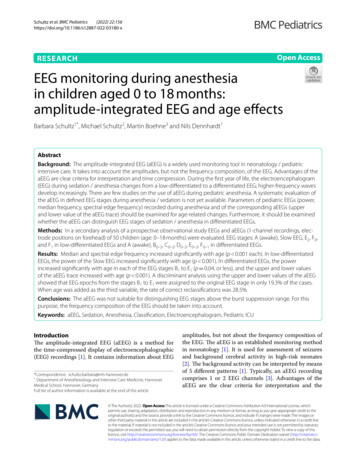
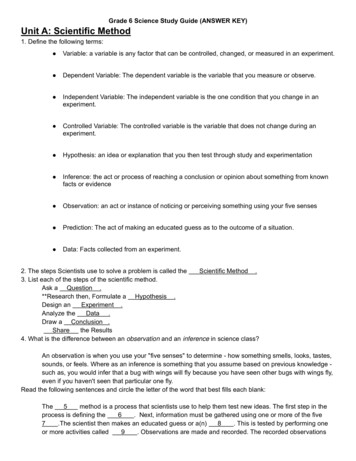
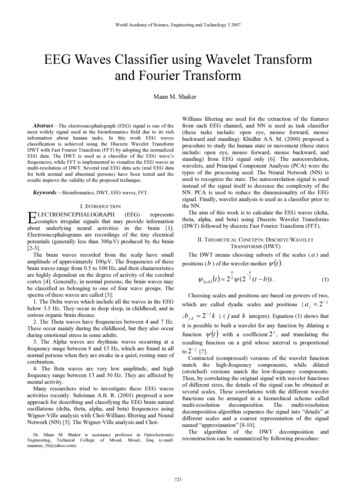
World Academy of Science, Engineering and Technology 3 2007Frequency content of Signal1101009080µV /Hz7026050403020100050100150frequency (Hz)(a)Frequency content of D40.450.40.35µV /Hz0.320.250.20.150.10.050050100150frequency (Hz)(b)Frequency content of D30.050.0450.040.035µV /Hz0.0320.0250.020.0150.01Fig. 9 Multi-level decomposition of real data of abnormal person0.0050050100150frequency (Hz)B. EEG Data Decomposition and Waves ClassificationThe filtered data contain the EEG waves; the EEG wavescan be extracted by decomposition of the data using multilevel discrete wavelet transform (DWT), where DWT containssub-band of the signal. Figs. 8 and 9 show the sub-banding ofreal data of normal person, and real data of abnormal person,respectively. Four levels of DWT using Debauches4 areimplemented. The information about the frequencies of theEEG waves is distributed in several wavelet levels. Moreover,wavelet coefficients are localized in time. Finally, to detect thefrequency contained in each level, FFT is employed. Figs. 10and 11 show the results of the applying the FFT for each DWTlevel of the real data for both normal person and abnormalperson. Visually, the EEG waves were calculated from theFFT of each level of DWT. The EEG signal contains allfrequencies and every frequency indicates a specific class. Thelow frequency containing in EEG signal, delta waves can beextracted, as shown in Figs. (10.b) and (11.b). Moreover, anincreasing in frequency can be extracted as theta waves inFigs. (10.c) and (11.c). The normal waves (alpha waves) canbe extracted in Figs. (10.d) and (11.d). Finally, the highfrequencies in EEG signal (beta waves) can be classified, as inFigs. (10.e) and (11.e).(c)-38x 10Frequency content of D2762µV /Hz543210050100150frequency (Hz)(d)-31.6x 10Frequency content of D11.41.22µV /Hz10.80.60.40.20050100150frequency (Hz)(e)Fig. 11 FFT of each DWT level of real data of abnormal person727
World Academy of Science, Engineering and Technology 3 2007V. CONCLUSIONEEG waves classification is achieved using an accurate andhighly distinguishable technique. The proposed method makesuse of both the discrete wavelet transform as well as thediscrete Fourier transform. Specially, wavelet transform isused as a classifier of the EEG frequencies. In addition, thefiltered EEG data were used as input to the wavelet transformoffers a perfect success in the rejecting undesired frequenciesand permits the DWT levels to discriminate the EEG wavesonly. This method offers more efficiency than previous works,which it can be easily distinguished between EEG waves.REFERENCES:[1] J. Bhattacharya, & H. Petsche, “Universality in the brain while listeningto music”, Proc. Royal Society Lond. B., No. 268, pp (2423-2433), 2001.[2] J.D. Bronzino, “Biomedical Engineering Handbook”, Vol. I, 2nd ed.,New York: CRC Press LLC, 2000.[3] Webster, J. G., “Medical Instrumentation Application and Design”, 2nded., New York: Wiley, 1995.[4] M. Abeles, & Goldstein M., “Mutispike Train Analysis”, Proc. IEEE,No. 65, pp (762-773), 1977.[5] A. R.Sulaiman, “Joint Time-Frequency Analysis and Its Application forNon-Stationary Signals”, Ph.D. Thesis, Elect. Eng. Dept., University ofMosul, 2001.[6] A. M Khidhir, “Investigation of using Electroencephalography Signals inMan-Machine Communication System”. Ph.D. Thesis. Elect. Eng. Dept.,University of Mosul, 2000.[7] S.G. Mallat, “A Theory for Multiresolution Signal Decomposition: TheWavelet Representation”, IEEE Trans. On Pattern Analysis and MachineIntell., Vol. 2, No. 7, pp: (674-693), 1989.[8] R. Quian Quiroga, Z. Nadasdy, & Y. Ben-Shaul, “Unsupervised SpikeDetection and Sorting with Wavelets and SuperparamagneticClustering”, Neural Computation, No. 16, pp (1661-1687), 2004.[9] A. Graps, “Introduction to Wavelets”, original paper published by theIEEE Computer Society (1995) Vol. 2 No. 2, 2003.[10] M. Misiti, Y. Misiti, G. Oppenheim, & J. Poggi, “Wavelet ToolboxUser’s Guide”, Ver. 2.2, The MathWorks, Inc., 2002.[11] M. Akin, O. Erogul, M. Bayram, N. Sezgin, “Determining of Doze LevelAnalyzing EEG Signals by Using Wavelet Transform and NeuralNetworks”, International XII., TAINN, Vol. I, No. 1, 2003.[12] “Statistical Toolbox User’s Guide”, Ver. 2.2, The MathWorks, Inc.,2004.[13] Mazin Z. Othman, Maan M. Shaker, “EEG Spikes Detection, Sorting,and Localization”, (Periodical style—Accepted for publication) IVEnformatika conference attended in 28 November 2005.Dr. Maan M. Shaker received his Electronic and communication Eng. B.Sc.,and got his M.Sc. in microprocessor applications from both college ofEngineering /Electrical department university of Mosul in 1978 and 1981,respectively. He had his Ph.D. in Optoelectronics Engineering for WarsawUniversity of Technology/ Boland in 1993. He supervised more than 21 M.Sc.and Ph.D. students. He has published more than 24 papers. His main interestfields are optoelectronic, electronic and communication applications.728
data were transferred to the computer using NI-PCI-6023E DAQ, with sampling rate of 12 kHz. The length of each data recorded is 10 sec (i.e. 120000 samples)[13]. Then, the amplitude of EEG data is normalized at ( 1) to be suitable for the analysis. EEG waves classification contains two main processes: (a)