Transcription
PERSPECTIVESA QUANTITATIVE APPROACH TO PRIVATEEQUITY FUND SELECTIONOctober 2019OverviewPrivate equity (PE) has long been immune to the radical, technology-drivenchanges that other asset classes have experienced over the last decade, dueto limited transparency, a lack of consistent data and longer investmenthorizons. In fact, the classical PE investment selection approach, which isheavily dependent on human judgement, has hardly changed since the1980s.Natalia SigristPartner, Private EquityUntil now, this approach has allowed investors to obtain returns that have consistentlyexceeded other asset classes, despite its time-consuming nature and associatedcosts. However, as the PE industry reaches maturity and faces growing scrutiny frominvestors in terms of fees and returns, it is becoming increasingly important forinvestors to make accurate, high conviction decisions in a fast and efficient manner.For this reason, at Unigestion, we believe that it is essential to integrate newtechnologies into the investment decision-making process, to be at the forefront ofinnovation in the industry and to anticipate disruptive changes.Artificial intelligence is reshaping the financial world by changing the way investmentsare analysed and selected. Ample research has been carried out in more traditionalfields of finance, like public equities, to assess if machine learning can enhance thepredictive power of existing models. The work of Gu et al. [2019] on forecasting publicequity risk premia goes in this direction and has paved the way for further research tobe carried out for more illiquid asset classes, such as private equity.Complementing Human Judgement with Machine-Powered AnalysisAt Unigestion, we are able to integrate the due diligence experience that we havegained over the last few decades in determining which fund characteristics are themost important drivers of superior risk-adjusted returns into a machine-drivenanalysis of a wide range of features. Drawing on our experience, we have developed amachine learning-based scoring tool to predict which funds will be successful, basedon the information available to prospective investors during fundraising. By combiningPE fund performance data from Preqin with other sources, we select the mostrelevant criteria, including the investment strategy, team composition, marketconditions, strategy execution and performance track record.The model has been set up to follow the binary classification approach, whichdetermines the probability that a fund’s performance will exceed a pre-defined hurdlerate. Thus, the output of each algorithm will be a score between 0 and 1, representingsuch a probability. In this way, the model output can be easily turned into aninvestment recommendation.Read more of our latest investment thinking online: www.unigestion.com/insighs/FOR PROFESSIONAL INVESTORS ONLYMarco PerfettoQuantitative Analyst, PrivateEquityKey Points1. Drawing on decades of privateequity market experience, we havedeveloped a machine-drivenscoring tool to substantiate ourhuman decision-making in thefund selection process.2. The scores produced can beturned into investment decisionsthrough an economic cost/benefitanalysis to create a frameworkthat can be calibrated according tobusiness needs.3. The tool should allow theinvestment team to screen alarger pool of potentialopportunities and focus more onvalue-creating activities.Unigestion I 1/5
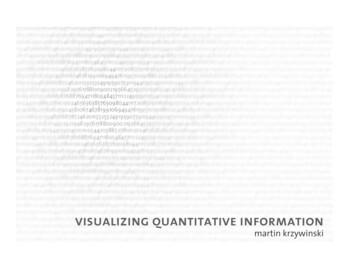
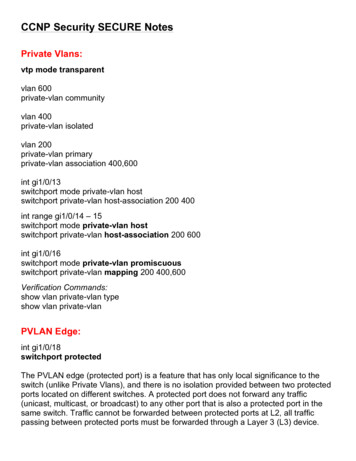
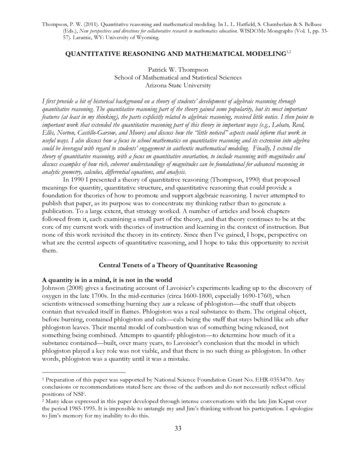
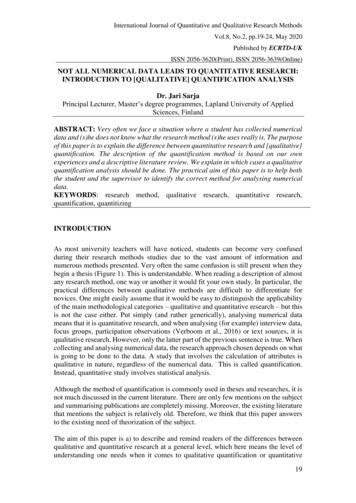
We have calibrated the model through a wide selection of machine learningalgorithms to obtain the best out-of-sample performance. As a metric to assessperformance, we use the area under the ROC curve (AUC), which represents theprobability that a randomly chosen successful fund (IRR above the hurdle rate) isattributed a higher score than a randomly chosen unsuccessful fund. In these terms,an AUC of 0.5 is equivalent to flipping a coin. Thus, the closer the AUC is to 1, thebetter the discriminating power of the model.Figure 1: Out-of-Sample AUC for Various Machine Learning ModelsOut-of-Sample AUC0.6740.659“Our research has shown somepromising model-basedpredictive power for fundperformance and we believethis could be enhanced furtherin future by incorporatingproprietary performance data.”0.6540.6470.648OLSLogisticSGDClassifier Regression Classifer0.645GradientBoostingClassifierXG BoostClassifierRandomForestClassifierMachine Learning ModelSource: Unigestion, based on Prequin data as at 31 December 2018For each algorithm, we calibrate the model twice, once using as target the funds thatultimately have performed better than the hurdle rate, and once with those thatultimately underperformed. The final score is calculated as the average of the twomodels. This makes the model more robust and allows us to give different weights tothe analysed features in the prediction of successful and unsuccessful funds.Figure 1 shows the performance in terms of AUC of the various machine learningalgorithms1 considered and compares it with the simpler linear OLS classifier. All thealgorithms show a forecasting power significantly superior to flipping a coin (AUC largerthan 0.5), but surprisingly, at the current stage, non-linearities captured by thesemachine learning models do not explain a significantly larger portion of the PE fundperformance. This might be due to the insufficient granularity of commercial datasets,which could be partially mitigated in future implementations by incorporating ourproprietary data, covering more than 20 years of PE fund performance.Figure 2 shows the ROC curve for the random forest classifier, the best-performingalgorithm, and compares it to the straight line, which corresponds to flipping a coin.1Referto Athey and Imbens (2019) for an overview of the various machine learning methods.Read more of our latest investment thinking online: www.unigestion.com/insights/FOR PROFESSIONAL INVESTORS ONLYUnigestion I 2/5
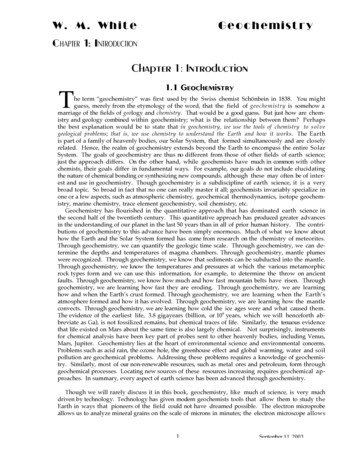
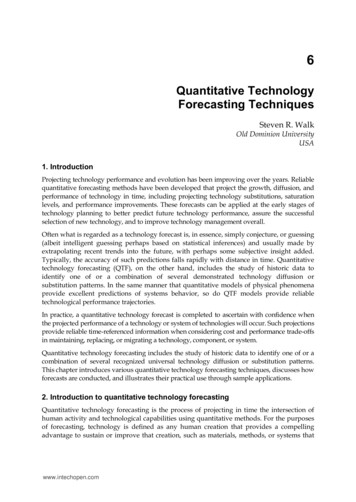
Figure 2: ROC Curve of Random Forest ClassifierROC curve (Area 0.674)100%True Positive Rate80%60%40%20%0%00.20.40.6False Positive Rate0.81Source: Unigestion, based on Prequin data as at 31 December 2018The performance of the classification models considered so far can also be assessedthrough the confusion matrix, a table that shows the proportion of instances thatwere correctly/incorrectly classified for both successful and unsuccessful funds.Figure 3 shows the confusion matrix for the out-of-sample performance of therandom forest classifier, the algorithm that performed best in terms of AUC.Figure 3: Normalised Confusion Matrix for the Random Forest Classifier andBenefit/Cost MatrixNormalised Confusion MatrixBenefit/Cost Matrix2.000.600.400.160.25IRR BelowThreshold0.300.200.100.070.52IRR AboveThreshold1.00True LabelTrue Label0.500.00-1.000.16-4.000.25IRR BelowThreshold-1.000.070.522.00IRR AboveThreshold-1.00-2.00-3.00-4.000.00IRR Below IRR AboveThreshold ThresholdIRR Below IRR AboveThreshold ThresholdPredicted LabelPredicted LabelSource: Unigestion, based on Prequin data as at 31 December 2018The scores produced by the algorithms considered so far can be turned into investmentdecisions through an economic cost/benefit analysis, based on the combination of theconfusion matrix and a cost-benefit matrix. The latter is a four-entry matrix thatassociates a cost or a benefit to each of the four possible outcomes of the predictionproblem. Interpreting the entries of the confusion matrix as probabilities, we cancompute the expected value of the total gains/losses, given a certain choice of thethreshold on the score, above which the fund is considered successful. In this way, weobtain an expected value framework that can be calibrated according tobusiness needs. This will be subject to further research.Read more of our latest investment thinking online: www.unigestion.com/insights/FOR PROFESSIONAL INVESTORS ONLYUnigestion I 3/5
Enhancing Returns through Collaborative IntelligenceIntegrating an initial machine-powered screening of potential investmentopportunities increases the investment team’s processing power and should enablethem to ‘turn over more stones’ in the dealflow. Analysing a larger pool of investmentopportunities increases the probability of identifying and investing in ‘hidden gems’,which can have a positive impact on overall portfolio returns.Even just focusing on the deselection of funds with a low probability of achieving thehurdle should enhance overall portfolio returns by improving the average performance.It should also boost the investment team’s efficiency by allowing them to focus on morevalue-creating activities, while also lowering abort costs (i.e. sunk costs where apotential investment is dropped at a later stage in the due diligence process).“Integrating an initial machinepowered screening of potentialinvestment opportunitiesincreases the investmentteam’s processing power andshould enable them to ‘turnover more stones’ in thedealflow.”In particular, quantitative scoring has relevance for the later funds raised by establishedmanagers. First and second funds of emerging managers will still require a heavy doseof experienced human judgement. As well as lacking a track record, emerging managersneed to be chosen on more intangible evidence such as specific skills, team chemistryand well-balanced incentives.In addition to the machine learning-based scoring tool, a cost-benefit analysis couldbe very practical in the investment decision-making process. If the current riskassessment during the investment evaluation process is complemented by actualvalue attribution, the entire process can benefit from significant efficiency gains. Theinvestment team can better allocate time across various projects and work streams,and the investment committees will have more tangible grounds for more consistentand transparent investment decision-making.What Next: A Systematic Investment Strategy for Private Equity?Screening and initial evaluation of opportunities is just the beginning. The power of AItechnology can be applied to the entire investment cycle, from deal origination tovalue creation. This will disrupt the conservative private equity industry – indeed, thefirst attempts have been already observed in the market.As data science resources and tools are becoming more available and increasinglypowerful, we are likely to see the emergence of new business models and strategiesin the industry. We believe factor-based systematic strategies will become an integralpart of PE investing.The choice of the right factors and access to sufficient volumes of historical data arecrucial for the identification and testing of data-driven models. Unigestion is wellpositioned to advance its quantitative research and continue its journey towards adigitalised PE world by leveraging its 20 years of extensive PE experience and dataaccumulated over this time.ReferencesAthey, Susan and Imbens, Guido W. Machine Learning Methods that EconomistsShould Know About (August 2019). Annual Review of Economics, Vol. 11, pp. 685-725,2019. Available at SSRN: https://ssrn.com/abstract 3445877Shihao Gu, Bryan Kelly, and Dacheng Xiu. Empirical Asset Pricing via MachineLearning. Chicago Booth Research Paper No. 18-04; 31st Australasian Finance andBanking Conference 2018; Yale ICF Working Paper No. 2018-09, 23, 2018. Available atSSRN: https://ssrn.com/abstract 3159577Steven N. Kaplan and Antoinette Schoar. Private Equity Performance: Returns,Persistence and Capital Flows. The Journal of Finance, 60(4):1791-1823, 2005.Available at: .15406261.2005.00780.xRead more of our latest investment thinking online: www.unigestion.com/insights/FOR PROFESSIONAL INVESTORS ONLYUnigestion I 4/5
Important InformationThis document is provided to you on a confidential basis and must not be distributed, published, reproduced or disclosed, in whole or part, to anyother person.The information and data presented in this document may discuss general market activity or industry trends but is not intended to be relied uponas a forecast, research or investment advice. It is not a financial promotion and represents no offer, solicitation or recommendation of any kind, toinvest in the strategies or in the investment vehicles it refers to. Some of the investment strategies described or alluded to herein may be construedas high risk and not readily realisable investments, which may experience substantial and sudden losses including total loss of investment.The investment views, economic and market opinions or analysis expressed in this document present Unigestion’s judgement as at the date ofpublication without regard to the date on which you may access the information. There is no guarantee that these views and opinions expressedwill be correct nor do they purport to be a complete description of the securities, markets and developments referred to in it. All information providedhere is subject to change without notice. To the extent that this report contains statements about the future, such statements are forward-lookingand subject to a number of risks and uncertainties, including, but not limited to, the impact of competitive products, market acceptance risks andother risks.Data and graphical information herein are for information only and may have been derived from third party sources. Although we believe that theinformation obtained from public and third party sources to be reliable, we have not independently verified it and we therefore cannot guaranteeits accuracy or completeness. As a result, no representation or warranty, expressed or implied, is or will be made by Unigestion in this respect andno responsibility or liability is or will be accepted. Unless otherwise stated, source is Unigestion.Past performance is not a guide to future performance. All investments contain risks, including total loss for the investor.Unigestion SA is authorised and regulated by the Swiss Financial Market Supervisory Authority (FINMA). Unigestion (UK) Ltd. is authorised andregulated by the UK Financial Conduct Authority (FCA) and is registered with the Securities and Exchange Commission (SEC). Unigestion AssetManagement (France) S.A. is authorised and regulated by the French “Autorité des Marchés Financiers” (AMF). Unigestion Asset Management(Canada) Inc., with offices in Toronto and Montreal, is registered as a portfolio manager and/or exempt market dealer in nine provinces across Canadaand also as an investment fund manager in Ontario and Quebec. Its principal regulator is the Ontario Securities Commission (OSC). Unigestion AsiaPte Limited is authorised and regulated by the Monetary Authority of Singapore (MAS). Unigestion Asset Management (Copenhagen) is co-regulatedby the “Autorité des Marchés Financiers” (AMF) and the “ Danish Financial Supervisory Authority” (DFSA). Unigestion Asset Management (Düsseldorf)SA is co-regulated by the “Autorité des Marchés Financiers” (AMF) and the “Bundesanstalt für Finanzdienstleistungsaufsicht” (BAFIN).Read more of our latest investment thinking online: www.unigestion.com/insights/FOR PROFESSIONAL INVESTORS ONLYUnigestion I 5/5
1Refer to Athey and Imbens (2019) for an overview of the various machine learning methods. 0.654 0.647 0.648 0.659 0.645 0.674 OLS Classifier Logistic Regression SGD Classifer Gradient Boosting Classifier XG Boost Classifier Random Forest Classifier t-of-C Machine Learning Model "Our research has shown some promising model-based predictive .