Transcription
The Millennium Development Goals Report2007U N I T E D N AT I O N S
This report is based on a master set of data that has been compiled by an Inter-Agency andExpert Group on MDG Indicators led by the Department of Economic and Social Affairsof the United Nations Secretariat, in response to the wishes of the General Assembly forperiodic assessment of progress towards the MDGs. The Group comprises representativesof the international organizations whose activities include the preparation of one or moreof the series of statistical indicators that were identified as appropriate for monitoringprogress towards the MDGs, as reflected in the list below. A number of nationalstatisticians and outside expert advisers also contributed.I N T E R N AT I O N A L L A B O U R O R G A N I Z ATIONF O O D A N D AG R I C U LT U R E O R G A N I Z ATION OF THE UNITED NATIONSThe MillenniumDevelopment GoalsReport 2007U N I T E D N AT I O N S E DU CAT I O N A L , S C IENTIFIC AND CULTURAL ORGANIZATIONWO R L D H E A LT H O R G A N I Z AT I O NT H E WO R L D B A N KI N T E R N AT I O N A L M O N E TA RY F U N DI N T E R N AT I O N A L T E L E C O M M U N I CATION UNIONE C O N O M I C C O M M I S S I O N F O R A F R I CAE C O N O M I C C O M M I S S I O N F O R E U RO PEE C O N O M I C C O M M I S S I O N F O R L AT I N AMERICA AND THE CARIBBEANE C O N O M I C A N D S O C I A L C O M M I S S I ON FOR ASIA AND THE PACIFICE C O N O M I C A N D S O C I A L C O M M I S S I ON FOR WESTERN ASIAJ O I N T U N I T E D N AT I O N S P RO G R A M ME ON HIV/AIDSU N I T E D N AT I O N S C H I L D R E N ’ S F U N DU N I T E D N AT I O N S C O N F E R E N C E O N TRADE AND DEVELOPMENTU N I T E D N AT I O N S D E V E L O P M E N T F U ND FOR WOMENU N I T E D N AT I O N S D E V E L O P M E N T P ROGRAMMEU N I T E D N AT I O N S E N V I RO N M E N T P ROGRAMMEU N I T E D N AT I O N S F R A M E WO R K C O N VENTION ON CLIMATE CHANGEU N I T E D N AT I O N S H I G H C O M M I S S I O NER FOR REFUGEESU N I T E D N AT I O N SU N I T E D N AT I O N S H U M A N S E T T L E M ENTS PROGRAMMEU N I T E D N AT I O N S P O P U L AT I O N F U N DI N T E R- PA R L I A M E N TA RY U N I O NO R G A N I SAT I O N F O R E C O N O M I C C O - OPERATION AND DEVELOPMENTWO R L D T R A D E O R G A N I Z AT I O NN E W YO R K ,2007
ForewordSince their adoption by all United Nations MemberStates in 2000, the Millennium Declaration andthe Millennium Development Goals have become auniversal framework for development and a meansfor developing countries and their developmentpartners to work together in pursuit of a sharedfuture for all.We are now at the midpoint between the adoptionof the MDGs and the 2015 target date. So far, ourcollective record is mixed. The results presented inthis report suggest that there have been some gains,and that success is still possible in most parts of theworld. But they also point to how much remains tobe done. There is a clear need for political leaders totake urgent and concerted action, or many millionsof people will not realize the basic promises of theMDGs in their lives.The MDGs are still achievable if we act now. Thiswill require inclusive sound governance, increasedpublic investment economic growth, enhancedproductive capacity, and the creation of decentwork. Success in some countries demonstratesthat rapid and large-scale progress towards theMDGs is feasible if we combine strong governmentleadership, good policies and practical strategiesfor scaling up public investments in vital areas withadequate financial and technical support from theinternational community.To achieve the Goals, nationally-owned developmentstrategies and budgets must be aligned with them.This must be backed up by adequate financingwithin the global partnership for development andits framework for mutual accountability.The world wants no new promises. It is imperativethat all stakeholders meet, in their entirety, thecommitments already made in the MillenniumDeclaration, the 2002 Monterrey Conference onFinancing for Development, and the 2005 WorldSummit. In particular, the lack of any significantincrease in official development assistance since2004 makes it impossible, even for well-governedcountries, to meet the MDGs. As this report makesclear, adequate resources need to be made availableto countries in a predictable way for them to be ableto effectively plan the scaling up of their investments.Yet, these promises remain to be fulfilled.I commend this report as a key resource to helpshow what can be achieved and how much still needsto be done. Reliable and timely information is key toformulating the necessary policies and strategies toensure progress, monitor development and make theMDGs achievable.Ban Ki-moonSecretary-General, United Nations
Overviewbeen unequally shared. Widening income inequality isof particular concern in Eastern Asia, where the share ofconsumption of the poorest people declined dramaticallybetween 1990 and 2004.Progress at the MDG mid-pointThe Millennium Declaration set 2015 as the target date forachieving most of the Goals. As we approach the midwaypoint of this 15-year period, data are now becomingavailable that provide an indication of progress during thefirst third of this 15-year period.This report presents the most comprehensive globalassessment of progress to date, based on a set of dataprepared by a large number of international organizationswithin and outside the United Nations system.The results are, predictably, uneven. The years since 2000,when world leaders endorsed the Millennium Declaration,have seen some visible and widespread gains. Encouragingly,the report suggests that some progress is being made evenin those regions where the challenges are greatest. Theseaccomplishments testify to the unprecedented degree ofcommitment by developing countries and their developmentpartners to the Millennium Declaration and to somesuccess in building the global partnership embodied in theDeclaration. Key interventions to control malaria have been expanded. The tuberculosis epidemic, finally, appears on the vergeof decline, although progress is not fast enough to halveprevalence and death rates by 2015.By pointing to what has been achieved, these results alsohighlight how much remains to be done and how much morecould be accomplished if all concerned live up fully to thecommitments they have already made. Currently, only oneof the eight regional groups cited in this report is on track toachieve all the Millennium Development Goals. In contrast,the projected shortfalls are most severe in sub-SaharanAfrica. Even regions that have made substantial progress,including parts of Asia, face challenges in areas such ashealth and environmental sustainability. More generally,the lack of employment opportunities for young people,gender inequalities, rapid and unplanned urbanization,deforestation, increasing water scarcity, and high HIVprevalence are pervasive obstacles.The results achieved in the more successful cases demonstratethat success is possible in most countries, but that the MDGswill be attained only if concerted additional action is takenimmediately and sustained until 2015. All stakeholders needto fulfil, in their entirety, the commitments they made in theMillennium Declaration and subsequent pronouncements.Moreover, insecurity and instability in conflict and postconflict countries make long-term development effortsextremely difficult. In turn, a failure to achieve the MDGscan further heighten the risk of instability and conflict. Yet inspite of a technical consensus that development and securityare mutually dependent, international efforts all too oftentreat them as independent from one another.The following are some measures of the progress that hasbeen achieved:The following are some of the key challenges that have to beaddressed: The proportion of people living in extreme poverty fellfrom nearly a third to less than one fifth between 1990 and2004. If the trend is sustained, the MDG poverty reductiontarget will be met for the world as a whole and for mostregions. Over half a million women still die each year from treatableand preventable complications of pregnancy and childbirth.The odds that a woman will die from these causes in subSaharan Africa are 1 in 16 over the course of her lifetime,compared to 1 in 3,800 in the developed world. The number of extremely poor people in sub-SaharanAfrica has levelled off, and the poverty rate has declined bynearly six percentage points since 2000. Nevertheless, theregion is not on track to reach the Goal of reducing povertyby half by 2015. If current trends continue, the target of halving theproportion of underweight children will be missed by30 million children, largely because of slow progress inSouthern Asia and sub-Saharan Africa. Progress has been made in getting more children intoschool in the developing world. Enrolment in primaryeducation grew from 80 per cent in 1991 to 88 per cent in2005. Most of this progress has taken place since 1999. Women’s political participation has been growing, albeitslowly. Even in countries where previously only men wereallowed to stand for political election, women now have aseat in parliament. Child mortality has declined globally, and it is becomingclear that the right life-saving interventions are provingeffective in reducing the number of deaths due to the mainchild killers – such as measles.4 The number of people dying from AIDS worldwideincreased to 2.9 million in 2006, and prevention measuresare failing to keep pace with the growth of the epidemic. In2005, more than 15 million children had lost one or bothparents to AIDS. Half the population of the developing world lack basicsanitation. In order to meet the MDG target, an additional1.6 billion people will need access to improved sanitationover the period 2005-2015. If trends since 1990 continue,the world is likely to miss the target by almost 600 millionpeople. To some extent, these situations reflect the fact that thebenefits of economic growth in the developing world have Most economies have failed to provide employmentopportunities to their youth, with young people more thanthree times as likely as adults to be unemployed. Warming of the climate is now unequivocal. Emissions ofcarbon dioxide, the primary contributor to global climatechange, rose from 23 billion metric tons in 1990 to 29billion metric tons in 2004. Climate change is projectedto have serious economic and social impacts, which willimpede progress towards the MDGs.This report also points to disparities within countries,where particular groups of the population – often thoseliving in rural areas, children of mothers with no formaleducation and the poorest households – are not makingenough progress to meet the targets, even where the rest ofthe population is. This is particularly evident in access tohealth services and education. In order to achieve the MDGs,countries will need to mobilize additional resources andtarget public investments that benefit the poor.Rapid and large-scale progress isfeasibleSeveral developing countries are demonstrating that rapidand large-scale progress towards the MDGs is possible whenstrong government leadership and policies and strategiesthat effectively target the needs of the poor are combinedwith adequate financial and technical support from theinternational community.In particular, impressive results have been achieved insub-Saharan Africa in areas such as raising agriculturalproductivity (in Malawi, for example), boosting primaryschool enrolment (as in Ghana, Kenya, Uganda and theUnited Republic of Tanzania), controlling malaria (as inNiger, Togo, Zambia, Zanzibar), widening access to basicrural health services (Zambia), reforesting areas on a largescale (Niger), and increasing access to water and sanitation(Senegal and Uganda). These practical successes now need tobe replicated and scaled-up.With support from the United Nations, many developingcountries – particularly in Africa – have advanced inpreparing strategies to achieve the MDGs. As of mid-2007,41 countries in sub-Saharan Africa had started the process ofpreparing national development strategies aligned with theMDGs and other development goals agreed upon through theUnited Nations. During this mid-point year, the internationalcommunity needs to support the preparation of thesestrategies and to accelerate implementation of the MDGs.In general, strategies should adopt a wide-ranging approachthat seeks to achieve pro-poor economic growth, includingthrough the creation of a large number of additionalopportunities for decent work. This, in turn, will requirecomprehensive programmes for human development,particularly in education and health, as well as buildingproductive capacity and improved physical infrastructure. Ineach case, an effort should be made to quantify the resourcesrequired to implement these programmes. Implementationshould be based on a medium-term approach to publicexpenditure. A sound national statistical system andenhanced public accountability are necessary to support allthese efforts.The MDGs should also be systematically integrated intopost-conflict recovery strategies by coordinating security andhumanitarian operations with long-term development efforts.The MDGs provide outcome objectives that countries can useas benchmarks for the transition from relief and recovery tolong-term development.Success in achieving the MDGs in the poorest and mostdisadvantaged countries cannot be achieved by thesecountries alone. Developed countries need to deliverfully on longstanding commitments to achieve the officialdevelopment assistance (ODA) target of 0.7 per cent of grossnational income (GNI) by 2015. It requires, in particular, theGroup of 8 industrialized nations to live up to their 2005pledge to double aid to Africa by 2010 and European UnionMember States to allocate 0.7 per cent of GNI to ODA by2015. In spite of these commitments, ODA declined between2005 and 2006 and is expected to continue to fall slightly in2007 as debt relief declines.Aid has to be improved by ensuring that assistance is alignedwith the policies that recipient countries have adopted, andthat flows to individual countries are continuous, predictableand assured and are not tied to purchases in the donorcountry. To this end, donors should reduce the presentunpredictability of aid by providing multi-year schedules ofaid flows to each recipient country. One of the uses of theadditional resources should be to multiply, within and acrosscountries, the number of “quick impact” initiatives that haveproven their efficacy in the past few years.As a further element of their development partnership, and asagreed to in Doha in 2001, all governments should redoubletheir efforts to reach a successful and equitable conclusionto the present trade negotiations – an outcome that ensuresthat the international trading system and global tradingarrangements become more conducive to development in alldeveloping countries.Addressing the challenge of climate change has to be anew but integral element of each country’s developmentstrategy. More importantly, however, it should become anenhanced part of the international development agenda:All development partners should collaborate intensivelyin devising a shared global strategy to address this globalproblem.JOSÉ ANTONIO OCAMPOUnder-Secretary-General for Economic and Social Affairs5
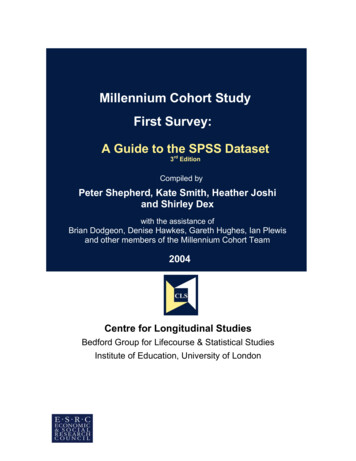
THE MILLENNIUM DEVELOPMENT GOALS REPORT 2007UNITED NATIONSGoal 1Eradicateextremepoverty& hungerproportion of people living in extreme poverty fell fromnearly a third to 19 per cent over this period. If progresscontinues, the MDG target will be met. However,success is unequally shared, since the decline in globalpoverty is mostly due to rapid economic growth inAsia. Eastern and South-Eastern Asia, in particular,experienced impressive reductions in poverty, andaccelerating growth in India has also put Southern Asiaon track to achieve the goal.TARGETHalve, between 1990 and 2015, the proportion of peoplewhose income is less than 1 a dayExtreme poverty is beginning to fall insub-Saharan AfricaIn contrast, poverty rates in Western Asia more thandoubled between 1990 and 2005. Extreme povertyrose sharply in the early 1990s in the Commonwealth ofIndependent States (CIS) and the transition countriesof South-Eastern Europe. Poverty rates in those regionsare now dropping, however, and approaching the levelsof the 1980s.Proportion of people living on less than 1 a day, 1990, 1999 and 2004(Percentage)Sub-Saharan Africa46.845.941.1Southern AsiaIn sub-Saharan Africa, the proportion of people living inextreme poverty fell from 46.8 per cent in 1990 to 41.1per cent in 2004. Most of this progress was achievedsince 2000. The number of people living on less than 1 a day is also beginning to level off, despite rapidpopulation growth. The per capita income of seven subSaharan countries grew by more than 3.5 per cent ayear between 2000 and 2005; another 23 had growthrates of more than 2 per cent a year over this period,providing a degree of optimism for the future.41.133.429.5Eastern Asia33.017.89.9Latin America & the Caribbean10.319909.619998.7Poverty gap ratio, 1990 and 2004 (Percentage)Sub-Saharan Africa19.517.5Southern Asia11.06.7Latin America & the Caribbean3.53.0Eastern Asia8.919902.12004South-Eastern Asia5.11.5Western Asia0.40.9Transition countries of South-Eastern Europe0.00.2Northern Africa0.52004South-Eastern AsiaThe poorest are getting a little less poor inmost regionsThe international poverty line isbeing redrawn20.88.90.2CIS0.16.80.1Western AsiaThe latest estimates on poverty draw on over 500household surveys from 100 developing countries,representing 93 per cent of the population of thedeveloping world. The international poverty line isbased on a level of consumption representative ofthe poverty lines found in low-income countries.Since 2000, the international poverty line hasbeen set at 1.08 a day, measured in terms of 1993purchasing power parity (PPP). In the coming year,new estimates of PPP, based on 2005 prices, willbe produced by the International ComparisonProgram. These new measures of the relative costof living among countries will require a revision tothe international poverty line and may change ourunderstanding of the extent and distribution of globalpoverty.1.62.53.8Northern Africa2.62.01.4Transition countries of South-Eastern Europe 0.11.30.7CIS0.55.50.6Developing regionsDeveloping regions9.35.405.010.015.020.0In most developing regions, the average income of those living on less than 1 a day has increased. The poverty gap ratio, which reflects the depthof poverty as well as its incidence, has decreased in all regions exceptWestern Asia, where the rising poverty rate has caused the poverty gapto increase, and in the transition countries in Europe and the CIS, wherethere has been marginal deterioration or no change. In contrast, the poorin Eastern and South-Eastern Asia have made important gains. In spite ofsome improvement, the poverty gap ratio in sub-Saharan Africa remainsthe highest in the world, indicating that the poor in that region are the mosteconomically disadvantaged in the world.31.623.419.201020304050Worldwide, the number of people in developing countries living on less than 1 a day fell to 980 million in 2004 – down from 1.25 billion in 1990. The
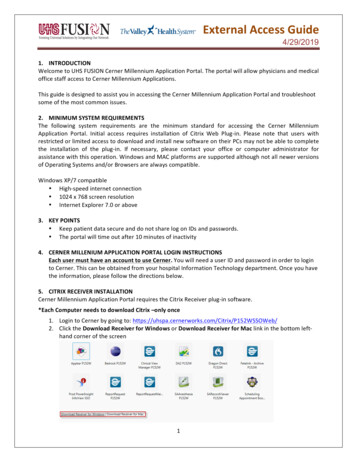
UNITED NATIONSPoverty reduction has beenaccompanied by rising inequalityShare of poorest quintile in national consumption,1990 and 2004 (Percentage)TARGETHalve, between 1990 and 2015, the proportion ofpeople who suffer from hunger.Child hunger is declining in all regions, butmeeting the target will require acceleratedprogressLatin America & the Caribbean2.82.7Sub-Saharan Africa3.419903.42004Proportion of children under age five who are underweight, 1990 and 2005(Percentage)Eastern Asia7.1Southern Asia4.553Western Asia465.9Sub-Saharan Africa5.433South-Eastern Asia296.2South-Eastern Asia6.139CIS287.9Northern Africa6.210Northern Africa11Southern Asia77.2Western Asia6.711Transition countries of South-Eastern Europe78.3Eastern Asia7.819Developing regions74.6Developing regions3.91.02.03.04.0335.06.07.08.0279.00.0The benefits of economic growth in the developingworld have been unequally shared, both within andamong countries. Between 1990 and 2004, the shareof national consumption by the poorest fifth of thepopulation in developing regions decreased from4.6 to 3.9 per cent (in countries where consumptionfigures were unavailable, data on income were used).Widening income inequality is of particular concern inEastern Asia, where the share of consumption amongthe poorest people declined dramatically during thisperiod. Still, inequality remains the highest in LatinAmerica and the Caribbean and in sub-Saharan Africa,where the poorest fifth of the people account for onlyabout 3 per cent of national consumption (or income). 2005Latin America & the Caribbean6.30.0199086.2102030405060Globally, the proportion of children under five who are underweightdeclined by one fifth over the period 1990-2005. Eastern Asia showed thegreatest improvement and is surpassing the MDG target, largely due tonutritional advances in China. Western Asia and Latin America and theCaribbean have also demonstrated significant progress, with underweightprevalence dropping by more than one third. The greatest proportions ofchildren going hungry continue to be found in Southern Asia and subSaharan Africa. Poor progress in these regions means that it is unlikely thatthe global target will be met. If current trends continue, the world will missthe 2015 target by 30 million children, essentially robbing them of their fullpotential.
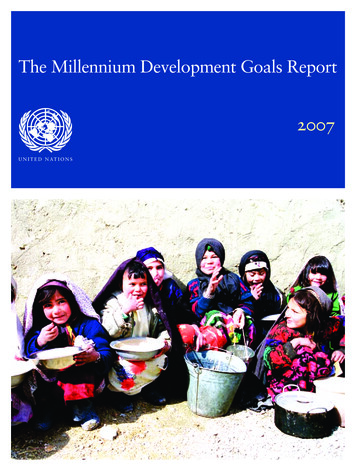
THE MILLENNIUM DEVELOPMENT GOALS REPORT 2007UNITED NATIONSGoal 2AchieveuniversalprimaryeducationTARGETEnsure that, by 2015, children everywhere, boys and girlsalike, will be able to complete a full course of primaryschoolingSub-Saharan Africa is making progress towardsuniversal enrolment, but has a long way to goTotal net enrolment ratio in primary education,* 1990/1991, 1998/1999 and2004/2005 (Percentage)Sub-Saharan Africa199154571999702005Oceania758178The net enrolment ratio in primary education inthe developing regions increased to 88 per cent inthe school year 2004/2005, up from 80 per centin 1990/1991. Two thirds of the increase occurredsince 1999. Although sub-Saharan Africa has madesignificant progress over the last few years, it still trailsbehind other regions, with 30 per cent of its children ofprimary school age out of school. A strong push will beneeded over the next few years to enrol all children inschool and to fulfil their right to a quality education.primary school age in rural areas of the developing world are out of school,compared with 18 per cent of children in the same age group living in cities.Girls are still excluded from education more often than boys, a pattern thatis particularly evident in Western and Southern Asia.Girls and children from pooreror rural families are least likely toattend schoolNet school attendance in primary school by children of official age andby children of secondary school age in all developing regions, 2005(Percentage)Children of primary school age out of school, bysex, place of residence and household wealth, 2005(Percentage)100908083Boys80Girls706040Western Asia373581One child in five who is old enough to attendsecondary school is still enrolled in primaryschool504085313086CIS, Europe3125913020252110832090Southern Asia1520172074905South-Eastern Asia9409294BoysGirlsUrbanRuralRichest Fourth20%ThirdSecond Poorest20%CIS, Asia899394Eastern Asia999995Northern Africa829095Latin America & the Caribbean879497Developing regionsChildren of primary school ageattending primary schoolChildren of secondary school ageattending primary school12108101817Progress has been made in reducing the number ofchildren out of school. Still, the number is unacceptablyhigh. Based on enrolment data, about 72 millionchildren of primary school age were not in school in2005; 57 per cent of them were girls. As high as thisnumber seems, surveys show that it underestimatesthe actual number of children who, though enrolled, arenot attending school. Moreover, neither enrolment norattendance figures reflect children who do not attendschool regularly. To make matters worse, official dataare not usually available from countries in conflict orpost-conflict situations. If data from these countrieswere reflected in global estimates, the enrolmentpicture would be even less optimistic.When many children entering school are under or over the official age forenrolment, the net enrolment ratios for primary school do not accuratelyreflect the situation of children in school. Surveys indicate that attendanceby over-age children is very common, especially in some regions. In subSaharan Africa, for example, more children of secondary school age areattending primary school than secondary school. Though late enrolment isbetter than not enrolling at all, it represents a challenge for the educationsystem and reflects the difficulties families face in sending their childrento school. Late enrolment also puts children at a disadvantage by causingpotential learning problems and lessening opportunities to advance to ahigher level of education. Where the information is available, data showthat children who start school at least two years later than the official ageare more likely to be from poorer households and have mothers with noformal education.80The children most likely to drop out of school or to notattend at all are those from poorer households or livingin rural areas. For example, nearly a third of children of838801020406080100*Number of pupils of the theoretical school-age group for primary education, enrolled either in primary orsecondary education, expressed as a percentage of the total population in that age group.11
THE MILLENNIUM DEVELOPMENT GOALS REPORT 2007UNITED NATIONSGoal 3Promotegender equalityand empowerwomenWomen’s labour is more likely than men’s to be unpaidTARGETEliminate gender disparity in primary and secondaryeducation preferably by 2005 and in all levels of education no later than 2015Share of women in total employment by job status,1990-2005 (Percentage)Contributing unpaid family workers4060Doors are opening slowly for women in thelabour marketEmployersEmployees in non-agricultural wage employment who are women, 1990and 2005 (Percentage)Total employment7822Employees40605941Southern Asia013204060Northern Africa2020Women gain ground politically, though men still wield control19902005Western AsiaShare of women in single or lower houses ofparliament, 1990 and 2007 (Percentage)1621Sub-Saharan Africa1323OceaniaWestern Asia2853819908South-Eastern Asia2007Northern Africa383398Eastern AsiaCIS *38Encouraging signs, however, are coming from the Arab States. In 2006,for the first time, both women and men ran for election in Kuwait, wherewomen obtained 2 parliamentary seats, and in the United Arab Emirates,where they won 23 per cent of seats. In Bahrain, a woman was elected tothe lower house of parliament for the first time in that nation’s history.1241Southern AsiaLatin America & the Caribbean6371342Sub-Saharan AfricaDeveloped regions744South-Eastern AsiaCIS10491751Eastern AsiaWorld20361939102030Worldwide, women’s entry into political leadership positions is alsowidening. As of March 2007, 35 women were presiding officers inparliament – more than ever before – including, for the first time, in Gambia,Israel, Swaziland, Turkmenistan and the United States. In contrast, there isno clear positive trend in the number of women in the highest positions ofstate or government. Thirteen women were heads of state or government in2006, compared to 9 in 2000 and 12 in 1995. A record number of womentook up these top positions in 2006 – six in all – in Chile, Jamaica, Liberia,the Republic of Korea and Switzerland, and as acting president in Israel.17470Women’s political participation is growing, albeit slowly. Globally, as ofJanuary 2007, women represented 17 per cent of single and lower housesof parliament, up from 13 per cent in 1990. However, women representedat least 30 per cent of parliamentarians in only 19 countries. Rwanda is stillleading the way, and is close to parity with 49 per cent of parliamentaryseats occupied by women, followed by Sweden and Costa Rica, wherewomen’s representation is 47 and 39 per cent, respectively. At the otherend of the spectrum, women lawmakers are absent altogether in somecountries. In 2006 elections in the Solomon Islands and Tuvalu, no womenwere elected to the lower houses of parliament.Oceania28Latin America & the Caribbean40501260Women’s participation in paid, non-agricultural employment has continuedto increase slowly. The greatest gains are in some of the regions wherewomen have the least presence in the labour market – in SouthernAsia, Western Asia and Oceania. In Northern Africa, where women’sparticipation is also low, progress has been insignificant. Only one in fivepaid employees in that region is a woman, a situation that has remainedunchanged for the last 15 years. In other regions, women are slowly gainingaccess to paid employment at a level on par with men, or, in the case of theCIS, exceeding it.12100MenWomen1880Wage employment in most of Africa and in manyparts of Asia and Latin America is concentratedin urban areas. Outside cities and towns, mostemployment is in agriculture, and mainly forfamily subsistence. Women in developing regionsare more likely than men to work in agriculture,and as contributing but unpaid family workers.Worldwide, over 60 per cent of unpaid familyworkers are women – meaning that womencontinue to lack access to job security and socialprotection.20Developed regions1622World13170510*Data for 1990 are not available for the CIS.152025A number of factors are at play in determining women’s politicalrepresentation – including political
school in the developing world. Enrolment in primary education grew from 80 per cent in 1991 to 88 per cent in 2005. Most of this progress has taken place since 1999. Women's political participation has been growing, albeit slowly. Even in countries where previously only men were allowed to stand for political election, women now have a