Transcription
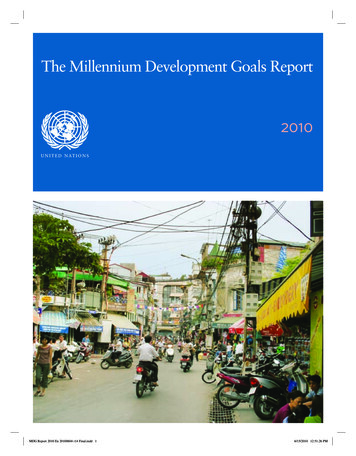
The Millennium Development Goals Report2010U N I T E D N AT I O N SMDG Report 2010 En 20100604 r14 Final.indd 16/15/2010 12:51:26 PM
UNITED NATIONSThis report is based on a master set of data that has been compiled by an Inter-Agency and ExpertGroup on MDG Indicators led by the Department of Economic and Social Affairs of the UnitedNations Secretariat, in response to the wishes of the General Assembly for periodic assessment ofprogress towards the MDGs. The Group comprises representatives of the international organizationswhose activities include the preparation of one or more of the series of statistical indicators that wereidentified as appropriate for monitoring progress towards the MDGs, as reflected in the list below. Anumber of national statisticians and outside expert advisers also contributed.INTERNATIONAL LABOUR ORGANIZATIONFOOD AND AGRICULTURE ORGANIZATION OF THE UNITED NATIONSUNITED NATIONS EDUCATIONAL, SCIENTIFIC AND CULTURAL ORGANIZATIONCover InsideUNITED NATIONS INDUSTRIAL DEVELOPMENT ORGANIZATIONWORLD HEALTH ORGANIZATIONTHE WORLD BANKINTERNATIONAL MONETARY FUNDINTERNATIONAL TELECOMMUNICATION UNIONECONOMIC COMMISSION FOR AFRICAECONOMIC COMMISSION FOR EUROPEECONOMIC COMMISSION FOR LATIN AMERICA AND THE CARIBBEANECONOMIC AND SOCIAL COMMISSION FOR ASIA AND THE PACIFICECONOMIC AND SOCIAL COMMISSION FOR WESTERN ASIAJOINT UNITED NATIONS PROGRAMME ON HIV/AIDSUNITED NATIONS CHILDREN’S FUNDUNITED NATIONS CONFERENCE ON TRADE AND DEVELOPMENTUNITED NATIONS DEVELOPMENT FUND FOR WOMENUNITED NATIONS DEVELOPMENT PROGRAMMEUNITED NATIONS ENVIRONMENT PROGRAMMEUNITED NATIONS FRAMEWORK CONVENTION ON CLIMATE CHANGEUNITED NATIONS HIGH COMMISSIONER FOR REFUGEESUNITED NATIONS HUMAN SETTLEMENTS PROGRAMMEUNITED NATIONS POPULATION FUNDINTERNATIONAL TRADE CENTREINTER-PARLIAMENTARY UNIONORGANISATION FOR ECONOMIC CO-OPERATION AND DEVELOPMENTWORLD TRADE ORGANIZATION2MDG Report 2010 En 20100604 r14 Final.indd 26/15/2010 12:51:29 PM
THE MILLENNIUM DEVELOPMENT GOALS REPORT 2010The MillenniumDevelopment GoalsReport 2010U N I T E D N AT I O N SN E W Y O R K , 20103MDG Report 2010 En 20100604 r14 Final.indd Sec1:36/15/2010 12:51:29 PM
UNITED NATIONS4MDG Report 2010 En 20100604 r14 Final.indd Sec1:46/15/2010 12:51:29 PM
THE MILLENNIUM DEVELOPMENT GOALS REPORT 2010ForewordThe Millennium Declaration in 2000 was a milestonein international cooperation, inspiring developmentefforts that have improved the lives of hundreds ofmillions of people around the world. Ten years later,world leaders will gather again at the United Nationsin New York to review progress, assess obstaclesand gaps, and agree on concrete strategies andactions to meet the eight Millennium DevelopmentGoals by 2015.The Goals represent human needs and basic rightsthat every individual around the world should beable to enjoy—freedom from extreme poverty andhunger; quality education, productive and decentemployment, good health and shelter; the right ofwomen to give birth without risking their lives; and aworld where environmental sustainability is a priority,and women and men live in equality. Leaders alsopledged to forge a wide-ranging global partnershipfor development to achieve these universalobjectives.This report shows how much progress has beenmade. Perhaps most important, it shows thatthe Goals are achievable when nationally owneddevelopment strategies, policies and programmesare supported by international development partners.At the same time, it is clear that improvements inthe lives of the poor have been unacceptably slow,and some hard-won gains are being eroded by theclimate, food and economic crises.The world possesses the resources and knowledgeto ensure that even the poorest countries, and othersheld back by disease, geographic isolation or civilstrife, can be empowered to achieve the MDGs.Meeting the goals is everyone’s business. Fallingshort would multiply the dangers of our world – frominstability to epidemic diseases to environmentaldegradation. But achieving the goals will put us ona fast track to a world that is more stable, more just,and more secure.Billions of people are looking to the internationalcommunity to realize the great vision embodied in theMillennium Declaration. Let us keep that promise.Ban Ki-moonSecretary-General, United Nations3MDG Report 2010 En 20100604 r14 Final.indd Sec2:36/15/2010 12:51:31 PM
UNITED NATIONSOverviewKeeping the promiseFive years from the target date for the MillenniumDevelopment Goals, leaders from around the worldwill be gathering at the United Nations to undertake acomprehensive review of progress and together chart acourse for accelerated action on the MDGs between nowand 2015.Many countries are moving forward, including some of thepoorest, demonstrating that setting bold, collective goalsin the fight against poverty yields results. For every life thathas benefited from the establishment of a quantitative,time-bound framework of accountability, the MDGs havemade a real difference.But unmet commitments, inadequate resources, lack offocus and accountability, and insufficient dedication tosustainable development have created shortfalls in manyareas. Some of these shortfalls were aggravated by theglobal food and economic and financial crises.Nevertheless, the data and analysis on the followingpages provide clear evidence that targeted interventions,sustained by adequate funding and political commitment,have resulted in rapid progress in some areas. In others, thepoorest groups, those without education or living in moreremote areas, have been neglected and not provided theconditions to improve their lives.Building on successesThe collective efforts towards achievement of the MDGshave made inroads in many areas. Encouraging trendsbefore 2008 had put many regions on track to achieve atleast some of the goals. The economic growth momentumin developing regions remains strong and, learning from themany successes of even the most challenged countries,achieving the MDGs is still within our grasp: Progress on poverty reduction is still being made,despite significant setbacks due to the 2008-2009economic downturn, and food and energy crises. Thedeveloping world as a whole remains on track to achievethe poverty reduction target by 2015. The overall povertyrate is still expected to fall to 15 per cent by 2015, whichtranslates to around 920 million people living under theinternational poverty line—half the number in 1990. Major advances have been made in getting children intoschool in many of the poorest countries, most of them insub-Saharan Africa. Remarkable improvements in key interventions—formalaria and HIV control, and measles immunization,for example—have cut child deaths from 12.5 million in1990 to 8.8 million in 2008. Between 2003 and 2008, the number of peoplereceiving antiretroviral therapy increased tenfold—from400,000 to 4 million—corresponding to 42 per cent ofthe 8.8 million people who needed treatment for HIV. Major increases in funding and a stronger commitmentto control malaria have accelerated delivery of malariainterventions. Across Africa, more communities arebenefiting from bed net protection and more childrenare being treated with effective drugs. The rate of deforestation, though still alarmingly high,appears to have slowed, due to tree-planting schemescombined with the natural expansion of forests. Increased use of improved water sources in ruralareas has narrowed the large gap with urban areas,where coverage has remained at 94 per cent—almostunchanged since 1990. However, the safety of watersupplies remains a challenge and urgently needs to beaddressed. Mobile telephony continues to expand in the developingworld and is increasingly being used for m-banking,disaster management and other non-voice applicationsfor development. By the end of 2009, cellularsubscriptions per 100 people had reached the 50 percent mark.Bridging the gapsThough progress has been made, it is uneven. And withouta major push forward, many of the MDG targets are likelyto be missed in most regions. Old and new challengesthreaten to further slow progress in some areas or evenundo successes achieved so far.The most severe impact of climate change is being feltby vulnerable populations who have contributed least tothe problem. The risk of death or disability and economicloss due to natural disasters is increasing globally and isconcentrated in poorer countries. Armed conflict remainsa major threat to human security and to hard-won MDGgains. Large populations of refugees remain in campswith limited opportunities to improve their lives. In 2009,42 million people had been displaced by conflict orpersecution, four fifths of them in developing countries.The number of people who are undernourished hascontinued to grow, while slow progress in reducing theprevalence of hunger stalled—or even reversed itself—insome regions between 2000-2002 and 2005-2007. Aboutone in four children under the age of five are underweight,mainly due to lack of food and quality food, inadequatewater, sanitation and health services, and poor care andfeeding practices.An estimated 1.4 billion people were still living in extremepoverty in 2005. Moreover, the effects of the global financialcrisis are likely to persist: poverty rates will be slightlyhigher in 2015 and even beyond, to 2020, than they wouldhave been had the world economy grown steadily at itspre-crisis pace.Gender equality and the empowerment of women are at theheart of the MDGs and are preconditions for overcomingpoverty, hunger and disease. But progress has beensluggish on all fronts—from education to access to politicaldecision-making.4MDG Report 2010 En 20100604 r14 Final.indd Sec2:46/15/2010 12:51:31 PM
THE MILLENNIUM DEVELOPMENT GOALS REPORT 2010Achieving the MDGs will also require increased attentionto those most vulnerable. Policies and interventions willbe needed to eliminate the persistent or even increasinginequalities between the rich and the poor, between thoseliving in rural or remote areas or in slums versus better-offurban populations, and those disadvantaged by geographiclocation, sex, age, disability or ethnicity: In all developing regions, children in rural areas aremore likely to be underweight than urban children. InLatin America and the Caribbean and parts of Asia, thisdisparity increased between 1990 and 2008. The gap between the richest and the pooresthouseholds remains enormous. In Southern Asia, 60 percent of children in the poorest areas are underweightcompared to 25 per cent of children in the richesthouseholds.Towards 2015The Millennium Declaration represents the most importantpromise ever made to the world’s most vulnerable people.The MDG framework for accountability derived from theDeclaration has generated an unprecedented level ofcommitment and partnership in building decent, healthierlives for billions of people and in creating an environmentthat contributes to peace and security.The Millennium Development Goals are still attainable.The critical question today is how to transform the pace ofchange from what we have seen over the last decade intodramatically faster progress. The experience of these lastten years offers ample evidence of what works and hasprovided tools that can help us achieve the MDGs by 2015.The Millennium Development Goals summit in Septemberwill be an opportunity for world leaders to translate thisevidence into a concrete agenda for action. In developing regions overall, girls in the poorest 20 percent of households are 3.5 times more likely to be outof school than girls in the richest households and fourtimes more likely to be out of school than boys from therichest households. Even in countries close to achieving universal primaryeducation, children with disabilities are the majority ofthose excluded. Maternal health is one of the areas in which the gapbetween rich and poor is most conspicuous. Whilealmost all births are attended by skilled health personnelin the developed countries, less than half of womenreceive such care when giving birth in parts of thedeveloping world.SHA ZUKANGUnder-Secretary-General for Economic and Social Affairs Disparities in access to care during pregnancy are alsostriking, with women in the richest households 1.7 timesmore likely to visit a skilled health worker at least oncebefore birth than the poorest women. Lack of education is another major obstacle toaccessing tools that could improve people’s lives. Forinstance, poverty and unequal access to schoolingperpetuate high adolescent birth rates, jeopardizing thehealth of girls and diminishing their opportunities forsocial and economic advancement. Contraceptive use is four times higher among womenwith a secondary education than among those with noeducation. For women in the poorest households andamong those with no education, negligible progress wasseen over the last decade. Only about half of the developing world’s populationare using improved sanitation, and addressingthis inequality will have a major impact on severalof the MDGs. Disparities between rural and urbanareas remain daunting, with only 40 per cent of ruralpopulations covered. And while 77 per cent of thepopulation in the richest 20 per cent of households useimproved sanitation facilities, the share is only 16 percent of those in the poorest households.5MDG Report 2010 En 20100604 r14 Final.indd Sec2:56/15/2010 12:51:31 PM
UNITED NATIONSGoal 1Eradicateextremepoverty andhungerTARGETHalve, between 1990 and 2015, the proportion of peoplewhose income is less than 1 a dayThe global economic crisis has slowedprogress, but the world is still on track tomeet the poverty reduction targetProportion of people living on less than 1.25 a day,1990 and 2005 (Percentage)Sub-Saharan Africa5851Southern Asia493919902005Southern Asia, excluding India452015 Target31CIS, Asia619South-Eastern Asia3919Eastern Asia6016Latin America & the Caribbean118Western Asia26Northern Africa53Transition countries of South-Eastern Europe0.11CIS, Europe20.3Developing regions4627010203040506070Robust growth in the first half of the decade reduced thenumber of people in developing regions living on less than 1.25 a day from 1.8 billion in 1990 to 1.4 billion in 2005,while the poverty rate dropped from 46 per cent to 27 percent. The global economic and financial crisis, which beganin the advanced economies of North America and Europein 2008, sparked abrupt declines in exports and commodityprices and reduced trade and investment, slowing growthin developing countries. Nevertheless, the momentum ofeconomic growth in developing countries is strong enoughto sustain progress on the poverty reduction target. Theoverall poverty rate is still expected to fall to 15 per cent by6MDG Report 2010 En 20100604 r14 Final.indd Sec2:66/15/2010 12:51:31 PM
THE MILLENNIUM DEVELOPMENT GOALS REPORT 20102015, indicating that the Millennium DevelopmentGoal (MDG) target can be met. This translatesinto around 920 million people living under theinternational poverty line—half the number in 1990.Newly updated estimates from the World Banksuggest that the crisis will leave an additional50 million people in extreme poverty in 2009and some 64 million by the end of 2010 relativeto a no-crisis scenario, principally in subSaharan Africa and Eastern and South-EasternAsia. Moreover, the effects of the crisis arelikely to persist: poverty rates will be slightlyhigher in 2015 and even beyond, to 2020, thanthey would have been had the world economygrown steadily at its pre-crisis pace.Prior to the crisis, the depth of povertyhad diminished in almost every regionPoverty gap ratio at 1.25 a day, 1990 and 2005(Percentage)Sub-Saharan Africa2621Southern Asia141990200510Southern Asia, excluding India148CIS, Asia25South-Eastern AsiaThe fastest growth and sharpest reductionsin poverty continue to be recorded in EasternAsia. Poverty rates in China are expected tofall to around 5 per cent by 2015. India, too,has contributed to the large reduction in globalpoverty. Measured at the 1.25 a day povertyline, poverty rates there are expected to fallfrom 51 per cent in 1990 to 24 per cent in 2015,and the number of people living in extremepoverty will likely decrease by 188 million. Alldeveloping regions except sub-Saharan Africa,Western Asia and parts of Eastern Europe andCentral Asia are expected to achieve the MDGtarget. These shortfalls reflect slow growthin sub-Saharan Africa in the 1990s and thetransition from planned to market economiesthat saw poverty increase, albeit from very lowlevels, in some countries of Eastern Europeand the former Soviet Union.114Eastern Asia214Latin America & the Caribbean43Western Asia12Northern Africa11Transition countries of South-Eastern Europe 0.10.2CIS, Europe10.1Developing regions1680The lack of good quality surveys carried outat regular intervals and delays in reportingsurvey results continue to hamper themonitoring of poverty. Gaps are particularlyacute in sub-Saharan Africa, where morethan half of countries lack sufficient datato make comparisons over the full range ofthe MDGs, and among small island statesin the Pacific and the Caribbean. Surveysdeliver important information—not just in thechange in average income or consumption,but also in its distribution. This year’s povertyestimates integrate 31 new household surveys.Combining these new surveys with last year’sgrowth forecast suggests a 0.5 percentagepoint decline (after taking into account theeffect of the financial crisis) in the aggregatepoverty headcount index in 2015—from 15.5per cent to 15.0 per cent. Only with more timelydata can accurate reports on progress towardsthe MDGs be provided.102030The poverty gap measures the shortfall in incomes ofpeople living below the poverty line. While the internationalpoverty line is set at a level typical of very poor countries,many people live on even less than that amount. Economicgrowth and improvements in the distribution of income orconsumption reduce the depth of poverty. Since 1990, thedepth of poverty has decreased in all regions except WesternAsia. In 2005, the average income of people living belowthe poverty line stood at 0.88. The depth of poverty wasgreatest in sub-Saharan Africa, but has fallen since 1999 toreach the level of Eastern Asia in 1990.7MDG Report 2010 En 20100604 r14 Final.indd Sec2:76/15/2010 12:51:33 PM
UNITED NATIONSInvestments in disaster riskreduction can yield long-termbenefits, including progresson the MDGsThe risk of death or disability andeconomic loss resulting from naturaldisasters is increasing globally and isconcentrated in poorer countries. Reducingsuch risk can have multiplier effects thatcan accelerate achievement of the MDGs.The horrific loss of life from earthquakesin Haiti, Chile and China, and floods inBrazil, underscore the need to make thebuilt environment more resilient in the faceof potential hazards—both seismic andclimatic (or weather-related).Urbanization, climate change andecosystem degradation are increasing thetoll of natural disasters, and countries leastable to reduce their risk are suffering themost. An estimated 97 per cent of globalmortality risk from natural disasters isfaced by populations in low- and lowermiddle-income countries, which alsoexperience higher economic losses relativeto the size of their economies. From thestart of 2008 through March 2010, 470,000people were reportedly killed as a result ofnatural disasters; economic losses wereestimated to be more than 262 billion (notincluding 2010). Small island developingstates and landlocked developing countriestogether constitute 60 per cent and 67per cent, respectively, of the countriesconsidered to have a high or very higheconomic vulnerability to natural hazards.Experience from countries has shownthat investments in disaster risk reductionproduce long-term benefits—from reducedfuture losses and avoided reconstructionto co-benefits such as more robustlivelihoods, resilient communities, andprotective and productive ecosystems.In Peru, incorporation of risk reductioninto development has led to benefits thatexceeded costs by as much as 37 times.When China spent 3.15 billion on reducingthe impact of floods between 1960 and2000, it averted losses estimated at 12billion.TARGETAchieve, full and productive employment and decentwork for all, including women and young peopleDeterioration of the labour market,triggered by the economic crisis, hasresulted in a decline in employmentEmployment-to-population ratio, 1998, 2008 and2009 preliminary estimatesEastern Asia747070Oceania199820082009*666667South-Eastern Asia666666Sub-Saharan Africa646565Latin America & the Caribbean586160CIS535857Southern Asia575655Transition countries of South-Eastern Europe534948Northern Africa444646Western Asia474644Developed regions565755Developing regions63626201020304050607080* Data for 2009 are preliminary.The bursting of the housing bubble in the United States in2007 and subsequent paralysis of the global financial systembecame an economic and labour market crisis that plaguedthe world throughout 2009. The cascading crisis crippledeconomies, reduced enterprise capacities and forced millionsof people out of work. Many workers resorted to vulnerableforms of employment as the ranks of the working poor swell.8MDG Report 2010 En 20100604 r14 Final.indd Sec2:86/15/2010 12:51:33 PM
THE MILLENNIUM DEVELOPMENT GOALS REPORT 2010As the crisis deepened, governmentstimulus measures began to curb the slidein economic activity and lessen the impactof global job losses. The coordinated effortsof countries responding to the crisis havebeen instrumental in averting even greatersocial and economic hardships. However,labour market conditions have continued todeteriorate in many countries and will likelythreaten much of the progress made over thelast decade towards decent work.The economic deterioration resulted in asharp drop in employment-to-populationratios. In addition, labour productivitydeclined in 2009. In most regions, thedecrease in gross domestic product waseven greater than the decline in employment,resulting in diminishing output per worker.Preliminary estimates indicate a negativegrowth in output per worker in all regionsexcept Northern Africa, Eastern Asia andSouthern Asia. The largest fall in output perworker was in CIS countries in Europe, thetransition countries of South-Eastern Europeand in Latin America and the Caribbean.Declining labour output contributes to poorerworking conditions, worsening the plight ofworkers in regions where labour productivitywas already low before the economic crisis,as in sub-Saharan Africa.As jobs were lost, more workers havebeen forced into vulnerable employmentProportion of own-account and contributing familyworkers in total employment, 1998, 2008 and2009 second scenario (Percentage)Oceania747879Southern Asia767780Sub-Saharan Africa757782South-Eastern Asia636161199820082009*Eastern Asia535362CIS, Asia414744Northern Africa313534Latin America & the Caribbean353132Transition countries of South-Eastern Europe322429Western Asia392728CIS, Europe8910Developed regions111011Developing regions5960010203040506065708090*Forecasts for 2009 are based on the International Labour Organization’ssecond scenario. Details are available at mdgs.un.orgThe positive downward trend in vulnerable employment wasinterrupted by deteriorating conditions on the labour marketfollowing the financial crisis. For many wage and salariedworkers who lost their jobs, as well as first-time job seekerswho entered the labour market in the midst of the crisis, ownaccount and unpaid family work are options of last resort.Those engaged in ‘vulnerable employment’, defined as thesum of own-account workers and contributing family workers,are not typically bound by formal work arrangements. Theyare therefore more likely to lack benefits associated withdecent employment, such as adequate social security9MDG Report 2010 En 20100604 r14 Final.indd Sec2:96/15/2010 12:51:34 PM
UNITED NATIONSand recourse to effective mechanisms forsocial dialogue. Vulnerable employment isoften characterized by inadequate earnings,low productivity and substandard workingconditions that undermine fundamental labourrights.Prior to the economic crisis, over threequarters of workers in Oceania, SouthernAsia and sub-Saharan Africa were without thesecurity that wage and salaried jobs couldprovide. The crisis is likely to have furtherincreased the number of workers engagedin vulnerable employment in these regions in2009. The International Labour Organization(ILO) estimates* the global vulnerableemployment rate in 2009 to be between 49per cent and 53 per cent, which translatesinto 1.5 billion to 1.6 billion people who areworking on their own or as unpaid familyworkers worldwide.Since the economic crisis, more workersfind themselves and their families livingin extreme povertyProportion of employed people living below 1.25 a day, 1998, 2008 and 2009 secondscenario (Percentage)Sub-Saharan Africa675864Southern Asia554451Oceania199820082009*454650South-Eastern Asia452328CIS, Asia261921* Details are available at http://mdgs.un.orgEastern Asia521113Western Asia8812Latin America & the Caribbean1378Northern Africa634Transition countries of South-Eastern Europe10.40.6CIS, Europe40.10.2Developing regions48263101020304050607080*Data for 2009 are based on the ILO’s second scenario.Details are available at mdgs.un.orgThe ‘working poor’ are defined as those who are employedbut live in households where individual members subsist onless than 1.25 a day. Most of these workers are engagedin jobs that lack the social protection and safety nets thatguard against times of low economic demand, and they areoften unable to generate sufficient savings to offset hardtimes. Since vulnerable employment is often characterizedby low productivity work, and the global financial crisis hasresulted in declining output per worker, working poverty islikely to have increased as well. The small decreases in thepercentage of working poor in 2009 that would result from a10MDG Report 2010 En 20100604 r14 Final.indd Sec2:106/15/2010 12:51:34 PM
THE MILLENNIUM DEVELOPMENT GOALS REPORT 2010Halve, between 1990 and 2015, the proportion of peoplewho suffer from hungerHunger may have spiked in 2009, one ofthe many dire consequences of the globalfood and financial crisesProportion of people who are undernourished in thedeveloping regions (Percentage) and number ofundernourished people (Millions), 1990-1992,1995-1997, 2000-2002 and 2005-2007150025Number of undernourished peoplePercentage of undernourished people1200MillionsThe largest negative impact is most likelyto be seen in sub-Saharan Africa, SouthernAsia, South-Eastern Asia and Oceania, whereextreme poverty among the employed mayhave increased by four percentage points ormore in the second scenario. These estimatesreflect the fact that, prior to the crisis, manyworkers in these regions were only slightlyabove the poverty line. In the case of subSaharan Africa, the large majority of workers(63.5 per cent) were at risk of falling below theextreme poverty line in this tagecontinuation of historical trends (scenario 1)are therefore not likely to have materialized.Rather, it is estimated that an additional 3.6per cent of the world’s workers were at riskof falling into poverty between 2008 and2009 (scenario 2), an alarming increase and asetback of many years of steady e 1990, developing regions have made some progresstowards the MDG target of halving the proportion ofpeople suffering from hunger. The share of undernourishedpopulations decreased from 20 per cent in 1990-1992 to 16per cent in 2005-2007, the latest period with available data.However, progress has stalled since 2000-2002. Overallprogress in reducing the prevalence of hunger has not beensufficient to reduce the number of undernourished people. In2005-2007, the last period assessed, 830 million people werestill undernourished, an increase from 817 million in 19901992.Food prices spiked in 2008 and falling income due to thefinancial crisis further worsened the situation. The Food andAgricultural Organization of the United Nations estimates thatthe number of people who were undernourished in 2008 maybe as high as 915 million and exceed 1 billion in 2009.11MDG Report 2010 En 20100604 r14 Final.indd Sec2:116/15/2010 12:51:34 PM
UNITED NATIONSProgress to end hunger hasbeen stymied in most regionsProportion of undernourished population,1990-1992, 2000-2002 and 2005-2007(Percentage)Though international food prices continued to decline inthe second half of 2008, consumer food price indexes rose.International food prices have not yet stabilized and threats ofnew food crises loom.Sub-Saharan Africa313026Southern Asia, excluding India2623231990-922000-022005-07Southern Asia2120212015 TargetSouth-Eastern AsiaPrices of staple foods remained high in 2009, after the initialfood crisis of 2008. At the same time, the incomes of poorhouseholds diminished because of higher unemploymentfollowing the economic downturn. Both crises contributed toa considerable reduction in the effective purchasing powerof poor consumers, who spend a substantial share of theirincome on basic foodstuffs.24Aggregate food availability globally was relatively goodin 2008 and 2009, but higher food prices and reducedemployment and incomes meant that the poor had lessaccess to that food.1714Oceania121613Eastern Asia, excluding China81312Eastern Asia181010Latin America & the Caribbean12109Western Asia587Northern Africa 5 5 5Developing regions20161605101520253035Before the onset of the food and financialcrises, a number of regions were well on theirway to halving, by 2015, the proportion of theirpopulation that were undernourished. SouthEastern Asia, which was already close to thetarget in 2005-2007 made additional progress,as did Latin America and
THE MILLENNIUM DEVELOPMENT GOALS REPORT 2010 3 The Millennium Development Goals Report 2010 UNITED NATIONS NEW YORK, 2010 MDG Report 2010 En 20100604 r14 Final.indd Sec1:3 6/15/2010 12:51:29 PM