Transcription
Supplier Risk System(SRS) ModuleUser Guide30 JAN 20221
TABLE of CONTENTSFOREWORD . 4REFERENCES . 4INTRODUCTION . 51 BACKGROUND . 72 MAIN PDREP APPLICATION SCREEN . 82.1 Finding the Fly Outs . 92.2 Selecting the Fly Outs . 92.3 SRS Access Levels . 102.4 CUI and Source Selection Notice . 103 SRS OVERVIEW . 113.1 Basic Functionality . 113.2 Index Values and Colors . 124 SRS SEARCH . 134.1 Searching for Suppliers . 134.1.1 Single CAGE Search . 134.1.2 Filtered CAGE Search . 144.1.3 Manual CAGE List Search . 144.2 Search Favorites . 144.2.1 Saving a Favorite Search . 154.2.2 Running, Updating, or Deleting a Favorite Search . 154.3 Search Results . 155 CAGE OVERALL PERFORMANCE INDEX ASSESSMENT. 165.1 CAGE Details . 165.2 Performance Index Breakdown . 175.2.1 Performance Index by Category . 185.2.2 CAR, PQDR, and PAS Records in Category Details . 205.2.3 Performance Index by NAICS, Weapon System, FSC . 216 SRS REPORTS . 216.1 Reports Landing Page . 216.2 Saved Reports . 226.3 Report Types. 236.3.1 Business Analysis Performance Index Report . 246.3.2 CAGE, Weapon System, NAICS, and FSC Performance Index Reports. 246.3.3 Parent/Child CAGE Report . 246.3.4 Operational Unit CAGE Report . 256.3.5 Trend Analysis Report . 262
7 ADDITIONAL SRS FUNCTIONALITY . 287.1 SRS Algorithm. 288 SUMMARY . 299 APPENDIX 1: DATA DICTIONARY . 30Click link to navigate to a specific section of the guide3
FOREWORDThis user guide provides information about the Product Data Reporting and EvaluationProgram - Automated Information System (PDREP-AIS) and is intended to assist userswith the Supplier Risk System (SRS) module functionality. This document does notcover specific policy or procedure and is designed to work in concurrence with existingprocesses. This guide does not replace or amend any Department of Defense (DoD)instructions, regulations, and/or policies. Revisions to this guide are made afterapplication changes have been implemented. Date of last amendment is located on thetitle page. Though this documents is accessible to all users, its content is intended forthose individuals with module access. Module access is granted on a case by case andneed to know basis.NOTE: The data contained within this guide is NOT real data and it is NOT to be usedfor business purposes. The material presented is intended to serve as an example onlyand was taken from a test system.REFERENCES SECNAVINST 4855.5CProduct Data Reporting and Evaluation Program (PDREP)NAVSO P3683DProduct Data Reporting and Evaluation Program (PDREP)DCMA Instruction 2303SurveillanceDCMA Manual 2303-01Surveillance - Resource Page found here (DCMA Members Only)4
INTRODUCTIONThis document is intended to guide personnel in the use of Product Data Reporting andEvaluation Program – Automated Information System (PDREP-AIS) Supplier RiskSystem (SRS) module.The PDREP-AIS is accessible via the Product Data Reporting and Evaluation Programhome page: https://www.pdrep.csd.disa.mil/Getting Access First Time UsersFirst time users are required to submit an on-line PDREP-AIS SystemAuthorization Access Request (SAAR) form. Instructions are available onthe PDREP home page as linked above. Click on the Request Access linkfor instructions on filling out an access request form. When requesting anaccount, ensure all fields indicated as mandatory are completely filled out.Mandatory fields are indicated by (M). The application will not be acceptedif required information is missing. Existing PDREP UsersExisting PDREP users may request additional or updated accessprivileges by submitting an updated SAAR. To do this, log into thePDREP-AIS and hover over your name in the upper right corner of thepage and select ‘Access Change Request’. Update the SAAR and enter anarrative to describe requested changes, read and acknowledge the UserAgreement and click ‘Sign and Submit Account Change Request’ button tocomplete the submission.Contact usTo report an issue, ask a question, or submit suggestions for improvement to softwaremay be made by active users within PDREP-AIS by hovering over the ‘Help’ link on thePDREP-AIS main menu or selecting the web master email link located at the bottom ofevery PDREP-AIS webpage.Additional contact information is below if you do not have an active PDREP-AISaccount:5
NSLC Portsmouth Help DeskCommercial Phone: (207) 438-1690 / DSN 684-1690FAX: (207) 438-6535 / DSN 684-6535E-Mail: WEBPTSMH@navy.milMailing AddressNaval Sea Logistics Center PortsmouthBldg. 153, 2nd FloorPortsmouth Naval ShipyardPortsmouth, NH 03804-5000Additional Resources available on the NSLC Portsmouth HomepageIn order to aid PDREP-AIS users, reference these additional resources as needed:FAQ – On the PDREP website under References, the Frequently Asked Questionspage gives quick answers to the most commonly received inquiries. Your question(s)may be easily answered there.Guides & Manuals – This area of the PDREP website (under References) houses thePDREP-AIS’ technical documents. These comprehensive guides serve to offer directiveon operational tasks and enable users to pinpoint or problem solve without expertassistance. These manuals do not instruct on policy or process and are insteadstepwise instructions on using the PDREP-AIS application. Relevant process and policyare however referenced in the beginning of each of these manuals.Online Training – Computer-based distance learning may be accessed through theReference fly-out of the PDREP website. Instruction takes place remotely via instructorled directive, module simulation, video-conferencing, application demonstration, orrecorded lesson.FAQ, User Guides, and Online Training are also accessible within PDREP-AIS byhovering over the ‘Help’ link located at the top left of each application page.6
1 BACKGROUNDThe Product Data Reporting and Evaluation Program (PDREP) – Supplier Risk System(SRS) module is a modular-architecture enterprise data-mining tool with amultifunctional perspective. Developed initially by the Defense Contract ManagementAgency (DCMA), SRS has been developed in PDREP to allow both DCMA and nonDCMA users with access to use. The module is used to determine or adjust risk-basedsurveillance, providing users with acquisition insight into Quality, Delivery, Engineering(Technical, & Experience), Business, & Manufacturing/Production risks at a givencontractor’s facility. In addition, it calculates a performance index, using up to 36 monthsof supplier performance data, as a forecast of future risk. Algorithms used to calculatethe performance index are based on DCMA contract administration and surveillanceactivities at the place of performance, i.e. Commercial and Government Entity (CAGE).This information can then be shared with program offices/buying commands as aninformation source for non-procurement decision use.7
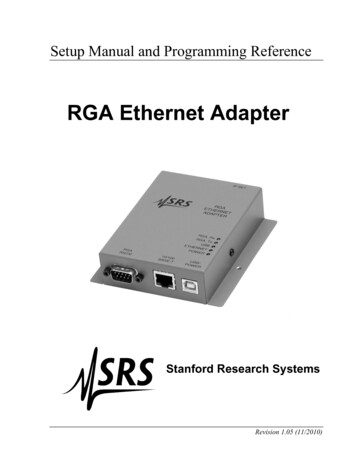
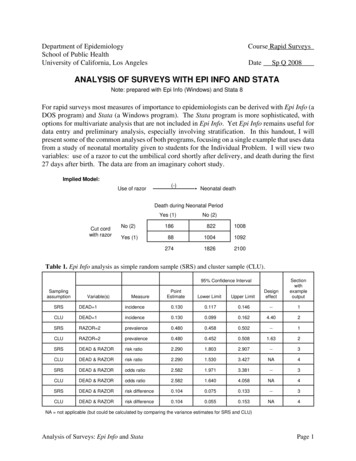
2 MAIN PDREP APPLICATION SCREENOnce you have logged in, the PDREP Home page will display (see Figure 2.1). Youmay not see all of the options listed depending on your level of access.*Please refer to PDREP User Access Request and Login Procedures or contact yourPDREP Coordinator for further clarification.Figure 2.18
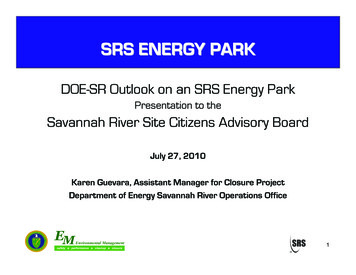
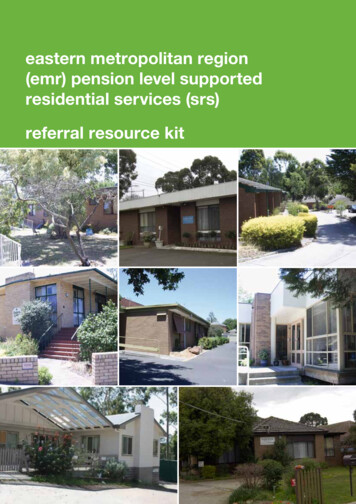
2.1 Finding the Fly OutsHover your mouse pointer over any PDREP Application, Search, or Report located onthe left portion of the screen and a list of sub-links for that selection will appear (SeeFigure 2.2).Figure 2.22.2 Selecting the Fly OutsSelecting either of the sub-links will allow the user to go directly to that page within theapplication (see Figure 2.2).9
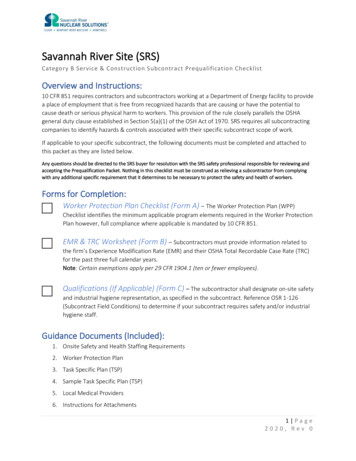
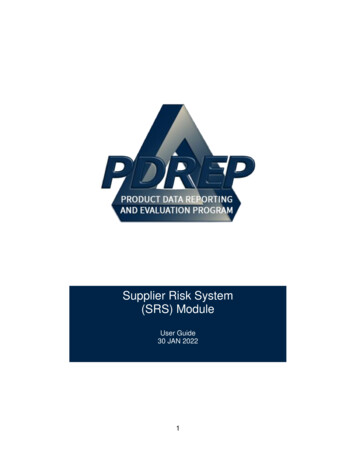
2.3 SRS Access LevelsSRS has two different access levels: Government and DCMA. Both roles can accessSRS Search and Reports, except only DCMA access users can run the Operational UnitCAGE Report.2.4 CUI and Source Selection NoticeThe first time a user selects Search or Reports from the SRS fly out, they will have toacknowledge the notice explaining that SRS content is CUI and not intended for sourceselection (see Figure 2.3).Figure 2.310
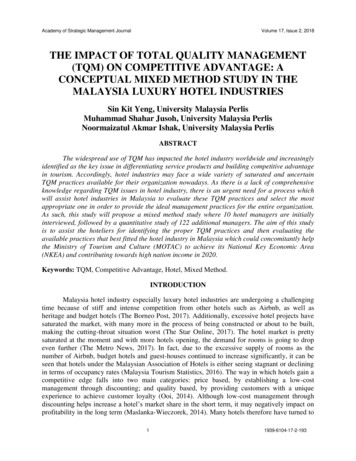
3 SRS OVERVIEW3.1 Basic FunctionalityThe SRS module consists primarily of search and results screens, where users specifyentity information, and then view Commercial and Government Entity (CAGE) profileswith calculated overall performance indexes. These overall performance indexesindicate risk associated with each CAGE and are captured for seven date ranges: Three Year Trendso 0-12 monthso 13-24 monthso 25-36 months Short and Long Term Performance Risko 0-6 monthso 0-18 monthso 0-24 monthso 0-36 monthsThe overall performance index values are influenced by the following categories: Quality Delivery Engineering, Technical, & Experience Business Manufacturing/ProductionSRS also includes a Reports section that provides additional standardized reports whichhelp users look at a larger industrial base.Reports Available Business Analysis CAGE Operational Unit Parent – Child CAGE Trend Analysis North American Industry Classification System (NAICS) Federal Supply Class (FSC) Weapon System Designator Code (WSDC)11
3.2 Index Values and ColorsPerformance index values range from 0-100, where a lower value indicates a higherrisk. In SRS, performance index values are displayed with corresponding colors (seeTable 3.1).ValueColor 70RedNo Contract Data&Failed Pre-Award Survey DataRed“Limited Data”70-79YellowNo Contract Data&No “U” PAS CategoryYellow“No Data”80-89Green90-95Purple96-100BlueTable 3.112
4 SRS SEARCH4.1 Searching for SuppliersFrom the Search screen, there are several ways to search suppliers. The followingsubsections refer to Figure 4.1.Figure 4.14.1.1 Single CAGE SearchThe simplest way to search for a supplier is to enter their CAGE code into the CAGEfield or use the Lookup CAGE button to search for a CAGE by the company name.13
4.1.2 Filtered CAGE SearchFor larger searches, enter a Weapon System Designator Code (WSDC), Department ofDefense Activity Address Code (DODAAC), or Unique Entity Identifier (UEI) to return allCAGE codes that are associated with those corresponding fields. The LookupDODAAC button can be used to search for DODAACs by name.4.1.3 Manual CAGE List SearchMultiple CAGE codes can be specified and searched at once by entering them into theCAGE list field as a comma separated list.4.2 Search FavoritesFrequently run searches can be saved to Favorites and will autofill the search optionswhen they are selected from the Favorites dropdown.Figure 4.214
4.2.1 Saving a Favorite SearchTo save a Favorite Search, enter the search criteria to be favorited, enter a FavoriteName, and select Add/Update Favorite.4.2.2 Running, Updating, or Deleting a Favorite SearchThe favorited search must first be selected from the Favorite Search dropdown. Oncethe search options are populated, the user can either (1) select Search to run thefavorite search, (2) enter new changes and select Add/Update Favorite to update thefavorite, or (3) select Delete Favorite to delete the search and remove it from the user’sFavorite Search dropdown.4.3 Search ResultsResults from the SRS Search will display on the same SRS Search screen belowsearch options and provide overall performance index values for seven date ranges inmonths (see Figure 4.3). Selecting the CAGE code from this results table will direct theuser to the individual CAGE Overall Performance Index Assessment screen where theresults can be drilled down further. The results table can be exported in Excel via thelink above the table. The export provides risk trend shown in Figure 3.3 and not detailedcontractor data. This information can be obtained in the CAGE Details screen (Figure4.1).Figure 4.315
5 CAGE OVERALL PERFORMANCE INDEX ASSESSMENTThe CAGE Overall Risk Assessment is a visual representation of risk likelihoodassociated with the CAGE searched. This page includes multiple trending views,functional input breakdowns, and industry performance indexes by WSDC, NAICS, andFSC.5.1 CAGE DetailsThe topmost section of the Overall Performance Index Assessment, the CAGE Detailsprovides a high-level view of the supplier (see Figure 5.1).Figure 5.1The SAM link provided in the Outside Data Inquiry field will direct the user tohttps://www.SAM.gov, and the DLA CAGE link will direct users to https://cage.dla.mil.These may provide the user with additional information to support in their risk analysis.16
5.2 Performance Index BreakdownBelow the CAGE Details, the user can drill down into specific date ranges to explore riskindex values by category (see Figure 5.2).Figure 5.217
5.2.1 Performance Index by CategoryFrom the Supplier Risk Performance Index table, the user can select each category toview all of the data elements that contribute to their respective indexes:Figure 5.3QualityFigure 5.4Delivery18
Figure 5.5Engineering, Technical & ExperienceFigure 5.6BusinessFigure 5.7Manufacturing/Production19
5.2.2 CAR, PQDR, and PAS Records in Category DetailsSeveral of these record types can be drilled down even further into individual records.These include Corrective Action Requests (CAR), Product Quality Deficiency Reports(PQDR), and Pre-Award Surveys (PAS).Corrective Action Requests: When selected, CAR counts will return a table of CARRCN, Functional Area, and Category (see Figure 5.8). Selecting a CAR RCN will directthe user to view the record in the CAR application in PDREP.NOTE: If you do not have access to view CARs, you will receive an error. You will needto request CAR View Access in order to view CAR records.Figure 5.8Product Quality Deficiency Reports: When selected, PQDR counts will return a table ofPQDR RCN, Contract Number, and Closed Date (see Figure 5.9). Selecting a PQDRRCN will direct the user to an HTML view of the PQDR SF-368 form.Figure 5.9Pre-Award Surveys: When selected, PAS counts will return a table of Survey RCN andContract Number (see Figure 5.10). Selecting a Survey RCN will take the user to theView Data page for the record in the Survey module of PDREP.Figure 5.1020
5.2.3 Performance Index by NAICS, Weapon System, FSCThis last portion of the CAGE Overall Performance Index Assessment provides theaverage performance index of all CAGE codes within their given NAICS, WSDC, orFSC code (see Figure 5.11).Figure 5.116 SRS REPORTS6.1 Reports Landing PageSelecting Reports from the SRS Fly-out menu will take the user to the reports screen(see Figure 6.1), where the user can specify filters and run reports to view severaldifferent visualizations of SRS data.21
Figure 6.16.2 Saved ReportsCustom reports can be saved by selecting search criteria, entering a Report Name andselecting the Save Report button. These reports can be accessed from the SavedReports dropdown, after which they can be run, updated and saved, or deleted.22
6.3 Report TypesThe majority of SRS Reports feature histogram bar charts, which count up the averageperformance indexes of all CAGE codes that meet the report filter criteria. These countsare then binned into different index value ranges: Below 70, 70-79, 80-89, 90-95, and96-100 (see Figure 6.2). All report types must be run over a specified date range. Allreport types, with the exception of the Operational Unit CAGE Report, can be filtered byregion, a list of CAGE codes separated by commas, a list of DODAACs separated bycommas, and/or Team Code.Figure 6.223
6.3.1 Business Analysis Performance Index ReportThe Business Analysis Performance Index Report is the broadest-purpose report type,allowing Weapon System, NAICS, and FSC to be used to filter CAGE codes (SeeFigure 6.1 and Figure 6.2). A date range is a mandatory field for this report to run.6.3.2 CAGE, Weapon System, NAICS, and FSC Performance IndexReportsThese four reports have a mandatory filter for their respective fields: CAGE list, WSDC,NAICS, and FSC. For example, the FSC Performance Index Report has a mandatoryfilter requirement for the FSC field (see Figure 6.3). All reports require input of a daterange for the report to run.Figure 6.36.3.3 Parent/Child CAGE ReportThe Parent/Child CAGE Report is a combined report that allows users to run two typesof reports. (1) Searching a list of Parent CAGE codes will return the counts of their ChildCAGE codes. (2) Searching a list of Child CAGE codes will return the counts of theirParent CAGE codes. This report also has the ability to filter by WSDC, NAICS, and FSC(see Figure 6.4).24
Figure 6.46.3.4 Operational Unit CAGE ReportThe Operational Unit CAGE Report is the largest report option available and onlyrequires date range as a filter (see Figure 6.5). This report returns the counts of allCAGE codes by their DCMA Command: Headquarters, International, Special Programs,Eastern Region, Central Region, Western Region, AIMO, and Cost and Pricing. Thisreport is restricted to the DCMA User access role.25
Figure 6.56.3.5 Trend Analysis ReportThe Trend Analysis Report offers a month-by-month view of performance index valuesfor CAGE codes that meet the filter criteria, which includes WSDC, NAICS, and FSC. Astarting and ending month and year selection is required to provide the date range onthis report (see Figure 6.6).26
Figure 6.6Each CAGE that is returned by this report is graphed as a line that plots the changes inperformance index from month to month over the given date range (see Figure 6.7).27
Figure 6.77 ADDITIONAL SRS FUNCTIONALITY7.1 SRS AlgorithmThe ability to adjust the algorithm that assigns performance index values within SRS isonly available to DCMA administrators.28
8 SUMMARYThis concludes the Supplier Risk System (SRS) user guide.Content provided within this document is maintained by the Product Data Reporting andEvaluation Program under the guidance of Naval Sea Logistics Center Portsmouth’sDeputy Functional Manager and the Automated Information System Manager.The SRS user guide is intended to be used as a technical reference document to assistusers with system navigation and basic operational functionality within PDREP-AIS.Questions, comments or concerns regarding the SRS module or this guide should bedirected to the PDREP Customer Support Desk.Contact information for the support desk is provided 207) 438-1690684-1690(207) 438-653529
9 APPENDIX 1: DATA DICTIONARYSRS Element NameCAGECompanyCMO DODAACStart DateEnd DateSmall BusinessZipPQDR CAT 1 DCMAPQDR CAT 2 DCMADescriptionSource ofDataContractor and Government Entity Code, used as anidentifier associated with companies.Name of the company associated with the CAGE Code.Contract Management Office DODAAC. Multiple CAGEcodes are associated with each CMO DODAAC.Beginning of date range used to calculate PerformanceIndex values.End of date range used to calculate Performance Indexvalues.Indicates if the CAGE is a Small Business.Zip code of company CAGE.Count of Category 1 PQDRs, with DCMA supportpoints, that have been identified as closed, with averified defect, and contractor non-compliantPQDRCount of Category 2 PQDRs, with DCMA supportpoints, that have been identified as closed, with averified defect, and contractor non-compliantPQDRPQDR CAT 1 Non-DCMACount of Category 1 PQDRs, without DCMA as aSupport Point, that have been identified as closed, witha verified defect, and contractor non-compliantPQDRPQDR CAT 2 Non-DCMACount of Category 2 PQDRs, without DCMA as aSupport Point, that have been identified as closed, witha verified defect, and contractor non-compliantPQDRQuality Level 1 NonComplianceQuality Level 2 NonComplianceQuality Level 3 CAR CountCount of non-repeat Level 1 Non-compliance CARs inthe Quality categoryCount of non-repeat Level 2 Non-compliance CARs inthe Quality categoryCount of non-repeat Level 3 Non-compliance CARs inthe Quality categoryCount of non-repeat Level 4 Non-compliance CARs inthe Quality categoryCount of non-repeat Level 1 Non-compliance CARs inthe Quality category for subcontractors associated withthe CAGECARQuality SubcontractorLevel 2 Non-ComplianceCount of non-repeat Level 2 Non-compliance CARs inthe Quality category for subcontractors associated withthe CAGECARQuality SubcontractorLevel 3 CountCount of non-repeat Level 3 Non-compliance CARs inthe Quality category for subcontractors associated withthe CAGECARQuality Level 4 CAR CountQuality SubcontractorLevel 1 Non-Compliance30CARCARCARCAR
SRS Element NameDescriptionQuality SubcontractorLevel 4 CountCount of non-repeat Level 4 Non-compliance CARs inthe Quality category for subcontractors associated withthe CAGEQuality Level 1 RepeatNon-ComplianceQuality Level 2 RepeatNon-ComplianceQuality Level 3 RepeatNon-ComplianceQuality CAP DelinquentResponsesQuality CAP SOFDelinquent ResponsesQuality CAP AcceptedResponsesQuality CAP RejectedResponsesDelivery CAR Level 1 NonComplianceDelivery CAR Level 2 NonComplianceDelivery Level 3 CountCount of repeated Level 1 Non-compliance CARs in theQuality categoryCount of repeated Level 2 Non-compliance CARs in theQuality categoryCount of repeated Level 3 Non-compliance CARs in theQuality categoryCount of Corrective Action Plan Delinquent Responsesin the Quality categoryCount of Corrective Action Plans indicated to supportSafety of Flight.Count of Corrective Action Plan Accepted Responses inthe Quality categoryCount of Corrective Action Plan rejected Responses inthe Quality categoryCount of non-repeat Level 1 Non-compliance CARs inthe Delivery categoryCount of non-repeat Level 2 Non-compliance CARs inthe Delivery categoryCount of non-repeat Level 3 Non-compliance CARs inthe Delivery categoryCount of non-repeat Level 4 Non-compliance CARs inthe Delivery categoryCount of repeated Level 1 Non-compliance CARs in theDelivery categoryCount of repeated Level 2 Non-compliance CARs in theDelivery categoryCount of repeated Level 3 Non-compliance CARs in theDelivery categoryCount of Corrective Action Plan Delinquent Responsesin the Delivery categoryCount of Corrective Action Plan Accepted Responses inthe Delivery categoryCount of Corrective Action Plan rejected Responses inthe Delivery categoryCount of non-repeat Level 1 Non-compliance CARs inthe ET&E categoryCount of non-repeat Level 2 Non-compliance CARs inthe ET&E categoryDelivery Level 4 CountDelivery CAR Repeat Level1 Non-ComplianceDelivery CAR Repeat Level2 Non-ComplianceDelivery CAR Repeat Level3 Non-ComplianceDelivery CAP DelinquentResponsesDelivery CAP AcceptedResponsesDelivery CAP RejectedResponsesE, T & E CAR Level 1 NonComplianceE, T & E CAR Level 2 NonCompliance31Source RCARCARCARCARCAR
SRS Element NameDescriptionE, T & E Level 3 CARCountE, T & E Level 4 CARCountE, T & E CAR Repeat Level1 Non-ComplianceE, T & E CAR Repeat Level2 Non-ComplianceE, T & E CAR Repeat Level3 Non-ComplianceE, T & E CAP DelinquentResponsesE, T & E CAP AcceptedResponsesE, T & E CAP RejectedResponsesBusiness CAR Level 1Non-ComplianceBusiness CAR Level 2Non-ComplianceBusiness Level 3 CARCountBusiness Level 4 CARCountBusiness CAR RepeatLevel 1 Non-ComplianceBusiness CAR RepeatLevel 2 Non-ComplianceBusiness CAR RepeatLevel 3 Non-ComplianceBusiness CAP DelinquentResponsesBusiness CAP AcceptedResponsesBusiness CAP RejectedResponsesManufacturing/ProductionCAR Level 1 NonComplianceManufacturing/ProductionCAR Level 2 NonComplianceCount of non-repeat Level 3 Non-compliance CARs inthe ET&E categoryCount of non-repeat Level 4 Non-compliance CARs inthe ET&E categoryCount of repeated Level 1 Non-compliance CARs in theET&E categoryCount of repeated Level 2 Non-compliance CARs in theET&E categoryCount of repeated Level 3 Non-compliance CARs in theET&E categoryCount of Corrective Action Plan Delinquent Responsesin the ET&E categoryCount of Corrective Action Plan Accepted Responses inthe ET&E categoryCount of Corrective Action Plan rejected Responses inthe ET&E categoryCount of non-repeat Level 1 Non-compliance CARs inthe Business categoryCount of non-repeat Level 2 Non-compliance CARs inthe Business categoryCount of non-repeat Level 3 Non-compliance CARs inthe Business categoryCount of non-repeat Level 4 Non-compliance CARs inthe Business categoryCount of repeated Level 1 Non-compliance CARs in theBusiness categoryCount of repeated Level 2 Non-compliance CARs in theBusiness categoryCount of repeated Level 3 Non-compliance CARs in theBusiness categoryCount of Corrective Action Plan Delinquent Responsesin the Business categoryCount of Corrective Action Plan Accepted Responses inthe Business categoryCount of Corrective Action Plan rejected Responses inthe Business categoryCount of non-repeat Level 1 Non-compliance CARs inthe M/P categoryCount of non-repeat Level 2 Non-compliance CARs inthe M/P category32Source RCARCARCARCARCAR
SRS Element NameDescriptionManufacturing/ProductionLevel 3 CAR CountManufacturing/ProductionLevel 4 CAR CountManufacturing/ProductionCAR Repeat Level 1 NonComplianceManufacturing/ProductionCAR Repeat Level 2 NonComplianceManufacturing/ProductionCAR Repeat Level 3 NonComplianceManufacturing/ProductionCAP DelinquentResponsesManufacturing/ProductionCAP Accepted ResponsesManufacturing/ProductionCAP Rejected ResponsesPAR Contract PERF GreenCount of non-repeat Level 3 Non-compliance CARs inthe M/P categoryCount of non-repeat Level 4 Non-compliance CARs inthe M/P categoryCount of repeated Level 1 Non-compliance CARs in theM/P categoryPAR Contract PERF YellowPAR Contract PERF RedPAR Management GreenPAR Management YellowPAR Management RedPAR Production GreenPAR Production YellowPAR Production RedBusiness SystemAssessments TotalDisapproved BusinessSystemsDate of PASPAS Quality TotalSource ofDataCARCARCARCount of repeated Level 2 Non-compliance CARs in theM/P categoryCARCount of repeated Level 3 Non-compliance CARs in theM/P categoryCARCount of Corrective Action Plan Delinquent Responsesin the M/P categoryCARCount of Corrective Action Plan Accepted Responses inthe M/P categoryCount of Corrective Action Plan rejected Responses inthe M/P categoryCount of Program Assessment Reports related toContracts which performed in the "Green" category.Count of Program Assessment Reports related toContracts which performed in the "Yellow" category.Count of Program Assessment Reports related toContracts which performed in the "Red" category.Count of Program Assessment Reports related toManagement which performed in the "Green" category.Count of Program Assessment Reports related toManagement which performed in the "Yellow" category.Count of Program Assessment Reports related toManagement which performed in the "Red" category.Count of Program Assessment Reports related toProduction which performed in the "Green" category.Count of Program Assessment Reports related toProduction which performed in the "Yellow" category.Count of Program Assessment Reports related toProduction which performed in the "Red" category.Count of Busin
SRS Search and Reports, except only DCMA access users can run the Operational Unit CAGE Report. 2.4 CUI and Source Selection Notice The first time a user selects Search or Reports from the SRS fly out, they will have to acknowledge the notice explaining that SRS content is CUI and not intended for source selection (see Figure 2.3). Figure 2.3