Transcription
Standardized Financial Benchmarks for Canadian Farm Financial StatementsLarry Martin and Joerg Zimmermann1ForewordStandardized operating statements produce comparablycalculated financial ratios useful as performance benchmarks.They are used in CTEAM, a management training program forfarmers. Their value in helping farmers understand and improvetheir management performance led to collaboration betweenAME and BDO Canada to introduce standardized statementsand ratios to BDO’s farm clients.This paper explains the collaboration between the twocompanies and extensions of the concepts to additional farmersin Canada and the US by GlobalAgAdvisors Ltd. (GAA). Thestructure and rationale of the standardized statement arepresented in this paper. The resulting ratios are defined andtheir management performance implications are examined.Their value in application is demonstrated by application tothree example farms. The applications identify areas in whichthe farms are performing well and those in which they haveperformance issues.Next steps for the collaboration are identified.AME would like to thank Farm Management Canada forsupporting this project.Key words: FinancialManagement Training.1Management;Benchmarking;The authors are Principal, Agri-Food Management Excellence and Principal, GlobalAgAdvisors Ltd.0
1.0 Introduction and ObjectivesFor 20 years, farmers in AME’s CTEAM (Canadian Total Excellence in AgriculturalManagement) program consistently voiced two criticisms: “From my financial statements,I don’t understand where I am financially or managerially”; and since generally no twoaccountants seem to use the same format for their clients’ accounting statements, “it’simpossible to gauge my performance by benchmarking against others.”This lack of standardization blocks progress in farm financial management because itlimits farmers’ ability to understand their performance, diagnose performance issues andfocus on what needs improving. In CTEAM a standardized operating statement for farmsand attendant performance benchmarks are developed. Watching the results causesappreciation of the power this has for helping farmers improve their managementpractices. Improvements are in operations (production), human resource, and marketingmanagement as well as finance because the resulting ratios are tied to those aspects of thefarm business.This situation was described to BDO’s National Agricultural Committee and illustratedwith examples of how to use the standardized model and ratios to diagnose and addressproblems. The Committee felt that the approach would be a useful one for the firmbecause it would allow the company to provide valuable information to their farmcustomers. This was the beginning of the relationship that will be described in this paper.In addition to working with a national accounting firm to help them provide a powerfulmanagement tool for their farmer-customers, this project had three additional sources ofinterest for AME and the authors. The benchmarks we use in CTEAM were created by examining farm records byanother accounting firm nearly 25 years ago (Betker). They have apparently notbeen updated since then. It is important to ensure that the material is current andaccurate.The structure and content of the operating statement has evolved in one importantway as explained below. The result is a slightly different measure of ratios thanwas used 25 years ago. This also needs updating.The data used to develop the benchmark ratios were mainly Western Canadianfarms that focused on grain and some livestock production. As will be explainedbelow, there is good reason to expect a number of the benchmarks to be differentfor different types of farms because of the nature and relative cost of productionoperations on each type. To test this requires a more comprehensive sample offarms.As a result of the shared interests of AME and BDO, the two organizations collaboratedon a project to update and extend the financial benchmark ratios for Canadian farms. Thedesire and need to do so is not limited to the participants in this collaboration. The work isin line with suggestions by a number of authors to use farm financial statements toprovide management information (eg Barnard and Boehlje; Farm Financial StandardsCouncil; Blonde) and measure competitiveness (CAPI).This paper describes the initial phase of the collaboration and its results. Its objectives are:2
Explain the standardized statement. This is done in Section 2.0 below.Illustrate how the statement’s ratios can assist in diagnosing and improvingmanagement issues. This is the focus of Section 3.0.Present the initial results of the collaboration’s research. Results are presented inSection 4.0.2.0 The Standardized Operating StatementThe standardized operating statement is organized based on two principles: Managing operations is different than managing capital/finances and the operatingstatement should be organized to reflect each of the two independently. All farms, no matter what commodities they produce, have five standard sets ofcosts.The first principle means that we separate the cost components into operations and capitalactivities and use the concept of EBITDA. The components before EBITDA reflectoperations. Those following it reflect capital and financing.The second principle means that the operating statement is organized into the five standardcategories that fit all farms. Then margins are calculated for each category with attendantratios that allow benchmarking across farms.2.1 Revenue from Farming OperationsThe five cost categories are explained below, but prior to that, we start by defining therevenue used at the “top” of the operating statement. It includes only revenue from farmingoperations. It does not include government program payments (except crop insurancepayments), earnings on investments, gains or losses on disposals, off-farm work, or othernon-farm income. It includes sales from farm production, changes in inventories ofmarketable products, gains or losses from legitimate hedging programs, and crop insurancepayments. Income items deemed not from farming operations are included at the end of theoperating statement in a category called “other income and expenses”. This distinction isimportant because the fundamental goal is to be able to measure the performance of anddiagnose problems in the management of the farming operations. A gain or loss on farmassets, off-farm income, government payments or speculative gains on non-farm assetswould skew the performance of the farming operation.2.2 The Cost CategoriesThere are three operating and two financing cost categories. The operating categories arebased on the nature of agricultural production. The three operating components are definedby the following sets of activities: Farms convert raw materials into intermediate or final products, incurring the costof those raw materials.Farms use labour and equipment to produce and transport their inputs and products.These first two categories are correlated with production: e.g. producing 500 tonnesof grain normally requires less fertilizer, seed, machinery use and operational labourthan 1500 tonnes of the same grain assuming the same weather conditions.3
The third operating category is less directly related to production. It includes officecosts, sales and marketing costs, insurance, professional fees, and managementsalaries.Based on these three categories, we define three sets of cost with the following specificdefinitions: Cost of Goods Sold (COGS). For crops, farms convert seeds (or use trees, bushesor vines), fertilizers, and pesticides into forage, grain, fruits or vegetables. Forlivestock, they convert the offspring of parent animals, feed, and medicines intomeat animals or dairy products. So COGS includes things farms buy to transforminto intermediate and final products. We also include crop insurance premiums inthis category because it helps manage the risk of physical losses of crops. Direct Operating Expenses (DOE). These include direct operating labour costs (asopposed to management, sales and administrative), machinery operating expenses(fuel & lubricants), custom work, repairs and maintenance, small tools andequipment, and transport costs.Often rent or lease payments are treated as operating costs. However, leasing orrenting are alternative ways to access capital assets such as machinery, equipmentand/or land as opposed to owning these assets. To separate them from depreciationof owned equipment means that the underlying cost ratios are not comparable forfarms that own assets vs those who rent or lease. Hence, these expenses are placedin the capital component of the operating statement.As a result, all farms, no matter how they access machinery, equipment and landhave the same cost categories in this component: fuel, repairs and maintenance,transportation costs and operational labour are common costs for nearly all types ofmachinery access. Similarly, all the costs of access, whether depreciation, interestor leasing payments are included in the capital component.Obviously, this still gives some problems in comparability: depreciation is oftenlisted as CRA alternatives for tax purposes instead of economic depreciation;owned land is not depreciable, so there is no annual capital cost. But these problemsexist in any classification system. This system at least groups related cost items sothat the problems are focused in the right areas. Economic depreciation can besubstituted for tax-purpose depreciation when available. Operating Overheads (OH). This category is often called selling, general andadministrative expenses. It includes costs not directly related to production andtransportation. Common items are office expenses, management salaries,advertising and promotional expenses, sales staff salaries and expenses, officesupport salaries, insurance, electricity (not associated with operations), professionalfees, etc.4
The two capital cost categories are annual cost of capital and interest costs, and are outlinedbelow in detail. Depreciation/Amortization/Financing (Annual Cost of Capital (ACoC)). Theseare the costs of accessing capital assets: machinery, equipment and land. Theyinclude depreciation/amortization of machinery, equipment, and buildings, propertytaxes, leasing and rental costs of capital assets, as well as land clearing costs.To further underline the logic of accounting for leasing costs as part of capital, bothErnst and Young as well as Price Waterhouse Coopers have published reportsindicating that accounting for leases as part of capital is now standard procedureunder the new International Financial Reporting System (IFRS). Lease paymentsappear on the operating statement as capital costs, and the total lease obligationappears on the balance sheet as a liability. The interest portion of lease paymentsshould be listed separately under interest expenses. Interest Expenses. This is interest on short and longer term financing.2.2 Format and MarginsMargins are calculated for each set of costs. With these definitions the standardizedoperating statement has the following format:Figure 2.0: General Format( )(-)( )(-)( )(-)( )(-)( )(-)( )( /-)( )Revenue from Farming (Sales)Cost of Goods Sold (COGS)Gross Margin (GM)Direct Operating Expenses (DOE)Contribution Margin (CM)Operating Overheads (OH)EBITDARDepreciation/Amortization/Financing (CoC)EBITInterest Expenses (FIN)EBT from OperationsOther Income/ExpensesNet Income before TaxesMargins and RatiosMargins and ratios are defined below as are their current benchmarks. Communication withBackswath Management confirms that sources of benchmarks are varied – some fromliterature such as that cited above, some from lenders and a few from proprietary analysisperformed more than two decades ago. Part of the project with BDO is to test thebenchmarks with a rigourous multiyear analysis.Gross Margin Ratio (%GM)5
Gross Margin (GM) is Revenue minus Cost of Goods Sold (COGS), and the GM ratio isGM/Revenue. GM is operating returns remaining after paying for costs of material. Fourfactors underpin the ratio: product prices; input prices; input quantities; and yields. If thisratio is consistently lower than the benchmark, then management can focus on issues inproduction or marketing.The current benchmark for most farms is 65% or more of revenue – i.e. Cost of Goods Soldis 35% or less of revenue. Literally, it means the most profitable farms have at least .65left of every dollar of sales after purchasing materials that are transformed into finalproducts.Consistent low ratios over time likely mean that a farm has poor productivity, needs toimprove marketing, or consider whether it is producing the right products. An example istwo dairy farms, one with %GM of 75% and the other at 56%. Since this industry in Canadahas administered prices roughly equal for everyone, it’s apparent that the second farm needsto improve its productivity.Consistently poor performance when there are no clear production problems, sometimesleads to the decision to change products because market returns are inadequate in the onechosen.This standard is likely too low for horticultural operations and too high for beef feedlots orswine farms that finish weaners. Horticultural operations tend to have relatively high valueproduction (eg wine grapes) compared to the cost of seed, seed stock, fertilizer andchemicals. Feedlots have very high outlay for feeders, along with feed, leading to muchlower margins and higher turnover.Contribution Margin Ratio (%CM)Contribution margin is calculated by subtracting Direct Operating Expenses from GrossMargin, and %CM is CM/Revenue. It is what remains from each dollar of sales after payingall variable input and operating expenses. For farms with Gross Margins of 65%, the currentbenchmark for % CM is 45-50%. Conversely, Direct Operating Expenses should be 1520% of revenue. If the latter are higher, there are generally three potential problems. Oneis that labour costs are too high, either because of too much labour, inefficiency of thecapital stock with which labour has to work, or insufficient revenue generated from thelabour.A second potential contributor is over use of machinery and equipment, thereby makingoperating costs too high. This may be a sign of over (or under) investment in this category.Again, the benchmark is helpful in diagnosing and managing problems. For example, ifDOE is 30% for a farm, it suggests there is a problem. Often, especially in DOE, it’s notdifficult to isolate the potential source of the problem because the likely culprits will bethose with the largest expenses in the category. So, if small tools and equipment are 1%,it’s obvious that cutting it by half won’t fix the problem. But if repairs and maintenance oroperating labour are each 12% of revenue, they are clear candidates for improvement. Thenext step is to drill down in these categories to search for ways to improve.Again, this benchmark is likely different for horticulture and it may be higher now for allfarms. Limited samples for horticulture suggest that, because of their much higher labour6
requirements, the range should likely be at least 25-30% for DOE. If that is correct and%GM should be 75%, then the %CM should be the same at 45-50%, but the costs wouldbe redistributed differently between the two categories.The reason to suggest it may be higher for all farms is that it contains expenses (energy,labour and labour in repairs and maintenance) whose prices have risen relative to manyothers over the past few years.Operating Efficiency Ratio (%EBITDA)EBITDA (Earnings before Interest, Taxes, Depreciation and Amortization) is calculated bysubtracting Operating Overheads (OH) from contribution margin. Operating EfficiencyRatio is EBITDA/Revenue. EBITDA is a measure of operating income that has long beenused, especially outside of agriculture, to understand the ability of an operation to generatecash over operating expenses. 2For farms the benchmark is 35%, or .35 for every dollar of revenue. Therefore, OH shouldbe 10-15%, and the cost analysis should proceed as above with DOE when OH is too high.In our experience, this category is not usually a problem. But when it is, the specificnumbers will show its source.%EBIT Ratio and %EBT RatioEBIT is earnings before interest and taxes is calculated by subtracting financing costs(CoC) from EBITDA. Then interest expenses are subtracted to get earnings before taxes(EBT). The ratios are then found by dividing EBIT and EBT by revenue. Having hadlimited experience with these two ratios in this format, the benchmarks are not finalized,though %EBIT likely should be in the 20% range. This suggests that financing capitalshould cost in the neighborhood of 15% of revenue.2.3 Additional RatiosSpace limitations for this paper prevent detailed explanation of the balance sheet, thoughthere is less variation among their structures by Canadian accountants. Therefore, there areessentially no standardization changes.Two sets of ratios that include the balance sheet are important in assessing performance.Current Ratio (Current Assets/Current Liabilities)This is the standard measure of short term liquidity, along with working capital (CurrentAssets – Current Liabilities), for most types of business. Values under 1.5 show potentialliquidity problems, especially if it is a relatively low percentage of annual operating costs.Producers in Canada’s dairy and poultry industries probably can go to 1.2 because of theirlow price risk and steady cash flow.Debt/EBITDA2With the change to the new IFRS standard that treats leasing costs as capital costs the term is nowproperly called EBITDAR, to include earnings before rental costs along with operating expenses asdiscussed in Quora.7
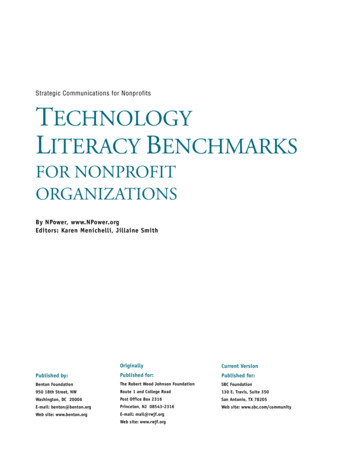
Debt/EBITDA is a measure of long term solvency risk. It can be calculated as either TotalLiabilities/EBITDA or Bank Debt/EBITDA. Literal interpretation is, if the operation usesall of its annual operating earnings to only pay debt principal, it will require the calculatednumber of years to pay it off. So, if the ratio is 6.3:1, then it will take 6.3 years of operatingearnings to pay down principal. This means paying no interest, no taxes, no profits toowners and no new investment for 6.3 years.It is useful from a management perspective to separate bank debt from other debt such asshareholders’ loans, or other “softer” debt that is more easily extended or forgiven. Ratioscalculated with only bank debt and/or with total liabilities, give a more complete picture ofat risk obligations. Banks usually get their money, but shareholders may not. With bankdebt in the numerator, the risk of loans being called is more evident when the ratio is high.Outside of agriculture lenders often impose covenants on credit facilities aboveDebt/EBITDA of 3.5:1. Previous research suggests that the average for Canadian farms is5:1. Agriculture receives more tolerance because of its high “off-balance sheet” valueresulting from land and/or quota appreciation. Obviously, anything above 5.0 is highlyleveraged from an operational perspective: farms in this range are often living on theirequity and/or on hopes of improved future earnings.In our experience, many top managers keep this ratio under about 2.5. Some excellentoperations keep it even lower until they are ready to make a major investment. At thatpoint they may push it much higher, but don’t make additional major investments until theypay down enough to bring the ratio below a target number such as 2.5.3.0 Using the Benchmark Ratios to Diagnose Management IssuesThe joint project of AME and BDO will be explained in the next section. In this one, theapplication of the framework and benchmarks to farms is shown using data from threeexample farms. The three farms had sales and ratios for 2015 shown in Figure 3.1.Figure 3.1: Performance Ratios, Three Farms 2015Farm ARevenue ( MIL)Farm BFarm C 1.58 1.64 1.43%Gross Margin Ratio657365% Contribution Margin Ratio42Operating Efficiency Ratio31% EBT Ratio19EBT ( 000) 30023452826128 1312738211Benchmark45-50%4341865%(16)35%50 (229)The three farms each had over 1 million in revenue. Farm A had net earnings of 320,000,Farm B earned 131,000, while Farm C lost 229,000. What caused the differences?8
The answers become apparent by examining the ratios: All three achieved the benchmark performance on gross margin, though Farm Boutperformed the other two.None of the three achieved the benchmark on contribution margin: subtracting their%CM’s from %GM’s gives 23%, 45% and 27%. So their direct operating costs allexceed the benchmark. At 23%, A is closest to the benchmark of 15-20%, B farunder performs it at 45%, a major problem, and C’s performance is in between theother two.B’s 45% DOE flags a problem, less so for C. Delving deeper into their financialstatements, we find that repairs and maintenance for Farms A and B are 7% and 6%of revenue, while for Farm C, they are 10%. This contributes to C’s performanceissue. Similarly, while A and C spend 5% and 4% of revenue on labour, Farm B’slabour expense is 23%. There may be a logical explanation for this, but it certainlyraises a flag about where to focus.Operating overheads at 12%, 2%, and 4% of revenue for the three are reasonable,though A could examine this area for improvement.Total financing costs are 12% and 18% of revenue for Farms A and B, but anextremely high 50% for Farm C. Looking deeper at Farm C’s statement revealsthat it invested substantially in land clearing, which will likely have a pay off in thefuture. But the farm lost money even without this expenditure. Interest, land rentand amortization are the largest entries in the capital cost component. This suggeststhat Farm C is substantially over capitalized for the amount of revenue it isgenerating.In summary, Farm A has the best overall performance with net earnings at 19% of revenue.Its performance against all the benchmarks is the best. Operationally, A needs to tweak allareas to find small improvements. Depending on its balance sheet ratios, its strategicintents, in addition to continuous improvement in its operations, are likely to focus ongrowth.B clearly has an issue with Direct Operating Expenses: so, B’s strategic issue is to findways to either reduce labour costs or generate more revenue with the labor it’s carrying. Itgenerates far too little operating income to warrant substantial new investment.C is weak on direct operating expenses and incurred land clearing expenses that mayimprove profits later. But C’s main issue is that the farm appears to be overcapitalized forthe amount of revenue it generates. Strategically, it needs to focus on either reducing thosecapital costs or using the capital to generate more income. It does have some flexibilitybecause its 34% operating efficiency ratio means that it has reasonable cash flow, so thereare likely things that can be done to employ the capital more effectively and/or to reducethe capital cost.These examples illustrate how the standardized ratios and benchmarks can be used topotentially identify issues and lead to solutions about how to correct them.9
4.0: The AME/BDO CollaborationConversations between the senior author and senior management at BDO overapproximately two years focused on the standardization concept and on the improvementshown by CTEAM participants in their management after using their standardized financialstatements to focus on clear problems. BDO is committed to investing in ways to add valueto their farm customers.This led to two presentations to BDO’s National Agricultural Committee describing thestandardized statement and pointing out how it can be used to improve managementdecisions. The National Committee saw the potential benefit and committed initially todeveloping a template that extracts the line items from a few 2015 and at least 78 2016 farmstatements so they can be summarized in the proper order (with the permission of theirclients).BDO developed its own template to pull the right line items from each account and thengroup them into the categories described above to calculate the ratios. It was used to testthe viability of the template by drawing the small sample of client farms from 2015 – ie totest whether the template functions accurately.Starting with the 2016 tax year, a set of the company’s clients from a number of BDO’sagricultural offices had or will have their financial statements done in the format discussed.The ratios will be calculated, including from the two previous tax years so that arbitraryevents in a given year can be avoided, and to start providing the clients with trends on thevarious ratios.These clients will receive a summary of their ratios, with definitions and directions on howto understand their performance and how to diagnose problems. In subsequent years, clientswill receive the foregoing as well as an analysis of their trends on the various ratios to helpthem assess progress. AME will provide support in developing the material and proceduresfor the project.4.1 The Benchmarking ProcessIn the initial phase of the project, the 78 records were used to update and developbenchmark ratios. This was done by testing the operating statement ratios discussed above.The farms’ profitability was calculated two ways: returns on assets, and profit/dollar ofsales. Both measures use Earnings before Taxes (EBT) as the numerator. The first uses thecurrent value of total assets as the denominator. The second uses revenue from farming asthe denominator.Using these two measures, the farms were arrayed in quartiles from the most profitable25% to the least profitable 25%. Then the various ratios were compared for each quartileto identify differences.A basic result is that both measures of profitability identified essentially the same farms inthe upper quartile and the ratios associated with them were the same. Therefore, for theremainder of this report, the numbers used are for the quartiles based on Earnings beforeTaxes as a percentage of total revenue from farming operations.10
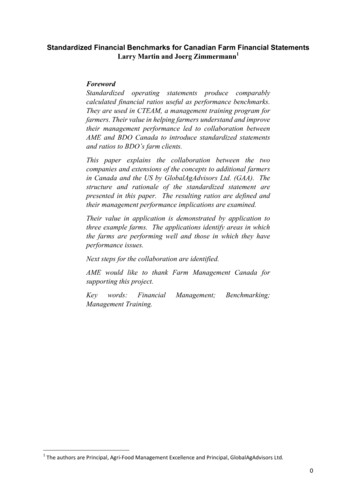
4.1.1 Overall Profitability, by Type of Farm and % Gross MarginsTable 4.1 contains the net profit ratio by quartile and their attendant gross margin ratios.The numbers are presented by predominant type of farm and for all the farms.Examining the overall profitability (last row of the tables) is instructive. Net profits were10.5% of revenue for the top 25% of all farms – ie after accounting for all costs andexpenses, the most profitable farms made 10.5 cents per dollar of sales. Interestingly, whenthe farms are separated into commodity types, profitability doesn’t change much: cash crop,dairy and horticulture, for which there are the largest number of records, are all within 2%of the overall average.Another observation is that there is clearly more variation in profitability within any groupof farms than between groups. While the sample size is too small for statistical significance,after showing that there is only 2% variation among the top 25% in the overall group andthe three major farm types indicated above, variation within the largest group, crop farms,is mammoth. The most profitable has net profits of 45.9% and the least is -43.4%, adifference of 89%. Comparing the top 25% with the lower 25% of crop farms shows 10.4%vs. -12.2%, a range of 22.6%. Examination of the table reveals that the same holds for theother types. This conclusion is one that has been observed in many other contexts where alarge number of farms is involved.A third observation is the relationship between the net profit ratios and gross margin ratios.Gross margin is a measure of how much value the farm adds to the cost of the raw materialit buys. Clearly, a higher number indicates a higher value added. Looking at the numbersfor all farms, it is clear that there is positive correlation between the two ratios. The 25%most profitable farms had average %GM of 67.2%, the 50% level had %GM of 60.3%, andthe lower 25% had %GM of 53.7%.These are substantial differences. If one assumes that the average revenue for the samplefarms is 3 million, the difference of 13.5% between the top and bottom tiers is 405,000of added value.A final observation is that there appears to be differences in %GM among the farm types,as would be expected. Again, it is very important to note that sample size is too small torely on the number statistically, but the upper 25% of beef farms have a much lower %GMthan the average, while the upper 25% of horticulture operations have a higher %GM.Neither is surprising. Beef feedlot operations, as opposed to cow-calf, purchase almost allof their inputs and turnover their cattle more than once a year. They would be expected tohave a low gross margin compared to crop farms that have one turnover.The opposite is the case for horticulture. In most cases, hort products are relatively highvalue, so their revenue compared to the costs of inputs is high. Therefore, we would expecta higher gross margin. At the same time, operating labour is generally a significant expensefor horticultural operations, so we would expect %Direct Operating Expenses to be higher.11
NET PROFIT RATIO (NPR, excl. other income)POPCOUNTBeef8Cash crop 33Dairy16Horticulture .53%-10.93%-52.53%MEANPOPMINGROSS MARGIN RATIOBeef35.94%18.72%Cash crop 63.22%66.36%Dairy69.14%55.17%Horticulture 0.37%26.06%25%50%75%0.80% 6.49% 13.70%-12.17% 3.94% 10.32%-0.76% 4.93% 12.60%-10.40% 3.08% 11.66%-37.99% -23.44% -8.89%-5.88% -0.70% 2.86%-5.73% 3.59% 10.47%25%100% MEAN MEDIAN STD AX17.09% 38.56%58.56% 62.87%67.76% 67.14%47.42% 69.61%26.06%n/a29.53% 38.33%53.71% 60.32%difference to .64%6.50%-0.1
on a project to update and extend the financial benchmark ratios for Canadian farms. The desire and need to do so is not limited to the participants in this collaboration. The work is in line with suggestions by a number of authors to use farm financial statements to provide management information (eg Barnard and Boehlje; Farm Financial Standards