Transcription
Getting Started with Minitab StatisticalSoftware
Getting Started with Minitab Statistical SoftwareContents12IntroductionOverview44The storyThe Minitab user interface44Data typesOpen and examine a worksheet67In the next chapter7Graphing Data8OverviewCreate, interpret, and edit histograms88Create and interpret scatterplotsArrange multiple graphs on one layoutSave a Minitab projectIn the next chapter131619203Analyzing DataOverviewSummarize the dataCompare two or more meansSave the projectIn the next chapter2121212329294Assessing QualityOverviewCreate and interpret control chartsCreate and interpret capability statisticsSave the projectIn the next chapter3030303536365Designing an Experiment37OverviewCreate a designed experiment3737View the designEnter data into the worksheet4041Analyze the design and interpret the resultsUse the stored model for additional analyses4245Save the projectIn the next chapter4849Repeat an AnalysisOverviewPerform an analysis using session commands5050506minitab.com2
Getting Started with Minitab Statistical Software7Copy session commandsUse an exec file to repeat the analysisSave the projectIn the next chapter51525354Importing and Preparing DataOverviewImport data from different sourcesPrepare the data for your analysisWhen data values changeSave the worksheet555555576060Indexminitab.com613
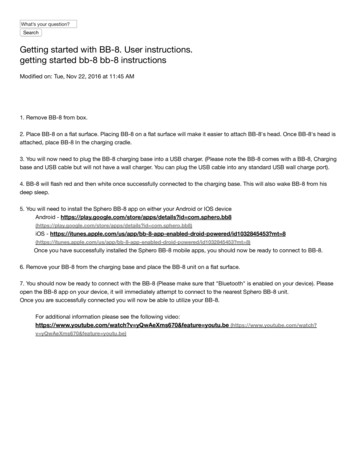
Getting Started with Minitab Statistical Software1.IntroductionOverviewGetting Started with Minitab Statistical Software introduces you to some of the most commonly used features and tasksin Minitab.Note: Some features in this guide are only available in the desktop app. When you use the web app on a Windows computer or on a Mac,you can open the desktop app to access all of the features that Minitab offers.Most statistical analyses require that you follow a series of steps, often directed by background knowledge or by thesubject area that you are investigating. Chapters 2 through 5 illustrate the following steps: Explore data with graphs and present results Conduct statistical analyses Assess quality Design an experimentIn chapters 6 and 7, you learn to do the following: Use shortcuts to automate future analyses Import data into Minitab from different file types and prepare the data for analysisThe storyA company that sells books online has three regional shipping centers. Each shipping center uses a different computersystem to enter and process orders. The company wants to identify the most efficient computer system and to use thatcomputer system at each shipping center.Throughout Getting Started with Minitab Statistical Software, you analyze data from the shipping centers as you learn touse Minitab. You create graphs and perform statistical analyses to identify the shipping center that has the most efficientcomputer system. You then concentrate on the data from this shipping center. First, you create control charts to testwhether the shipping center’s process is in control. Then, you perform a capability analysis to test whether the processis operating within specification limits. Finally, you perform a designed experiment to determine ways to improve thoseprocesses.You also learn how to use session commands to automate future analyses and how to import data into Minitab.The Minitab user interfaceEverything you see in the Minitab interface is part of your project.minitab.com4
Getting Started with Minitab Statistical SoftwareThe Minitab interface includes the following components:1: NavigatorContains the list of output titles and report titles in your project. The output and reports are sorted from oldest tonewest, with the most recent items at the bottom of the list. Right-click any title in the Navigator to do the followingtasks: Open the output or the report in split view to compare outputs and to easily drag and drop output into a report. Rename the output or the report. The name is also updated in the output pane. Send the output or the report to a different application, such as Microsoft Word, Microsoft PowerPoint, MinitabEngage , or Minitab Workspace . Delete the analysis or the report from the project. You can undo this action from the Edit menu.Tip: If your project has multiple worksheets, you can view the list of output by worksheet. From the Navigator, clickGroup Commands by Worksheetand choose2: Output paneDisplays a list of the output pages and report pages in a project. Output pages display output such as graphs ortables after you run an analysis. Report pages display output that you collect from one or more output pages. Youcan create and edit reports in the desktop app. You can only open and view reports in the web app. From the outputpane, you can do the following tasks: To affect the contents of a tab, click the tab, then clicknext to the output title. To affect a specific table or graph, click the graph or the table, then clickminitab.com.5
Getting Started with Minitab Statistical Software To view output that is not currently visible, click the title of the output in the Navigator.Tip: To compare the output of two different analyses or reports, right-click the second piece of output in the Navigator and chooseOpen in Split View.3: Data pane (worksheets)Displays the active worksheet. You can have multiple worksheets in the data pane; however, Minitab uses the datain the active worksheet to run the analysis.Tip:To rename a worksheet, double-click the name in the worksheet tab.4: Command Line/History paneBy default, this pane is not shown. To show this pane, choose View Command Line/History. If you close Minitabwhile the pane is visible, the pane is visible the next time you open Minitab.Command LineThe location where you can enter or paste command language to perform an analysis.HistoryThe command language that Minitab uses to run an analysis. You can select and copy commands andsubcommands from the History pane to the Command Line pane, where you can edit and run them again.5: Status barUse the status bar to show or hide the Navigator, the data pane, or the output pane. You can also zoom in or zoomout on a graph or a worksheet, depending on whether the data pane or the output pane is selected. Clickto show or hide the Navigator. Clickto show the output pane and the data pane at the same time. Clickto show only the data pane. Clickto show only the output pane.Data typesA worksheet can contain the following types of data.Numeric dataNumbers, such as 264 or 5.28125.Text dataLetters, numbers, spaces, and special characters, such as Test #4 or North America.Date/time dataDates, such as Mar-17-2020, 17-Mar-2020, 3/17/20, or 17/03/20.Times, such as 08:25:22 AM.Date/time, such as 3/17/20 08:25:22 AM or 17/03/20 08:25:22.minitab.com6
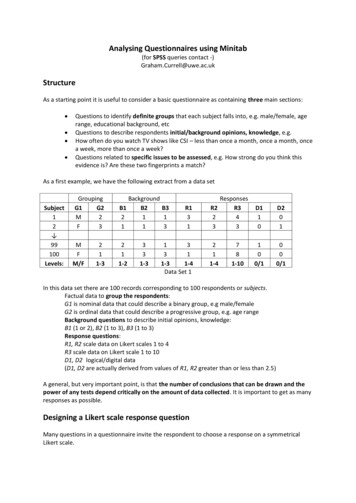
Getting Started with Minitab Statistical SoftwareOpen and examine a worksheetYou can opena new, empty worksheet at any time. You can also open one or more files that contain data, such as a Microsoft Excel file. When you open a file, you copy the contents of the file into the current Minitab project. Any changesthat you make to the worksheet while you are in the project do not affect the original file.The data for the three shipping centers are stored in the worksheet, ShippingData.MTW.Note: In some cases, you need to prepare your worksheet before you begin an analysis. For more information, go to Importing and PreparingData on page 55.1. Open the data set, ShippingData.MTW.The data are arranged in columns, which are also called variables. The column number and name are at the top of aysStatusDistance1Eastern3/4 8:343/8 15:214.28264 On time2552Eastern3/4 8:353/7 17:053.35417 On time1963Eastern3/4 8:38*4Eastern3/4 8:403/8 15:525Eastern3/4 8:423/10 14:48* Back order4.30000 On time6.25417 Late299205250In the worksheet, each row represents a single book order. The columns contain the following information: Center: shipping center name Order: order date and time Arrival: delivery date and time Days: delivery time in days Status: delivery status On time indicates that the book shipment was received on time. Back order indicates that the book cannot be shipped yet because it is not currently in stock. Late indicates that the book shipment was received six or more days after the order was placed. Distance: distance from the shipping center to the delivery locationIn the next chapterNow that you have a worksheet open, you are ready to start using Minitab. In the next chapter, you use graphs to checkthe data for normality and examine the relationships between variables.minitab.com7
Getting Started with Minitab Statistical Software2.Graphing DataOverviewBefore you perform a statistical analysis, you can use graphs to explore data and assess relationships between thevariables. Also, you can use graphs to summarize data and to help interpret statistical results.You can access Minitab’s graphs from the Graph and Stat menus. Built-in graphs, which help you interpret results andassess the validity of statistical assumptions, are also available with many statistical commands.Minitab graphs include the following features: Pictorial galleries to help you choose a graph type Flexibility in customizing graphs Graph elements that you can change Option to be updatedThis chapter explores the shipping data worksheet that you opened in the previous chapter. You use graphs to checknormality, compare means, explore variability, and examine the relationships between variables.Create, interpret, and edit histogramsBefore you perform a statistical analysis, first create graphs that display important characteristics of the data. For theshipping data, you want to know the mean delivery time for each shipping center and how the data vary within eachshipping center. You also want to determine whether the shipping data follow a normal distribution, so that you can usestandard statistical methods for testing the equality of means.Create a paneled histogramTo determine whether the shipping data follow a normal distribution, create a paneled histogram of the time lapse betweenorder date and delivery date.Note:When you use the web app, click Open in Desktop App to complete the following steps.1. If you are continuing from the previous chapter, go to step 2. If not, open the data set, ShippingData.MTW.2. Choose Graph Histogram.minitab.com8
Getting Started with Minitab Statistical Software3. Choose With Fit, and then click OK.4. In Graph variables, enter Days.5. Click Multiple Graphs, and then click the By Variables tab.6. In By variables with groups in separate panels, enter Center.7. Click OK in each dialog box.Note:To select variables in most Minitab dialog boxes, use one of the following methods: Double-click the variables in the variables list box.Highlight the variables in the list box, and then click Select.Type the variables’ names or column numbers.minitab.com9
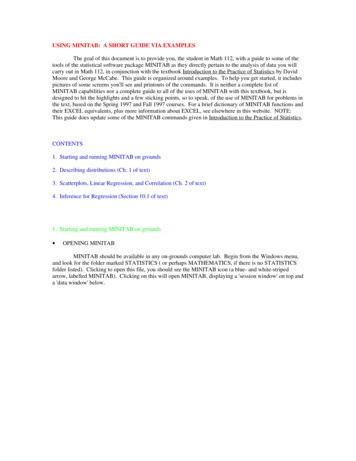
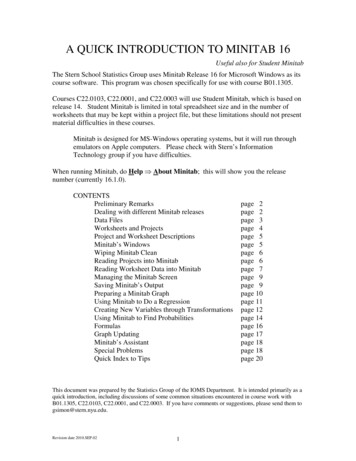
Getting Started with Minitab Statistical SoftwareHistogram with groups in separate panelsInterpret the resultsThe histograms seem to be approximately bell-shaped and symmetric about the means, which indicates that the deliverytimes for each center are approximately normally distributed.Rearrange the paneled histogramFor the graph that you created, you want to rearrange the three panels so that comparisons among the means andvariations are easier.Note:When you use the web app, click Open in Desktop App to complete the following steps.1. Double-click the histogram to open the Edit Graph dialog box.2. Right-click any of the histogram titles (Central, Eastern, or Western) and choose Edit Panels.3. On the Arrangement tab, in Rows and Columns, select Custom. In Rows, enter 3. In Columns, enter 1.4. Click OK in each dialog box to show the changes in the output pane.minitab.com10
Getting Started with Minitab Statistical SoftwareHistogram with panels arranged in one columnInterpret the resultsThe mean delivery times for each shipping center are different: Central: 3.984 days Eastern: 4.452 days Western: 2.981 daysThe histogram shows that the Central and Eastern centers are similar in both mean delivery time and spread of deliverytime. In contrast, the mean delivery time for the Western center is shorter and the distribution is less spread out. AnalyzingData on page 21 shows how to detect statistically significant differences between means using ANOVA (analysis ofvariance).Tip: With some graphs and output, such as the histogram, Minitab notifies you when data in the worksheet have changed. When data change,look for the notification at the top of the output pane, then click one of the links to update the results or create new results using the currentdata.Edit the title and add a footnoteTo help your supervisor quickly interpret the histogram, you want to change the title and add a footnote.Note:When you use the web app, click Open in Desktop App to complete the following steps.1. Double-click the title, Histogram of Days.minitab.com11
Getting Started with Minitab Statistical Software2. In Text, enter Histogram of Delivery Time.3. Click OK.4. Right-click the histogram, and then choose Add Footnote.5. In Footnote, enter Western center: fastest delivery time, lowest variability.6. Click OK in each dialog box to show the changes in the output pane.minitab.com12
Getting Started with Minitab Statistical SoftwareHistogram with edited title and new footnoteInterpret the resultsThe paneled histogram now has a more descriptive title and a footnote that provides a brief interpretation of the results.Create and interpret scatterplotsGraphs can help you identify whether relationships exist between variables, and the strength of any relationships. Knowingthe relationship between variables can help you determine which variables are important to analyze and which additionalanalyses to choose.Because each shipping center serves a region, you suspect that distance to delivery location does not greatly affectdelivery time. To verify this
The Minitab user interface 4 Data types 6 Open and examine a worksheet 7 In the next chapter 7 2 Graphing Data 8 Overview 8 Create, interpret, and edit histograms 8 Create and interpret scatterplots 13 Arrange multiple graphs on one layout 16 Save a Minitab project 19 In the next chapter 20 3 Analyzing Data 21 Overview 21 Summarize the data 21 Compare two or more means 23 Save the project 29 .