Transcription
HOW TO USE MINITAB:QUALITY CONTROL1Noelle M. Richard08/27/14
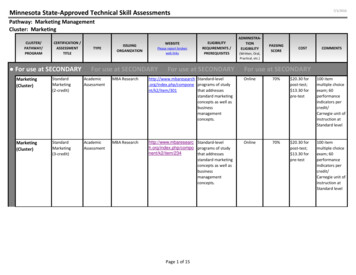
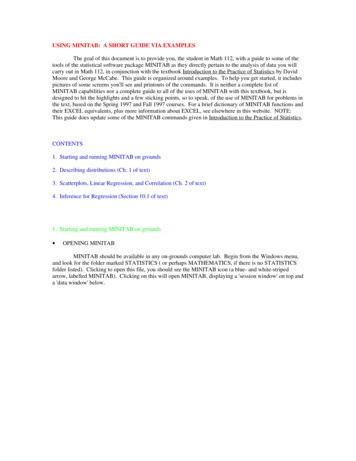
INTRODUCTION* Click on the links tojump to that page inthe presentation. *Two Major Components:1.Control ChartsUsed to monitor a process and show if it’s in control Does not indicate if your process is meetingspecifications 2.Capability AnalysisIndicates whether your process is meetingspecifications Does not show if your process is in control or not For more details, go L FOLDERS\Student Folders\N. Richard\SPC\Statistical Process Control ads/2013/02/four-process-states.gif2
TYPESOFCONTROL CHARTS* Click on the links tojump to that page inthe presentation. *ChartUse This Chart When You have You have Xbar – R ChartOne Variable- MeasurementDataA sample at each time t.Samples can be differentsizesOut of control signals, largeprocess shifts ( 1.5σ)Xbar – S ChartOne Variable- MeasurementDataA sample at each time t.Samples can be differentsizes.Out of control signals, largeprocess shifts ( 1.5σ)I – MR ChartOne Variable- MeasurementDataIndividual measures (samplesize 1) at each time tOut of control signals, largeprocess shifts ( 1.5σ)EWMA ChartOne Variable- MeasurementDataEither samples or individualmeasures at each time tOut of control signals, smallprocess shifts ( 1.5σ)CUSUM ChartOne Variable- MeasurementDataEither samples or individualmeasures at each time tOut of control signals, smallprocess shifts ( 1.5σ)P ChartAttribute (Categorical) DataA sample at each time t.Samples can be differentsizesThe fraction of nonconforming units p, largeprocess shifts ( 1.5σ)C ChartAttribute (Categorical) DataSamples that are all the samesizeThe # of non-conformities ina sample, large processshifts ( 1.5σ)U ChartAttribute (Categorical) DataSamples that differ in sizeThe # of non-conformitiesper unit in a sample, largeprocess shifts ( 1.5σ)T2 ChartSeveral VariablesMeasurement DataA sample at each time t, foreach variable- consideringvariables jointly, rather thanseparatelyOut of control signals, largeprocess shifts ( 1.5σ),σ standard deviationYou want to find 3
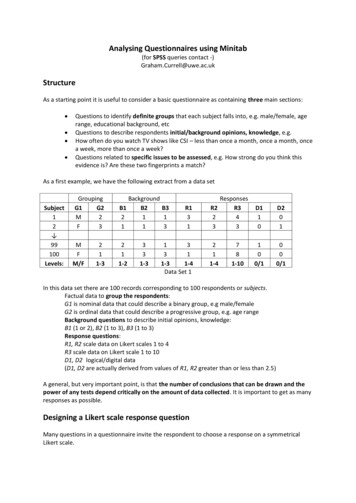
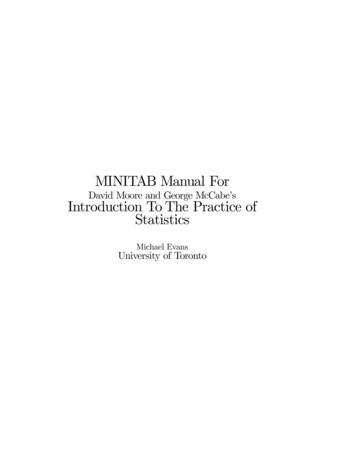
PARTSOF ACONTROL CHARTControl charts are used to detectspecial causes of variation.A process is out of control (OOC)if it is operating with specialcauses of variation.See the next slide for signals ofan OOC process.Shows which out ofcontrol signal occurredExample of natural(common)variation. This isnormal and ok.Variation caused by somethingspecial, such as operator error,equipment failure, etc. This isnot normal and not ok.Upper Control ngesLower Control Limit4Return to Types of Control Chart
OUTOFCONTROL SIGNALSYour process may be out of control (OOC) if one or more of thefollowing occurs:1.One or more points beyond 3 sigma from center line2.9 points in a row on same side of center line3.6 points in a row, all increasing or all decreasing4.14 points in a row, alternating up and down5.2 out of 3 consecutive points beyond 2 sigma from center line (same side)6.4 out of 5 consecutive points beyond 1 sigma from center line (same side)7.15 points in a row within 1 sigma of center line (either side)8.8 points in a row beyond 1 sigma from center line (either side)You can change the values in red, but the ones above are standard in practice.Will show later how to perform these tests.If you have an in control, normally distributed process, 99.73% of the points will fall within 3 sigma limits. 0.27% will fall outside the limits;these points are called false alarms. They appear to be out of control signals, but they are not.If your data is not normally distributed, you have a greater risk of false alarms. Even more important, you also have the risk of falsenegatives. This is a point that is out of control, but is not flagged. This is bad!5Return to Types of Control Chart
CREATING CONTROL CHARTSTwo ways to create control charts in Minitab1.Stat Control Charts2.Assistant Control ChartsNote: Assistant only performstests 1, 2, and 7 from page 56Return to Types of Control Chart
XBAR-R CHARTGraphs subgroup means and rangesSubgroup size: thenumber of data pointsin each of your samples.If all your samples are the same size, you can enter in the number here.If samples are not the same size, create a “Subgroup” column in your data.The subgroup column should indicate what sample a data point belongs to.To select which tests (for out ofcontrol signals) to perform, clickOptions.Then, click the Tests tab.Select which tests you want toperform, or use the drop-down toselect “Perform all tests for specialcauses”7Change the values if you wish.Return to Types of Control Chart
XBAR-R CHARTTo display 1, 2, 3, etc. standard deviations onyour graph, go to the S-Limits tabSometimes, you will have data taken on differentdays. You may want to see separate analysis foreach day.Or, you purposely shift a process. The control limitsshould be re-evaluated, and you may want to see thechange in limits.Or, you want to monitor short production runs(frequent product changeover, or, a part goingthrough several processes)8Using stages will allow you to do this. Control limitswill be re-evaluated at the beginning of a new stage.Return to Types of Control Chart
BOX-COX TRANSFORMATION Xbar – R control charts perform well when the data is normallydistributed (Why? See bottom of page 5).But what if it’s not? You can try a Box-Cox TransformationRaises your data points to a powerex. ½ (square root), 2 (squared), etc.Box-Cox can select the “best” power for the dataCaution: Box Cox transformations don’t always work. If it doesn’t try a chart robustfor non-normality (see EWMA, for example)9Note: All data must be positive when usingthe Box-Cox transformation.Return to Types of Control Chart
XBAR-R CHARTRemember: Assistant only performstests 1, 2, and 7 from page 5Output from Assistantfor an Xbar – R Chart10Return to Types of Control Chart
* Click on the link tojump to that page inthe presentation. *XBAR – S CHARTGraphs subgroup means and standard deviation.More robust than Xbar – R charts. If you can, use this one over Xbar – RGo through samesteps as Xbar-R chart11Return to Types of Control Chart
I-MR CHARTIndividuals and Moving Range ChartGraphs individual data points and the difference between consecutive data points (moving range)Same options as Xbar – R andXbar – S charts. Just nooption for sample size,because it’s automatically 112Return to Types of Control Chart
EWMA CHARTExponentially-Weighted Moving Average ChartXbar – R and Xbar – S charts use information from the present sample only.EWMA charts use both past and present information.Robust for non-normal dataWeight values within (0.05, 0.25) work well.For 3σ charts, use a weight 0.113Return to Types of Control Chart
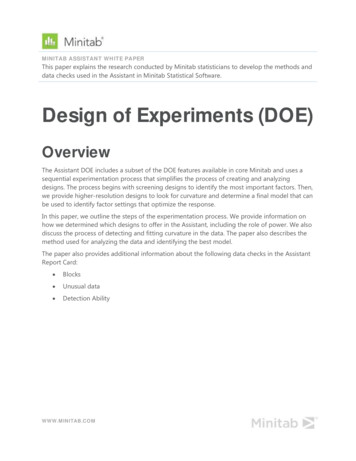
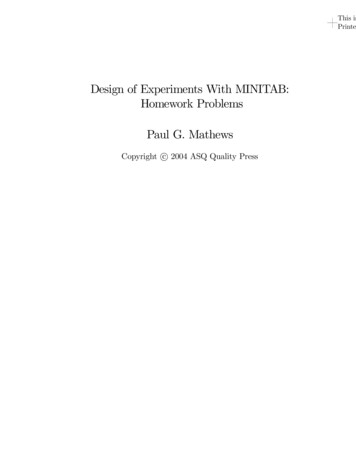
EWMA CHARTOutput:Only have one chart forEWMA.Looking mostly at pointsoutside the control limits ortrends.Great for identifying smallprocess shiftsInterpretation:If a point is above the UCL, scan to the left of that point. Find the last positive point.This is where the process shift began.ex. In the figure above, sample 20 is an out of control point. Scanning to the left, sample15 is the last positive point. Thus, the shift began at sample 15.14Return to Types of Control Chart
CUSUM CHARTCumulative Sum ChartPlots cumulative sums ofdeviations from a targetLike with EWMA, looking forOOC points or trends15Return to Types of Control Chart
P, C,ANDU CHARTSThe previous charts were applicable for“measurement” data.P, C, and U charts are applicable when youhave a count of the # of nonconformingunits, # nonconformities on a unit, etc.16Return to Types of Control Chart
P, C,ANDU CHARTSPChartA sample at each timet. Samples can bedifferent sizesThe fraction of non-conforming units p,large process shifts ( 1.5σ)CChartSamples that are allthe same sizeThe # of non-conformities in a sample,large process shifts ( 1.5σ)UChartSamples that differ insizeThe # of non-conformities per unit in asample, large process shifts ( 1.5σ)17Return to Types of Control Chart
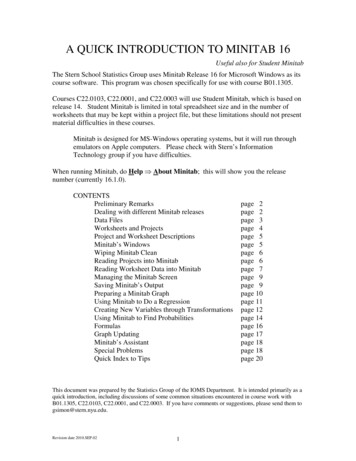
T2 CHARTT2 – Generalized Variance ChartUsed when you have several process variables simultaneouslymeasured on the same process/product Similar process for sample sizes 1Can also performmultivariate EWMALook for points outside thecontrol limits or trends18Return to Types of Control Chart
CAPABILITY ANALYSIS Are products/processes meeting specifications? Can use process capability ratios (PCRs) to determine thisTwo-sided limitsOne-sided limitsAccounts for a process being off-target.T is the target. Usually, T is the midpointbetween USL and LSLThese assume your process iscentered, and works best fornormally distributed data.Works best for normallydistributed data19If data not normally distributed, try a Box-Cox transformation.Return to Contents
CAPABILITYANALYSISYou must specifyUSL, LSL, or both.If data notnormallydistributed, youcan use atransformation20Return to Contents
CAPABILITY ANALYSISUse “Options” to add a target. Canchange the natural tolerance limits,but 6 is most common.Interpretation:(two-sided)CP 2 excellentCP 1.33 goodSame for CPK and CPM(one-sided)CPU or CPL 1.25 good21Return to Contents
CAPABILITY ANALYSISCan also performcapability analysisusing AssistantUse these optionswith the P, C, andU Charts.22Return to Contents
REFERENCES Khan, R. M. (2013). Problem solving anddata analysis using minitab: A clear and easyguide to six sigma methodology (1st ed.).West Sussex, United Kingdom: Wiley.http://en.wikipedia.org/wiki/Control ol-charts/a-guide-to-controlcharts/23Return to Contents
Two ways to create control charts in Minitab 1. Stat Control Charts 2. Assistant Control Charts Note: Assistant only performs 6 tests 1, 2, and 7 from page 5 Return to Types of Control Chart . XBAR-R CHART 7 If all your samples are the same size, you can enter in the number here. If samples are not the same size, create a “Subgroup” column in your data. The subgroup column should indicate .