Transcription
RIFE - 26Radioactivity in Food andthe Environment, 2020www.daera-ni.gov.uk2021
ENVIRONMENT AGENCYFOOD STANDARDS AGENCYFOOD STANDARDS SCOTLANDNATURAL RESOURCES WALESNORTHERN IRELAND ENVIRONMENT AGENCYSCOTTISH ENVIRONMENT PROTECTION AGENCYRadioactivity in Foodand the Environment, 2020RIFE 26November 2021
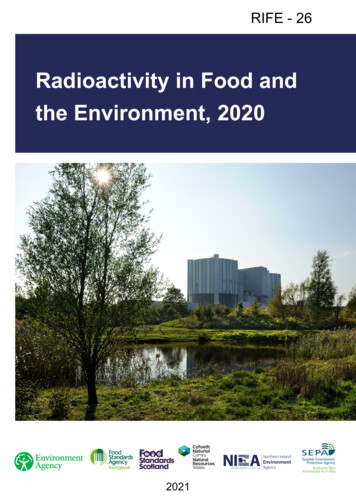
This report was compiled by theCentre for Environment, Fisheries andAquaculture Science on behalf of theEnvironment Agency, Food StandardsAgency, Food Standards Scotland,Natural Resources Wales, NorthernIreland Environment Agency and theScottish Environment Protection Agency.Printed on paper made from a minimum75% de-inked post-consumer waste.Front cover photograph: Oldburynuclear power station. Reproduced withkind permission of the EnvironmentAgency.Inside cover photograph: Reproducedwith kind permission of University ofStirling/SEPA. Crown Copyright, 2021This information is licensed under the Open Government Licence v3.0. To view thislicence, visit cence/This publication is available rts/Requests for printed copies, supporting documents and for other information should beaddressed to: in England and Wales, Radiological Monitoring and Assessment Team of theEnvironment Agency (enquiries@environment-agency.gov.uk),Food Policy Division of the Food Standards Agency (radiation@food.gov.uk)or Natural Resources Wales (enquiries@naturalresourceswales.gov.uk) in Scotland, the Radioactive Substances Unit of SEPA (radiologicalmonitoring@sepa.org.uk) or Food Standards Scotland (will.munro@fss.scot) and in Northern Ireland, the Industrial Pollution and Radiochemical Inspectorate of NIEA(IPRI@daera-ni-gov.uk)
ForewordThe UK’s environmental regulators and food safety agencies are delighted to presentthe 26th edition of the Radioactivity in Food and the Environment (RIFE) report.Radioactive substances and radiation have had many beneficial uses including theiruse in medicine, hospitals and in power generation. They are unlikely to be harmfulif controlled in the right way. Suitable regulation aims to ensure these benefits, whilstkeeping people and the environment safe. Our combined independent monitoring ofradioactivity in food and the environment is an important part of our regulatory processand fulfils a vital role in providing reassurance to members of the public.In common with previous issues of this report, RIFE 26 sets out the findings of themonitoring programmes of radioactivity in food and the environment carried out in2020 throughout the UK by the Environment Agency, Food Standards Agency, FoodStandards Scotland, Northern Ireland Environment Agency, Natural Resources Walesand the Scottish Environment Protection Agency.The monitoring results and subsequent assessments presented in this reportdemonstrate that radioactivity in food and the environment is safe. The exposure ofmembers of the public to radiation resulting from authorised discharges of radioactivewaste and direct radiation near nuclear and non-nuclear sites was well below legal limitsin 2020.The RIFE monitoring programme supports the requirements of the permitting legislationacross the UK, together with a number of other national and international agreements,policies, regulations and standards.Following its withdrawal from the European Union on 31 January 2020, the UK leftthe European Atomic Energy Community (Euratom) which provides a frameworkfor cooperation between EU Member States in the civil nuclear sector. The UK hasimplemented Euratom Regulations and Directives into UK domestic law and agreeda Nuclear Cooperation Agreement (NCA) with the EU, ensuring both parties continueworking together on civil nuclear matters including safeguards, safety and security.The COVID-19 pandemic in 2020 has led to unprecedented challenges to the RIFEprogramme. Despite this, the RIFE partners and their contractors have endeavoured tocarry out sampling and monitoring programmes this year.Foreword3
General SummaryRadioactivity is all around us. It occurs naturally in the earth’s crust, and it can be foundin the food we eat, the water we drink and the air we breathe. We are also exposed toman-made radioactivity, such as in medical applications used in hospitals and nuclearpower. It is a legal requirement to make sure the amount of man-made radioactivity thatpeople are exposed to from discharges is kept within a safe limit. Around the world,strict regulations and recommendations are in place to protect the general public andthe environment.In the UK, the exposure to man-made radioactivity in the environment mainly comesfrom permitted or authorised releases from UK nuclear sites. In addition to these sites,there are other users of radioactivity, such as hospitals, research or industrial facilities.These other facilities are generally known as the non-nuclear industries. Releasesfrom hospital and research sites are significantly lower than for nuclear sites. TheRadioactivity in Food and the Environment (RIFE) report is published each year bythe environmental regulators and food standards agencies. The report brings togetherall the results of monitoring of radioactivity in food and the environment by the RIFEpartners (Environment Agency, Food Standards Agency, Food Standards Scotland,Northern Ireland Environment Agency, Natural Resources Wales and the ScottishEnvironment Protection Agency).The main aim of the RIFE programme is to monitor the environment and the dietof people who live or work near nuclear and selected non-nuclear sites. From thismonitoring, we can estimate the amount of radioactivity the general public is exposedto, and particularly to the groups of people who are most exposed because of their age,diet, location or lifestyle.An additional comparison can be made with the exposure from natural radioactivityusing a different approach to those estimated for people who live or work near nuclearand other sites. Public Health England has published estimates of exposures to the UKpopulation from naturally occurring and man-made sources of radioactivity. Most recentvalues show that naturally occurring sources, particularly radon gas, accounted foraround 84% of the exposure from all sources of radioactivity. Man-made radioactivity inthe environment, from the nuclear industry and from past testing of nuclear weapons,accounted for less than 0.2% of the exposure to the UK population.4General Summary
The headlines from the 2020 RIFE programme are:For all sites exposure of the public from all sources of man-made radioactivity in food andthe environment was low and well within the legal limit of 1 millisievert per year1,demonstrating that radioactivity in food and the environment is safe overall, between 2019 and 2020 there were no major changes to the radioactivitymeasured in food and the environmentFor nuclear sites in 2020, people living around the Cumbrian coast (near Sellafield), Capenhurstand Amersham were the most exposed from releases of radioactivity. The highestexposure was 31% of the legal limit in 2020 due to people eating locally producedseafood around the Cumbrian coast, and up from 25% of the legal limit in 2019 in Scotland, people eating food collected from areas along the Dumfries andGalloway coastline were the most exposed from releases of radioactivity. Theexposure in 2020 was approximately 3% of the legal limit, and as in previous years,this was mostly due to the effects of past discharges from the Sellafield site the highest exposure in Wales was for those people living near the formerTrawsfynydd nuclear power station, which is being decommissioned. This was due tothem consuming locally produced food (milk), containing radioactivity released frompast discharges from the station. The exposure was approximately 4% of the legallimitFor other areas in Northern Ireland, exposure of the public from man-made radioactivity in 2020 wasestimated to be less than 1% of the legal limit a survey on the Channel Islands confirmed that the radiation exposure due todischarges from the French fuel reprocessing plant at La Hague and other localsources was less than 0.5% of the legal limit food and sources of public drinking water that make up a general diet for peoplewere analysed for radioactivity across the UK, results show that the radiationexposure from man-made radionuclides in people’s general diet was very small (lessthan 0.5% of the legal limit) in 2020Overall, between 2019 and 2020 there have been no major changes in radioactivityin samples measured around UK nuclear sites and other locations remote from thesesites. Exposure from all sources of man-made radioactivity to members of the publicwas well below legal limits, demonstrating that radioactivity in food and the environmentis safe.On average our radiation exposure, mostly due to natural sources, amounts to about 2.3 millisieverts (mSv) peryear.1General Summary5
ContentsPageForeword 3General Summary 4List of Tables 9List of Figures 14Technical Summary 181. Introduction 291.1 Scope and purpose of the monitoring programmes 291.2 Coronavirus (COVID-19) Impacts in 2020 331.3 Summary of radiation doses 351.3.1 The assessment process 351.3.2 ‘Total dose’ results for 2020 371.3.3 ‘Total dose’ trends 381.3.4 Source specific dose results for 2020 381.3.5 Protecting the environment 411.4 Sources of radiation exposure 421.4.1 Radioactive waste disposal from nuclear licensed sites 421.4.2 UK radioactive discharges (International agreements and nuclear new build) 451.4.3 Managing radioactive liabilities in the UK 491.4.4 Solid radioactive waste disposal at sea 521.4.5 Other sources of radioactivity 532. Nuclear fuel production and reprocessing 2.1 Capenhurst, Cheshire 2.2 Springfields, Lancashire 2.3 Sellafield, Cumbria 2.3.1 Doses to the public 2.3.2 Gaseous discharges 2.3.3 Liquid discharges 6Contents63656874768687
3. Nuclear Power Stations 3.1 Operating sites 3.1.1 Dungeness, Kent 3.1.2 Hartlepool, County Durham 3.1.3 Heysham, Lancashire 3.1.4 Hinkley Point, Somerset 3.1.5 Hunterston, North Ayrshire 3.1.6 Sizewell, Suffolk 3.1.7 Torness, East Lothian 3.2 Decommissioning sites 3.2.1 Berkeley, Gloucestershire and Oldbury, South Gloucestershire 3.2.2 Bradwell, Essex 3.2.3 Chapelcross, Dumfries and Galloway 3.2.4 Trawsfynydd, Gwynedd 3.2.5 Wylfa, Isle of Anglesey 1351381381421441461481511531551551571581611644. Research and radiochemical production establishments 4.1 Dounreay, Highland 4.2 Grove Centre, Amersham, Buckinghamshire 4.3 Harwell, Oxfordshire 4.4 Maynard Centre, Cardiff 4.5 Winfrith, Dorset 4.6 Minor sites 4.6.1 Culham, Oxfordshire 4.6.2 Imperial College Reactor Centre, Ascot, Berkshire 1931942012042062102132132135. Defence establishments 5.1 Aldermaston, Berkshire 5.2 Barrow, Cumbria 5.3 Derby, Derbyshire 5.4 Devonport, Devon 5.5 Faslane and Coulport, Argyll and Bute 5.6 Holy Loch, Argyll and Bute 5.7 Rosyth, Fife 5.8 Vulcan NRTE, Highland 223224226227228229231231233Contents7
86. Industrial, landfill, legacy and other non-nuclear sites 6.1 Low Level Waste Repository near Drigg, Cumbria 6.2 Metals Recycling Facility, Lillyhall, Cumbria 6.3 Other landfill sites 6.4 Past phosphate processing, Whitehaven, Cumbria 6.5 Former military airbase, Dalgety Bay, Fife 6.6 Former military airbase, Kinloss Barracks, Moray 6.7 Other non-nuclear sites 2412412442442472512532547. Regional monitoring 7.1 Channel Islands 7.2 Isle of Man 7.3 Northern Ireland 7.4 General diet 7.5 Milk 7.6 Crops 7.7 Airborne particulate, rain, freshwater and groundwater 7.8 Overseas incidents 7.9 Seawater surveys 2632632642642662672682682692718. References 289Appendix 1. Sampling, measurement, presentation and assessmentmethods and data 315Appendix 2. Disposals of radioactive waste 316Appendix 3. Abbreviations and glossary 327Appendix 4. Research in support of the monitoring programmes 333Contents
List of TablesTechnical summarySummary Table S ‘Total doses’ due to all sources at major UK sites, 2020 201. IntroductionTable 1.1Individual doses - direct radiation pathway, 2020* Table 1.2‘Total doses’ integrated across pathways, 2020 Table 1.2continued Table 1.3Trends in ‘total doses’ (mSv) from all sources Table 1.4Source specific doses due to discharges of radioactive waste in theUnited Kingdom, 2020 2. Nuclear fuel production and reprocessingTable 2.1Individual doses - Capenhurst and Springfields, 2020 Table 2.2(a) Concentrations of radionuclides in food and the environment nearCapenhurst, 2020 Table 2.2(b) Monitoring of radiation dose rates near Capenhurst, 2020 Table 2.3(a) Concentrations of radionuclides in food and the environment nearSpringfields, 2020 Table 2.3(b) Monitoring of radiation dose rates near Springfields, 2020 Table 2.4Concentrations of radionuclides in terrestrial food and theenvironment near Sellafield, 2020 Table 2.5Beta/gamma radioactivity in fish from the Irish Sea vicinity andfurther afield, 2020 Table 2.6Beta/gamma radioactivity in shellfish from the Irish Sea vicinity andfurther afield, 2020 Table 2.7Concentrations of transuranic radionuclides in fish and shellfishfrom the Irish Sea vicinity and further afield, 2020 Table 2.8Concentrations of radionuclides in sediment from the Cumbriancoast and further afield, 2020 Table 2.9Gamma radiation dose rates over areas of the Cumbrian coast andfurther afield, 2020 Table 2.10Beta radiation dose rates over intertidal areas of the Cumbriancoast, 2020 Table 2.11Concentrations of radionuclides in aquatic plants from theCumbrian coast and further afield, 2020 Table 2.12Concentrations of radionuclides in terrestrial food and theenvironment near Ravenglass, 2020 31List of Tables9
Table 2.13Table 2.14Table 2.15Table 2.16Concentrations of radionuclides in surface waters from WestCumbria, 2020 Concentrations of radionuclides in road drain sediments fromWhitehaven and Seascale, 2020 Doses from artificial radionuclides in the Irish Sea, 2007-2020 Individual radiation exposures, Sellafield, 2020 3. Nuclear Power StationsTable 3.1Individual doses - nuclear power stations, 2020 Table 3.2(a) Concentrations of radionuclides in food and the environment nearDungeness nuclear power stations, 2020 Table 3.2(b) Monitoring of radiation dose rates near Dungeness nuclear powerstations, 2020 Table 3.3(a) Concentrations of radionuclides in food and the environment nearHartlepool nuclear power station, 2020 Table 3.3(b) Monitoring of radiation dose rates near Hartlepool nuclear powerstation, 2020 Table 3.4(a) Concentrations of radionuclides in food and the environment nearHeysham nuclear power stations, 2020 Table 3.4(b) Monitoring of radiation dose rates near Heysham nuclear powerstations, 2020 Table 3.5(a) Concentrations of radionuclides in food and the environment nearHinkley Point nuclear power stations, 2020 Table 3.5(b) Monitoring of radiation dose rates near Hinkley Point nuclear powerstations, 2020 Table 3.6(a) Concentrations of radionuclides in food and the environment nearHunterston nuclear power stations, 2020 Table 3.6(b) Monitoring of radiation dose rates near Hunterston nuclear powerstations, 2020 Table 3.6(c) Radioactivity in air near Hunterston nuclear power stations, 2020 Table 3.7(a) Concentrations of radionuclides in food and the environment nearSizewell nuclear power stations, 2020 Table 3.7(b) Monitoring of radiation dose rates near Sizewell nuclear powerstations, 2020 Table 3.8(a) Concentrations of radionuclides in food and the environment nearTorness nuclear power station, 2020 Table 3.8(b) Monitoring of radiation dose rates near Torness nuclear powerstation, 2020 Table 3.8(c) Radioactivity in air near Torness nuclear power station, 2020 Table 3.9(a) Concentrations of radionuclides in food and the environment nearBerkeley and Oldbury nuclear power stations, 2020 10List of 9179180181181183183184
Table 3.9(b)Table 3.10(a)Table 3.10(b)Table 3.11(a)Table 3.11(b)Table 3.11(c)Table 3.12(a)Table 3.12(b)Table 3.13(a)Table 3.13(b)Monitoring of radiation dose rates near Berkeley and Oldburynuclear power stations, 2020 185Concentrations of radionuclides in food and the environment nearBradwell nuclear power station, 2020 186Monitoring of radiation dose rates near Bradwell nuclear powerstation, 2020 187Concentrations of radionuclides in food and the environment nearChapelcross nuclear power station, 2020 188Monitoring of radiation dose rates near Chapelcross nuclear powerstation, 2020 189Radioactivity in air near Chapelcross nuclear power station, 2020 189Concentrations of radionuclides in food and the environment nearTrawsfynydd nuclear power station, 2020 190Monitoring of radiation dose rates near Trawsfynydd nuclear powerstation, 2020 191Concentrations of radionuclides in food and the environment nearWylfa nuclear power station, 2020 192Monitoring of radiation dose rates near Wylfa nuclear power station,2020 1924. Research and radiochemical production establishmentsTable 4.1Individual doses - Research and radiochemical production sites,2020 215Table 4.2(a) Concentrations of radionuclides in food and the environment nearDounreay, 2020 216Table 4.2(b) Monitoring of radiation dose rates near Dounreay, 2020 218Table 4.2(c) Radioactivity in air near Dounreay, 2020 218Table 4.3(a) Concentrations of radionuclides in food and the environment nearAmersham, 2020 219Table 4.3(b) Monitoring of radiation dose rates near Amersham, 2020 219Table 4.4Concentrations of radionuclides in food and the environment nearHarwell, 2020 220Table 4.5Concentrations of radionuclides in food and the environment nearCardiff, 2020 220Table 4.6(a) Concentrations of radionuclides in food and the environment nearWinfrith, 2020 221Table 4.6(b) Monitoring of radiation dose rates near Winfrith, 2020 221Table 4.7Concentrations of radionuclides in the environment near Culham,2020 222List of Tables11
5. Defence establishmentsTable 5.1Individual doses - defence sites, 2020 235Table 5.2(a) Concentrations of radionuclides in food and the environment nearAldermaston, 2020 236Table 5.2(b) Monitoring of radiation dose rates near Aldermaston, 2020 237Table 5.3(a) Concentrations of radionuclides in food and the environment neardefence establishments, 2020 238Table 5.3(b) Monitoring of radiation dose rates near defence establishments, 2020 2406. Industrial, landfill, legacy and other non-nuclear sitesTable 6.1Individual doses - industrial and landfill sites, 2020 256Table 6.2Concentrations of radionuclides in terrestrial food and theenvironment near Drigg, 2020 257Table 6.3Concentrations of radionuclides in surface water leachate fromlandfill sites in Scotland, 2020 258Table 6.4Concentrations of radionuclides in water from landfill sites inEngland and Wales, 2020 258Table 6.5Concentrations of radionuclides in water near the East NorthantsResource Management Facility landfill site, 2020 259Table 6.6Concentrations of naturally occurring radionuclides in theenvironment, 2020 259Table 6.7Discharges of gaseous radioactive wastes from non-nuclearestablishments in England, Northern Ireland and Wales, 2020 260Table 6.8Discharges of liquid radioactive waste from non-nuclearestablishments in England, Northern Ireland and Wales, 2020 261Table 6.9Monitoring in the Firth of Forth, River Clyde and near Glasgow, 2020 2627. Regional monitoringTable 7.1Concentrations of radionuclides in seafood and the environmentnear the Channel Islands, 2020 278Table 7.2(a) Concentrations of radionuclides in seafood and the environment inNorthern Ireland, 2020 279Table 7.2(b) Monitoring of radiation dose rates in Northern Ireland, 2020 281Table 7.3Concentrations of radionuclides in diet, 2020 282Table 7.4Concentrations of radionuclides in milk remote from nuclear sites,2020 283Table 7.5Concentrations of radionuclides in rainwater and air, 2020 284Table 7.6Concentrations of radionuclides in sources of drinking water inScotland, 2020 285Table 7.7Concentrations of radionuclides in sources of drinking water inEngland and Wales, 2020 28612List of Tables
Table 7.8Table 7.9Table 7.10Concentrations of radionuclides in sources of drinking water inNorthern Ireland, 2020 Doses from radionuclides in drinking water, 2020 Concentrations of radionuclides in seawater, 2020 287287288Appendix 2. Disposals of radioactive wasteTable A2.1Principal discharges of gaseous radioactive wastes from nuclearestablishments in the United Kingdom, 2020 316Table A2.2Principal discharges of liquid radioactive waste from nuclearestablishments in the United Kingdom, 2020 320Table A2.3Disposals and receipt with the intention of disposal of solidradioactive waste at nuclear establishments in the United Kingdom,Financial Year 2020/21 324Table A2.4Solid waste transfers from nuclear establishments in Scotland, 2020* 325Table A2.5Summary of unintended leakages, spillages, emissions or unusualfindings of radioactive substances from nuclear licensed sites in theUK in 2020 326Appendix 4. Research in support of the monitoring programmesTable A4.1Extramural Projects 334List of Tables13
List of FiguresTechnical SummaryFigure S1‘Total doses’ in the UK due to radioactive waste discharges anddirect radiation, 2020. Figure S2Average UK population exposure from natural and man-madesources of radioactivity 1. IntroductionFigure 1.1The dose assessment process for major nuclear sites Figure 1.2‘Total doses’ around the UK’s nuclear sites due to radioactive wastedischarges and direct radiation (2009–2020) Figure 1.3Source specific doses in the UK, 2020 Figure 1.4Principal nuclear site sources of radioactive waste disposal in theUK, 2020 Figure 1.5Potential sites for new nuclear power stations 192835394043482. Nuclear fuel production and reprocessingFigure 2.1‘Total dose’ at nuclear fuel production and reprocessing sites,2009–2020 66Figure 2.2Discharges of gaseous and liquid radioactive wastesand monitoring of the environment, Capenhurst (2009–2020) 68Figure 2.3Monitoring locations at Springfields, 2020 69Figure 2.4Source specific dose to houseboat occupants and dose rates atSpringfields (2009–2020) 70Figure 2.5Discharges of gaseous and liquid radioactive wastes andmonitoring of the environment, Springfields 2009–2020 72Figure 2.6Contributions to ‘total dose’ from all sources at Sellafield, 2009–2020 78Figure 2.7Contributions from nuclear and non-nuclear industries to ‘total dose’from all sources at Sellafield, 2009–2020. 79Figure 2.8Contributions from each pathway of exposure to the ‘total dose’from all sources, 2016–2020 80Figure 2.9Contributions to ‘total dose’ from gaseous discharge and directradiation sources at Sellafield, 2009–2020 81Figure 2.10Discharges of gaseous wastes and monitoring of milk nearSellafield, 2009–2020 88Figure 2.11Technetium-99 in UK seaweed 89Figure 2.12Technetium-99 in UK seaweed (‘Fucus vesiculosus’) from Sellafieldliquid discharges between, 1991–2020 9014List of Figures
Figure 2.13Figure 2.14Figure 2.15Figure 2.16Figure 2.17Figure 2.18Figure 2.19Figure 2.20Figure 2.21Figure 2.22Figure 2.23Figure 2.24Figure 2.25Figure 2.26Monitoring locations in Cumbria, 2020 92Monitoring locations at Sellafield, 2020 93Carbon-14 liquid discharge from Sellafield and concentrations inplaice, lobsters and winkles near Sellafield, 2009–2020 94Cobalt-60 liquid discharge from Sellafield and concentrations inplaice, lobsters and winkles near Sellafield, 2009–2020 94Technetium-99 liquid discharge from Sellafield and concentrationsin plaice, lobsters and winkles near Sellafield, 2009–2020 95Caesium-137 liquid discharge from Sellafield and concentrations inplaice, lobsters and winkles near Sellafield, 2009–2020 95Plutonium-239 240 liquid discharge from Sellafield andconcentrations in plaice, lobsters and winkles near Sellafield, 2009–2020 96Americium-241 liquid discharge from Sellafield and concentrationsin plaice, lobsters and winkles near Sellafield, 2009–2020 96Caesium-137 liquid discharge from Sellafield and concentration inmud at Ravenglass, 1991–2020 98Plutonium-alpha liquid discharge from Sellafield andplutonium-239 240 concentration in mud at Ravenglass, 1991–2020 99Cobalt-60 liquid discharge from Sellafield and concentration in mudat Ravenglass, 1991–2020 99Americium-241 liquid discharge from Sellafield and concentration inmud at Ravenglass, 1991–2020 99Concentrations of americium-241 and caesium-137 in coastalsediments in North West England,North Wales and South WestScotland between 1998–2020 102Gamma dose rates above fine coastal sediments (mud and saltmarshes) in North West England, North Wales and South WestScotland between 2009–2020 1033. Nuclear Power StationsFigure 3.1‘Total dose’ at nuclear power stations, 2009–2020. (Small dosesless than or equal to 0.005 mSv are recorded as being 0.005 mSv) 139Figure 3.2Caesium-137 concentration in marine sediments near nuclearpower stations between 2009–2020 141Figure 3.3Caesium-137 liquid discharge from Trawsfynydd and concentrationin sediment in Trawsfynydd lake, 1991–2020 1634. Research and radiochemical production establishmentsFigure 4.1‘Total dose’ at research establishments, 2008–2019. Figure 4.2Monitoring locations at Dounreay, 2020 197198List of Figures15
Figure 4.3Figure 4.4Figure 4.5Figure 4.6Figure 4.7Figure 4.8Figure 4.9Figure 4.10Monitoring locations, discharges of gaseous and liquid radioactivewastes and monitoring of the environment in the north of Scotland,2020 199Monitoring locations at Thames sites, 2020 202Trends in liquid discharges of caesium-137 and cobalt-60 fromHarwell, Oxfordshire 2009–2020 205Tritium liquid discharge from Cardiff and mean concentrations insediment near Cardiff, 2000–2020 208Tritium liquid discharge from Cardiff and mean concentrations infish and molluscs near Cardiff, 2009–2020 209Carbon-14 liquid discharge from Cardiff and mean concentrations infish and molluscs near Cardiff, 2009–2020 209Monitoring locations at Winfrith, 2020 (not including farms) 211Trends in liquid discharges of tritium and alpha emittingradionuclides from Winfrith, Dorset 2009–2020 2125. Defence establishmentsFigure 5.1Trends in liquid discharges of tritium from Aldermaston, Berkshire2009–2020 225Figure 5.2Trends in liquid discharges of tritium and cobalt-60 from Devonport,Devon 2009–2020 2296. Industrial, landfill, legacy and other non-nuclear sitesFigure 6.1Landfill sites monitored in 2020 Figure 6.2Polonium-210 discharge from Whitehaven and concentration inwinkles at Parton, 1990–2020 Figure 6.3Polonium-210 discharge from Whitehaven and concentration incrabs at Parton, 1990–2020 Figure 6.4Polonium-210 discharge from Whitehaven and concentration inlobsters at Parton, 1990–2020 Figure 6.5Trend in ‘total dose’ to seafood consumers from naturally-occurringradionuclides near Whitehaven, 2009–2020 7. Regional monitoringFigure 7.1Monitoring locations in Northern Ireland, 2020 Figure 7.2Concentrations of americium-241 and caesium-137 in coastalsediments in Northern Ireland, 2002–2020 Figure 7.3Drinking water sampling locations, 2020 Figure 7.4Concentrations (Bq l-1) of caesium-137 in surface water from theNorth Sea, September–October 2020 Figure 7.5Concentrations (Bq l-1) of caesium-137 in surface water from theEnglish Channel, March–April 2020 16List of Figures245249249250251265266269272273
Figure 7.6Figure 7.7Figure 7.8Figure 7.9Concentrations (Bq l-1) of tritium in surface water from the NorthSea, September–October 2020 Concentrations (Bq l-1) of tritium in surface water from the BristolChannel, September–October 2020 Concentrations (Bq l-1) of tritium in surface water from the EnglishChannel, March–April 2020 Concentration of caesium-137 in the Irish Sea, North Sea and inshoreline seawater close to Sellafield at St. Bees 274275275277List of Figures17
Technical SummaryThis section is divided into the following topics to highlight the scope of this report.These are: radiation exposures (doses) to people living near UK nuclear licensed sitesradioactivity concentrations in samples collected near UK nuclear licensed sitesexternal dose rates measured near UK nuclear licensed sitesUK nuclear licensed site incidents and non-routine surveyshabits surveys near UK nuclear licensed sitesmonitoring of radioactivity at locations remote from UK nuclear licensed sites(overseas incidents, non-nuclear sites and regional monitoring across the UK)the environmental radioactivity monitoring programmesRadiation exposure (doses) to people living near UK nuclear licensed sitesRadiation doses to people living near nuclear licensed sites are assessed usingdata from monitoring of radioactivity in food and the environment. Radionuclideconcentrations, dose rates, and information on the habits of people living near thesites are used to estimate doses. Where monitoring data are not available, someenvironmental concentrations are estimated by environmental transfer modelling ofreported discharges. People’s exposure to radiation (doses) can vary from year toyear, due to changes in radionuclide concentrations and external dose rates. Changesin habits data and information, in particular food consumption, can also cause theestimates of dose to vary year on year.The dose quantity presented in this summary is known as the ‘total dose’. This is madeup of contributions from all sources of radioactivity from man-made processes. Sourcespecific dose assessments are also carried out in some cases to provide additionalinformation and to compare with the ‘total dose’ assessment method.Figure S1 and Table S show the assessed ‘total doses’ in 2020 due to the combinedeffects of authorised/permitted waste discharges and direct exposure from the site(‘direct radiation‘) on those people most exposed to radiation near all major nuclearlicensed sites in the UK.18Technical Summary
4.6.2 Imperial College Reactor Centre, Ascot, Berkshire 213 5. Defence establishments 223 5.1 Aldermaston, Berkshire 224 5.2 Barrow, Cumbria 226 5.3 Derby, Derbyshire 227 5.4 Devonport, Devon 228 5.5 Faslane and Coulport, Argyll and Bute 229 5.6 Holy Loch, Argyll and Bute 231 5.7 Rosyth, Fife 231 5.8 Vulcan NRTE, Highland 233


