Transcription
Chapter 6HR Metrics andWorkforce AnalyticsKevin D. Carlson and Michael J. KavanaghEDITORS’ NOTEThe capacity to manage is limited by the accessible information in our possession.Research on goal setting confirms that being able to articulate the specific goal for a taskand the level of the goal we want to achieve enhances performance of that task. Betterinformation about the expectations of customers, the actions of competitors, and thestate of the economy provides strong support for the strategic direction of organizations.Information about levels of output, for example, numbers of defects and efficiency ofprocesses, positions line managers to produce high-quality products in the right amountsat the right time to meet customer needs. The same is true for the effective managementof human capital in organizations. As discussed in this chapter, effective approaches tothe measurement of human capital and the impact of people on organization processes,for example, HR programs such as recruiting, will enable both HRM professionals andline managers to utilize the human capital in organizations effectively. This measurementis accomplished by focusing on the development of systems of workforce analytics andsupporting HR metrics that meet the needs of organization decision makers. This chapter offers a brief history of the efforts involved in the development of HR metrics andworkforce analytics and of how these efforts have been enhanced by the advent ofintegrated human resource information systems.1 From benchmarking to operationalexperiments, the HRIS field is rapidly evolving on many fronts. These advances arechanging how HR metrics and analytics are used in organizations and their impact onorganization effectiveness. The use of HR metrics and workforce analytics will help managers and organizations balance the costs and benefits consequences of decisions.These cost-benefit analyses are covered in Chapter 7.150
Chapter 6 HR Metrics and Workforce AnalyticsCHAPTER OBJECTIVESAfter completing this chapter, you should be able to Discuss the factors that have led to increased organizational interest in HR metrics andworkforce analytics Discuss why the information from numeric systems like HR metrics and workforceanalytics2 do not generate any return on investment (ROI) unless they lead to differentand better decision making Discuss the difference between metrics and analytics Describe the limitations of the traditional HR metrics Discuss the historical role of benchmarking and its strengths and weakness today Discuss the roles that activities such as data mining, predictive analytics, and operational experiments play in increasing organizational effectiveness Discuss the differences between metrics and analytics for HR efficiency, operationaleffectiveness, and organizational realignment, and offer examples of each Describe which characteristics of HR metrics and workforce analytics are most likely tohave an organizational impactHRIS IN ACTIONWhen Dan Hilbert arrived as Manager of Employment Services at Valero Energy inDecember 2002, he wasn’t quite sure what he wanted or needed to do. Coming froma background in operations, he was used to having information about the effectivenessof all current operations; yet, as he quickly learned, these data were not available for HRoperations and programs, nor were there systems in place to generate them. He recognizedthe potential value of having even simple descriptive statistics about the HR organization,its people, and its operations—to highlight potential opportunities and how changes inthese values could signal potential problems. However, since these data were not currentlyavailable or easily developed, he created a small team, consisting of one HR staff memberwho could help get access to data from the organization’s current systems and a graduatestudent with a statistical background, who was hired as a part-time employee. The team’sassignment was to collect data about the human capital in the organization in an effortto learn more about the organization and its people, which Dan was now charged withsupporting.The team’s analysis highlighted a unique characteristic of the Valero workforce—allof its refinery managers were all at least 55 years old. This meant that these managers,each with long tenure in one of the most critical positions for assuring operating success,would be eligible to retire in fewer than ten years. Further, given that these managers hadall joined the company at roughly the same time and had held these refinery managerpositions for many years, the promotion pipeline for succession to this position was151
152P A R T I I D E T E R M I N I N G H R I S N E E D Slimited. In other words, promising managers who had joined the organization at lowermanagerial positions decided to leave the company when it was clear that upward opportunities were limited.When Hilbert presented the results of this analysis and his conclusions to seniormanagers, they were shocked. No one had considered this issue of the aging of refinerymanagers, and, likely, management would not have become aware of the situation untilthe refinery managers began to retire. By then, it would have been too late to act to getimmediate replacements. Interestingly, as Valero success increased and the stock priceincreased, the retirement age lowered, compounding the problem. The pipeline of trainedmanagers capable of filling these positions internally would not have been sufficient tomeet the demand created by the mass retirements, and the time to train them as refinery managers was lengthy. As a result, the computation of relatively simple metrics andanalytics provided new insights on the current retirement status of employees. This dataallowed management to engage in the training and development needed to build internalbench strength for this critical position prior to these managers retiring, likely saving therefiner millions in salary expense and reduced refinery performance.INTRODUCTIONHuman resources (HR) metrics and workforce analytics have become a hottopic in organizations of all sizes. Interest is rising, and organizations are reachingout to learn more about metrics and analytics and how they can use them toimprove organizational effectiveness. Although the use of HR metrics and workforce analytics is not new, various factors have driven increased interest during theprevious decade. The most important driver has been the implementation of integrated HRIS in response to the “millennium problem” of Y2K (Year 2000). Theadoption of these systems shifted what had been primarily paper and pencil processes to electronic processes and, as a result, greatly increased the capacity oforganizations to access and examine transaction-level data.These new HRIS featured faster and more capable computers, improved connectivity through organizational networks and the Internet, and the earliest versions of user-friendly analytics software. These changes fundamentally altered thedynamics of human capital assessment in organizations, driving the marginal costof assessment lower while providing the potential for near real-time analysis anddistribution of information.In addition, the quality revolution that swept through U.S. manufacturing andservice firms in the 1980s and 1990s, including Total Quality Management(TQM), Six Sigma, and lean manufacturing, increased managers’ expectations
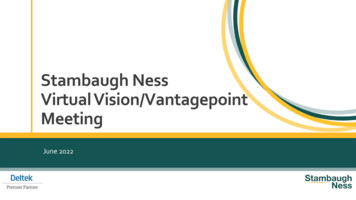
Chapter 6 HR Metrics and Workforce Analyticsabout the availability of organizational data and the capability of using this data togenerate analytics that could support managerial decisions. These factors, combined with recent and growing interest in evidence-based management, have produced a rapidly growing interest in HR metrics and workforce analytics.A BRIEF HISTORY OFHR METRICS AND ANALYTICSInterest in HR metrics and workforce analysis is not new. Systematic work onthe development of measures to capture the effectiveness of an organization’semployees can be traced as far back as the days of scientific management (Taylor,1911) and industrial and organizational psychology (Munsterberg, 1913). Methods of quantitative analysis and its use in decision making were developed duringthe build-up of both men and materiel occasioned by World War II. Further studyand development occurred during the great post-war industrial expansion in theUnited States that continued into the 1970s. In fact, many of the most common HRmetrics in existence today were first considered and developed during this period(e.g., Hawk, 1967).Many of the HR metrics most frequently used in organizations can be traced tothe pioneering work of Dr. Jac Fitz-enz and the early benchmarking work he conducted through the Saratoga Institute. In 1984, Fitz-enz published How to MeasureHuman Resources Management, currently in its third edition (Fitz-enz & Davidson,2002), which is still a highly valued overview of many HR metrics and the formulas used to calculate them. These metrics were developed through the joint effortsof the Saratoga Institute and the American Society for Personnel Administration(ASPA), the forerunner of the current Society for Human Resource Management(SHRM). This effort produced the set of 30 metrics listed in Table 6.1, which haveformed the foundation for the HRM benchmarking program conducted by theSaratoga Institute.Kaplan and Norton’s (1996) introduction of the balanced scorecard (seeChapter 10) further refined managers’ thinking about metrics. The balanced scorecard recognizes the limitations of organizations’ heavy reliance on financial indicators of performance. Such measures focus on what has already happened ratherthan providing managers information about what will happen. Balanced scorecards focus on developing leading indicators of performance from several important perspectives, including customer satisfaction, process effectiveness, andemployee development, as well as financial performance.153
154P A R T I I D E T E R M I N I N G H R I S N E E D STable 6.1 Measures in the Saratoga Institute/SHRM Human ResourcesEffectiveness ReportRevenue per EmployeeExpense per EmployeeCompensation as a Percentage of RevenueCompensation as a Percentage of ExpenseBenefit Cost as a Percentage of RevenueBenefit Cost as a Percentage of ExpenseBenefit Cost as a Percentage of CompensationRetiree Benefit Cost per RetireeRetiree Benefit Cost as a Percentage of ExpenseHires as a Percentage of Total EmployeesCost of HireTime to Fill JobsTime to Start JobsHR Department Expense as a Percentage of Company ExpenseHR Headcount Ratio—HR Employees: Company EmployeesHR Department Expense per Company EmployeeSupervisory Compensation PercentageWorkers’ Compensation Cost as a Percentage of ExpenseWorkers’ Compensation Cost per EmployeeWorkers’ Compensation Cost per ClaimAbsence RateInvoluntary SeparationVoluntary SeparationVoluntary Separation by Length of ServiceRatio of Offers Made to AcceptancesSOURCE: Adapted from Fitz-enz, J. (1995). How to Measure Human Resources Management, 2nd Edition. NewYork, NY: McGraw-Hill, Inc.About the same time, Huselid’s (1995) work on high performance work systemsdemonstrated that the systematic management of human resources was associatedwith significant differences in organizational effectiveness. This work providedevidence that human resource management did indeed have strategic potential.Becker, Huselid, and Ulrich (2001) helped bring these ideas together in the HR
Chapter 6 HR Metrics and Workforce Analyticsscorecard, which highlights how the alignment of HR activities with both corporatestrategy and activity improve organizational outcomes.CONTEMPORARY HR METRICSAND WORKFORCE ANALYTICSThe field of HR metrics and workforce analytics is currently in transition.During the previous 30 years, most medium to large organizations did engage insome HR assessment and analytics. But these efforts were not systematic. Duein part to the expense involved, they were conducted on only a sample of activities, and often for only a limited set of metrics. More recently, because of thedevelopment of strong computer-based communications infrastructures andgreater access to data through the adoption of integrated human resource information systems, organizations are engaging in more consistent and systematicreporting of HR metrics.Increased interest in human capital metrics and analytics work has resulted inmore organizations reporting a larger number of metrics more consistently. It isimportant to recognize that many organizations use metrics to measure or audittheir HR programs and activities. Historically, the use of such audit metrics tomeasure the effectiveness of HR was identified by Cascio (1987) and Fitz-enz andDavidson (2002). The Society for Human Resource Management has identified anumber of metrics that organizations can use to measure their HR effectiveness(SHRM, 2010). For example, absence rate can be calculated as follows: [(# daysabsent in month) divided by (Avg. # of employees during mo.) (# of workdays)] 100 (Hollmann, 2002; Kuzmits, 1979). Another useful metric from SHRM (2011)is cost per hire, which can be calculated as Cost Per Hire (CPH) the sum ofexternal costs (recruiting) and internal costs (training new employees) divided bythe total number of starts in a time period.There are also more detailed approaches for the measuring and benchmarkingof employees’ behaviors, such as absenteeism (Hollmann, 2002) and turnover(Cascio, 2000), as well as for creating HR metrics for programs such as employeeassistance and work-life programs (Cascio, 2000).Unfortunately, while the infrastructure supporting HR metrics and analytics hasundergone dramatic change in the last 20 years, the metrics themselves have not.Current computing operations are capable of capturing data on a wide range ofelectronically supported HR processes, extracting, analyzing, and then distributingthat information in real time to managers throughout the organization. Currentpopular HR metrics, however, were not developed with our current computing155
156P A R T I I D E T E R M I N I N G H R I S N E E D Sinfrastructure in mind. The Saratoga Institute’s early efforts in benchmarking wereprimarily conducted using paper-and-pencil processes. As a consequence, recognizing what data most organizations could easily and inexpensively gather playedan important role in identifying which metrics could reasonably be included inbenchmark studies. The emphasis on available data can be seen in the originalSaratoga metrics listed in Table 6.1. They focus on readily available data, mostof which came from accounting systems.Consequently, these metrics emphasize costs or easily calculated counts (e.g.,head count, turnover) that often serve as proxies for costs. Every managerial decision has cost and benefit consequences, whether we recognize them or not. As aresult, if our information systems only provide information about costs, they areof limited value to managers. Managers will try to use the information they areprovided; if we offer them only cost information but little information on benefits,costs are likely to become the primary driver of managerial decisions.Further, it is also common for metrics to be aggregated to the level of the organization. As such, they offer limited information that could be used to identify anddiagnose within-organization differences. Organizational turnover rates will beheavily influenced by the turnover rate in the organization’s dominant job category, masking any differences in turnover rates for jobs with fewer incumbents.Because the turnover data were extracted from the end of a specific time period,the reports provide feedback about previous activity. They only offer insights afterthe fact. This situation results in extended periods of time between potential problems and the opportunity for remedial responses by the organization. Change inboth the analyses conducted and the metrics utilized allow organizations to takeadvantage of today’s more capable infrastructure.THE MAIN OBJECTIVE OF HR METRICSAND WORKFORCE ANALYTICSDespite reporting more metrics with greater frequency to a wider group of managers, many HR professionals tasked with this reporting question whether theseefforts have had a significant impact on organization effectiveness. Often, theseindividuals report frustration with their inability to get managers to (a) tell themwhat information they need, (b) use the HR metrics information included in existing reports, or (c) even acknowledge receipt of the reports. These perceptionsrepresent a fundamental problem in the approach organizations take toward theutilization of metrics and analytics.Many managers perceive the increased interest in metrics and analytics assimply a mandate to compute and report more metrics. The assumption behind
Chapter 6 HR Metrics and Workforce Analyticsassessing and reporting HR metrics is that it results in better organizational performance. But it is not clear that generating and reporting more HR metrics willnecessarily result in better individual, unit, or organizational performance.HR metrics and analytics comprise an information system, and informationsystems can only have an impact on organizations if, as a result of the informationthey receive, managers make different and better decisions than they would havewithout that information. No information system, including HR metrics and analytics, generates any return on the investment unless managers change their decision behavior for the better. If managers do not make different and better decisionsas a result of the information reported to them, the time and effort expended inconducting and reporting HR metrics and analytics is wasted.The emphasis on improving managerial decisions changes the dynamics driving metrics and analytics assessment efforts; that is, it raises the bar. It is notsimply good enough to “do” metrics and analytics. These activities need to beapproached in a way that increases the possibility that access to the informationfrom these efforts will change managerial decisions, making them more effective.A fundamental problem is that many of the currently popular HR metrics do notprovide a clear impact on important managerial decisions. The challenge, therefore, is to identify metrics and analytics that provide managers with the information they need to make better decisions regarding the acquisition and deploymentof an organization’s human capital.USING HR METRICSAND WORKFORCE ANALYTICSHuman capital metrics has become an umbrella term that encompasses a wide rangeof activities and processes. There is a fundamental distinction between HR metricsand workforce analytics. Metrics are data (numbers) that reflect some descriptivedetail about given processes or outcomes, for example, success in recruiting newemployees. In the domain of human capital, these reflect characteristics of the organization’s HR programs and activities. Analytics refer to strategies for combiningdata elements into metrics and for examining relationships or changes in metrics.Understanding these combinations is done to inform managers about the current orchanging state of human capital in an organization in a way that can impact managerial decision making. The importance of this view is that the analytics an organization needs depend on the problems and opportunities that currently face its managers. This path leads to the metrics that the organization needs in order to computethese analyses. A number of important HR activities fall within HR metrics andworkforce analytics. Several of the most common are described briefly below.157
158P A R T I I D E T E R M I N I N G H R I S N E E D SReportingA substantial amount of effort in the study and practice of metrics and analyticshas focused on reporting. Reporting incorporates decisions about (a) what metricswill be reported; (b) how these metrics will be packaged; and (c) how, (d) when,and (e) to whom they should be reported. Effort has focused on attempting toidentify what metrics an organization should use. However, trying to identifyingwhat metrics should be reported without considering an organization’s problemsand opportunities misses the reasons for the metrics. How metrics should bereported focuses on depicting metrics for decision makers so that the “message”relevant to them has a greater probability of being understood. How questions dealwith choosing between distributing metrics to decision makers using e-mail orcreating opportunities for decision makers to extract metrics as needed. This latterapproach can be done by posting the metrics on company Web sites.When questions deal with the timing and frequency of metrics reports. In somecases, reporting is currently done annually, quarterly, or monthly. Some organizations are also considering the possibility of real-time updating for some metrics.To whom questions address who receives metrics data. To date, it is most commonfor metrics and analytics to be reported first to senior executives. However, thereis a growing recognition that managers at lower levels of the organization may beable to make more immediate use of the information contained in these data inorder to assist in tactical, operational decisions.DashboardsDashboards are an enriched component of reporting. Dashboards reflect effortsto align real-time analysis of organizational and HR processes as well as anincreased capacity to aggregate organizational data. Dashboards also contain business unit analyses to permit managers to drill down to examine metrics on severallevels within the organization. The dashboard allows users to maintain a currentsnapshot of key HR metrics.BenchmarkingThe Saratoga Institute’s benchmarking efforts were the first to develop information on standard HR metrics regarding the use and management of human capital.Benchmarking data is useful in that it provides insights into what is possible.However, a challenge in using HR metrics as benchmark data is that an organization’s human resource practices and the use of its HR staff reflect current challenges facing that organization. As a result, most organizations have anHR department, but the specific functions performed by these departments vary
Chapter 6 HR Metrics and Workforce Analyticswidely across organizations. Consequently, direct comparisons of HR benchmarking data from one’s own organization to data from other organizations may notprovide realistic guidelines for either goal setting or forecasting the potentialeffectiveness of remedial actions an organization might undertake.Data MiningInterest in data mining human capital information has been on the rise since theimplementation of integrated HRIS and digitized HRM processes. Data miningrefers to efforts to identify patterns that exist within data and that may identifyunrecognized causal mechanisms that can be used to enhance decision making. Toidentify these causal mechanisms, data mining uses correlation and multipleregression methods to identify patterns of relationships in extremely large datasets. An example would be the identification of a correlation between employee jobsatisfaction and employee turnover. Data mining has a number of important applications, but the caveat with its use is that it can also uncover spurious and nonsensical relationships (e.g., taller employees make better leaders; older employeeshave longer tenures).Predictive AnalysesPredictive analysis is the goal of many metrics and analytics efforts. Predictiveanalysis involves attempts to develop models of organizational systems that canbe used to predict future outcomes and understand the consequences of hypothetical changes in organizations, for example, a change in existing organizationalsystems. To continue the simple example above, if the organization discovered acorrelation between employee job satisfaction and turnover, HR could use thisdata to suggest modifications to the employees’ work situation or their benefits.Efforts to develop balanced scorecards are examples of elementary predictivesystems. They involve identifying leading indicators of important organizationaloutcomes and the nature of the relationships expected to lead to them. Engagingin efforts to test the assumptions in these models over time can lead to enhancements in the quality of the models’ underlying predictive analyses, either by identifying additional leading indicators or better specifying the nature of therelationships between predictors and outcomes.Operational ExperimentsThe evidence-based management movement argues that managers should basetheir decisions on data drawn from the organization and evidence about the actualfunctioning of its systems rather than using personal philosophies or untested159
160P A R T I I D E T E R M I N I N G H R I S N E E D Spersonal models or assumptions about “how things work.” One of the most effective methods for developing the evidence on which to base decisions is throughoperational experiments conducted within the organization. Ayres (2007) des cribeshow Google uses operational experiments to test the effectiveness of the ad wordsused on its Web site. Rather than simply relying on intuition or “expert judgment”about which ad wording is more effective, it creates an experiment. It configuresits site to alternate the presentation of competing ad text to visitors to its site andthen tracks the number of click-throughs on the ad for a period of time. Given thelarge number of daily hits, Google can get objective data on the effectiveness ofthe various ads in a relatively short time and then adopt the ad wording demonstrated to be most effective.Workforce ModelingWorkforce modeling attempts to understand how an organization’s human capitalneeds would change as a function of some expected change in the organization’senvironment. This change may be a shift in the demand for the organization’sproduct, entry into a new market, divestiture of one of the organization’s businesses, or a pending acquisition of or merger with another organization. Thisprocess involves establishing a human resources planning (HRP) program, whichis covered in more detail in Chapter 11.BETTER PROBLEM SOLVINGAND DECISION MAKINGIn organizations, decisions result in tactical choices. These choices may be amongalternative tactics to achieve specific outcomes or in response to specific problems. The choices could also involve a specific tactic to adopt a standard response,as compared trying something new, or to take no action at all. Making these decisions requires three things: (1) understanding the outcomes that one is attemptingto achieve, (2) understanding the factors that influence those outcomes and theircurrent states, and (3) knowing available tactical options and their costs. For anyinformation system, including an HRIS that can produce metrics and analytics,improving decision making requires that these sources of information influencedecision makers to choose to make different and better decisions.A Common and Troublesome ViewA common perspective adopted in many organizations is that data elements lead tometrics. These metrics can then be combined in various analyses that can then be
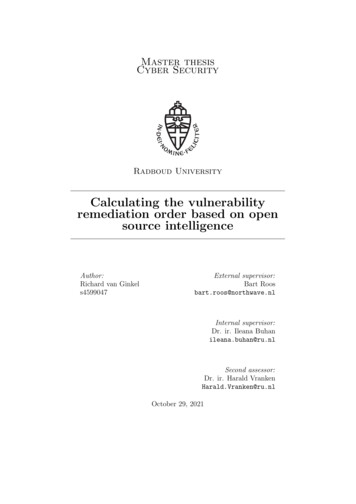
Chapter 6 HR Metrics and Workforce Analyticsreported to managers who use the information in these analyses to drive decisionmaking. This view was dominant in the development of many metrics and analyticsover the last decade. However, the problem with this approach is that it is not clearwhich data elements are relevant, and there is no basis for guiding how they shouldbe combined into metrics, or how those metrics should contribute to analytics.These types of approaches to metrics have two common and predictable outcomes.First, individuals tasked with developing and reporting HR metrics in organizationsstruggle to determine what metrics to report and how those metrics should be calculated. Second, as a result of the first outcome, these organizations subsequentlyreport large numbers of metrics, which ultimately have little or no impact on decision making and, therefore, offer no return to the organization.A more effective approach is to start with the problems or opportunities facedby the organization and develop an understanding of what information is likely tobe useful to managerial decisions. An understanding of these problems permitsorganizations to determine effectively the analytics that are most likely to be useful in improving organizational effectiveness. These analytics then determinewhich metrics are relevant to the analysis and which data elements need to beincorporated into the analysis. The difference in these two approaches is dramatic.The latter one is targeted at specific managerial decision situations while the firstone does not have this focus.Opportunity Domains of HR ExpertiseExcellence in human resources functioning requires three sets of expertise. Theseare depicted in Figure 6.1. First, an organization must have access to the knowledge in “centers of excellence” to potentially change the activities of HRM. Thisaccess to knowledge does not refer to information systems, but rather to the“know-how” required to deploy available human resource programs and tactics inrecruitment, selection, job design, development, motivation, compensation, performance management, retention, safety, benefits, and regulatory compliance toaccomplish the objectives of the organization and to improve organizational effectiveness. This knowledge exists in HR experts who understand new advancementsin these programs and activities, as well as how and when they might be employedto improve effectiveness. This HR expertise might exist within an organization’sfull-time staff, or it might be found in consultants hired on a contract basis to assistthe organization or in third party vendors who take on responsibility for improvingoutsourced organization processes.A second set of expe
Human resources (HR) metrics and workforce analytics have become a hot topic in organizations of all sizes. Interest is rising, and organizations are reaching out to learn more about metrics and analytics and how they can use them to improve organizational effectiveness. Although the use of HR metrics and work-