Transcription
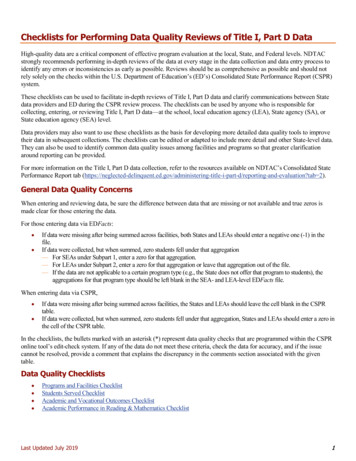
Checklists for Performing Data Quality Reviews of Title I, Part D DataHigh-quality data are a critical component of effective program evaluation at the local, State, and Federal levels. NDTACstrongly recommends performing in-depth reviews of the data at every stage in the data collection and data entry process toidentify any errors or inconsistencies as early as possible. Reviews should be as comprehensive as possible and should notrely solely on the checks within the U.S. Department of Education’s (ED’s) Consolidated State Performance Report (CSPR)system.These checklists can be used to facilitate in-depth reviews of Title I, Part D data and clarify communications between Statedata providers and ED during the CSPR review process. The checklists can be used by anyone who is responsible forcollecting, entering, or reviewing Title I, Part D data—at the school, local education agency (LEA), State agency (SA), orState education agency (SEA) level.Data providers may also want to use these checklists as the basis for developing more detailed data quality tools to improvetheir data in subsequent collections. The checklists can be edited or adapted to include more detail and other State-level data.They can also be used to identify common data quality issues among facilities and programs so that greater clarificationaround reporting can be provided.For more information on the Title I, Part D data collection, refer to the resources available on NDTAC’s Consolidated StatePerformance Report tab -title-i-part-d/reporting-and-evaluation?tab 2).General Data Quality ConcernsWhen entering and reviewing data, be sure the difference between data that are missing or not available and true zeros ismade clear for those entering the data.For those entering data via EDFacts: If data were missing after being summed across facilities, both States and LEAs should enter a negative one (-1) in thefile.If data were collected, but when summed, zero students fell under that aggregation— For SEAs under Subpart 1, enter a zero for that aggregation.— For LEAs under Subpart 2, enter a zero for that aggregation or leave that aggregation out of the file.— If the data are not applicable to a certain program type (e.g., the State does not offer that program to students), theaggregations for that program type should be left blank in the SEA- and LEA-level EDFacts file.When entering data via CSPR, If data were missing after being summed across facilities, the States and LEAs should leave the cell blank in the CSPRtable.If data were collected, but when summed, zero students fell under that aggregation, States and LEAs should enter a zero inthe cell of the CSPR table.In the checklists, the bullets marked with an asterisk (*) represent data quality checks that are programmed within the CSPRonline tool’s edit-check system. If any of the data do not meet these criteria, check the data for accuracy, and if the issuecannot be resolved, provide a comment that explains the discrepancy in the comments section associated with the giventable.Data Quality Checklists Programs and Facilities ChecklistStudents Served ChecklistAcademic and Vocational Outcomes ChecklistAcademic Performance in Reading & Mathematics ChecklistLast Updated July 20191
and Facilities Checklist ProgramsCSPR Tables 2.5.1.1/2.5.3.1 and 2.5.1.2/2.5.3.2The “Programs and Facilities” section of the CSPR includes data on the number of programs that receive Part D funding, theaverage length of stay of students, and the number of programs that reported data during SY 2018-19.NOTE: When reporting data for this section, submitting data or explaining the information provided for the numberof programs receiving funding is important. Information on the number of programs that received funding should beavailable to the SEA and is not necessarily dependent on SA or LEA reporting. Providing accurate informationregarding the types of programs that did or did not receive funds assists in interpreting all subsequent data.Checklist for Program/Facility Counts and Length of Stay (Tables 2.5.1.1/2.5.3.1)Facility/ program counts Data are reported for all facilities or programs that received Title I, Part D funds.If an entire program or facility type did not receive Part D funding (e.g., if no neglect programs werefunded under Part D), the cells have been left blank and a comment has been provided to indicate that noprograms of this type received funding.Average length of stay The reported average length of stay in days is fewer than or equal to 365 days; the stay should onlyreflect the period of enrollment that occurred within the current reporting year. *The calculations for average length of stay have been weighted, per the instructions provided inNDTAC’s “Reporting Tool: Creating a Weighted Average Length of Stay.”Stays from students with multiple visits during the reporting year are included in the average lengthof stay.Checklist for Programs and Facilities That Reported (Tables 2.5.1.2/2.5.3.2) The number of programs reporting data equals the number of programs that received Title I, Part Dfunding (as reported in 2.5.1.1/2.5.3.1). *If the number of programs reporting data is lower than the number of programs that received funding,comments are provided for those programs that were not able to report data.*Items marked with an asterisk reflect the data quality warnings that are programmed within ED’s online edit-check system.Related Resources and Instructions for Counting Part D Programs and Facilities See NDTAC’s “CSPR Guide,” chapter 3, for more information on program and facility counts, and an explanation of thereporting instructions for tables 2.5.1.1/2.5.3.1 and 2.5.1.2/2.5.3.2See NDTAC’s “Reporting Tool: Creating a Weighted Average Length of Stay” files/NDTAC ReportingTool ALS.pdf).Last Updated July 20192
Served Checklist StudentsCSPR Tables 2.5.1.3/2.5.3.3This section of the CSPR collects data on the number of students served through Title I, Part D-funded programs, theirdemographic information (such as racial and ethnic categories, age, and sex), and disability and limited English proficiency(LEP) status.NOTE: Providing accurate student age data is important, as these values will be used when calculating studentoutcome data (e.g., the percentage of students aged 16–21 years obtaining a high school diploma).Checklist for Number of Students ServedUnduplicated and long-term student counts Students with multiple enrollments within the same facility are counted only once in the unduplicatedstudent count.The total number of long-term students is lower than or equal to the number of unduplicated studentsreported (per facility or program type). *Only students with stays of 90 or more consecutive calendar days are included in the long-term studentcount. Racial and ethnic categories The number of students reported in the racial and ethnic categories is equal to the unduplicated count ofstudents (per facility or program type). * If students were reported in categories other than those established by ED, a note is provided in thecomments section identifying the number of students who were not entered into the table. The totalnumber of students reported, including students noted in the comments section for racial and ethniccategories, should equal the unduplicated count.Sex and Age The total number of students reported under each of the sex and age columns is equal to the unduplicatedcount of students (per facility or program type). *If the data on sex or age do not align with the unduplicated count, an explanation is provided in thecomments section.Age data are disaggregated according to the CSPR instructions. If age data must be reported in ranges,provide an explanation in the comments section.Students w ith disabilities (per IDEA) and limited English proficiency (LEP) The number of students with disabilities, as identified by IDEA, is equal to or lower than the unduplicatedcount of students (per facility or program type).The number of students who have limited English proficiency (LEP) is equal to or lower than theunduplicated count of students (per facility or program type).*Items marked with an asterisk reflect the data quality warnings that are programmed within ED’s online edit-check system.Related Resources and Instructions for Counting Students Served The EDFacts specification files ecifications.html) related to studentdemographics are C119 and C127.See NDTAC’s ‘CSPR Guide,’ chapter 3, for more information about counting students served.NDTAC’s “Reporting Tool: Collecting and Reporting Racial Ethnic Data in Seven Categories” files/NDTAC ReportingTool RED.pdf).Last Updated July 20193
and Vocational Outcomes Checklist AcademicCSPR Tables 2.5.1.4/2.5.3.4This section of the CSPR collects data on the number of students that achieved any of eight possible academic or vocationaloutcomes. The outcomes are broken down into three tables. Outcomes in the last two of the following three tables should bereported as they have been attained during either (a) only the enrollment period and/or (b) a transition period of up to 90 daysafter exit.1. Outcomes (once per student only after exit): This table includes outcomes that a student is generally able toachieve only after exit (e.g., students who return to their local district school).2. Outcomes (once per student): This table includes outcomes that a student is able to achieve only once in theirlives (e.g., earning a GED or high school diploma).3. Outcomes (once per student, per time period): This table includes outcomes that a student may achieve duringeach time period (e.g., in facility and/or 90 days after exit).NOTE: Two of the Federal performance indicators for Title I, Part D—the percentage of students who earnedhigh school course credits and the percentage of students who obtained a high school diploma or GED—arecalculated on the basis of the data provided in these tables. Data providers should pay particular attention to thequality of the data around these indicators.Data providers should be aware of the methodology used by ED when calculating outcome percentages. ED may notidentify students as being “age-eligible” in the same manner as all States. If the age eligibility for reporting States differsfrom ED’s, this should be noted in the comment section of the CSPR. For age eligibility information from ED, please seethe table below.Checklist for Academic and Vocational Outcomes (Tables 2.5.1.4/2.5.3.4)Outcomes (once per student, only after exit) For each outcome, the number of students reported under the “after exit” time period does not exceedthe unduplicated count of students reported in tables 2.5.1.3/ 2.5.3.3 (per facility or program type). *For each outcome, the number of students reported under the “after exit” time period does not exceedthe number of age-eligible students who could reasonably be expected to achieve that outcome (perfacility or program type).If the number of students reported in any cell exceeds the number of age-eligible students (per ED’sguidelines, below), an explanation is provided about the ages at which students are eligible to achieve anoutcome in the given State and the related number of students who fall into that category (per facility orprogram type).Outcomes (once per student) For each outcome, the number of students reported under the “in facility” time period does not exceedthe unduplicated count of students, per program type, reported in tables 2.5.1.3/2.5.3.3 (per facility orprogram type). *For each outcome, the number of students reported under the “after exit” time period does not exceedthe unduplicated count of students, per program type, reported in tables 2.5.1.3/2.5.3.3 (per facility orprogram type). *For each outcome, the number of students reported under the “in facility” time period does not exceedthe number of age-eligible students who could reasonably be expected to achieve that outcome (perfacility or program type).Last Updated July 20194
Checklist for Academic and Vocational Outcomes (Tables 2.5.1.4/2.5.3.4) For each outcome, the number of students reported under the “after exit” time period does not exceedthe number of age-eligible students who could reasonably be expected to achieve that outcome (perfacility or program type).If the number of students reported in any cell exceeds the number of age-eligible students (per ED’sguidelines, below), an explanation is provided about the ages at which students are eligible to achieve anoutcome in the given State and the related number of students who fall into that category (per facility orprogram type).The total number of students obtaining outcomes that a student is able to achieve only one time (e.g.,earned a GED and obtained high school diploma) does not exceed the total unduplicated count (perfacility or program type).Outcomes (once per student per time period) For each outcome, the number of students reported under the “in facility” time period does not exceedthe unduplicated count of students reported in tables 2.5.1.3/2.5.3.3 (per facility or program type). *For each outcome, the number of students reported under the “after exit” time period does not exceedthe unduplicated count of students reported in tables 2.5.1.3/2.5.3.3 (per facility or program type). * For each outcome, the number of students reported under the “in facility” time period does notexceed the number of age-eligible students who could reasonably be expected to achieve thatoutcome (per facility or program type). For each outcome, the number of students reported under the “after exit” time period does not exceedthe number of age-eligible students who could reasonably be expected to achieve that outcome (perfacility or program type).If the number of students reported in any cell exceeds the number of age-eligible students (per EDguidelines below), an explanation is provided about the ages at which students are eligible to achieve anoutcome in the given State and the related number of students who fall into that category (per facility orprogram type).*Items marked with an asterisk reflect the data-quality warnings that are programmed within ED’s online edit-check system.Related Instructions for Student Academic Outcomes The EDFacts specification files ecifications.html) related to studentacademic and vocational outcomes are C180 and C181.See NDTAC’s CSPR Guide, chapter 3, regarding reporting student academic outcomes.ED Age-Eligible GuidelinesED does not require use of these age ranges within States. They are used to best estimate the percent of students achievingeach outcome, so students who would not be eligible are not included in the calculation. ED requests that States explainwhen their eligibility requirements are not the same as ED’s age ranges (see below) to better understand the collection.Academic or vocational outcome1. Enrolled in their local district school2. Earned high school course credits3. Enrolled in a GED program4. Earned a GEDLast Updated July 2019ED’s age range6–21 years old13–21 years old14–21 years old16–21 years oldAcademic or vocational outcome5. Obtained high school diploma6. Accepted or enrolled in postsecondary education7. Enrolled in job-training courses/programs8. Obtained employmentED’s age range16–21 years old16–21 years old16–21 years old14–21 years old5
Performance in Reading & Mathematics Checklist AcademicCSPR Reading Tables 2.5.2.1/2.5.3.5.1 and Mathematics Tables 2.5.2.2/2.5.3.5.2This section of the CSPR collects academic progress data for long-term students enrolled in a program or facility for 90 daysor longer. These outcomes measure whether a student has demonstrated a negative grade-level change, no change in gradelevel, or improvement from the pre- to posttest exams.Two of the Title I, Part D Federal performance indicators—the number of long-term students who demonstrated gradelevel improvement on reading and mathematics assessments—are calculated on the basis of data in these tables. Dataproviders should pay particular attention to the quality of the data around these indicators.Checklist for Academic Performance on Pre-Posttest in Reading and Mathematics All students reported in this section are long-term students, with stays of 90 or more consecutivecalendar days.The sum of the long-term students with test results (values across the negative, no-change, or improvedcategories) should be equal to or lower than the number of long-term students reported in tables 2.5.1.3/2.5.3.3 (per facility or program type). *Students are reported once in only one category (negative, no change, or improved), based on their mostrecent test.*Items marked with an asterisk reflect the data quality warnings that are programmed within ED’s online edit-check system.Related Resources and Instructions for Student Academic Performance EDFacts specification files ecifications.html) related to academicperformance are C113 and C125.See NDTAC’s “CSPR Guide,” chapter 3, regarding reporting student academic performance.See NDTAC’s “Reporting Tool: Reporting Complete Pre- and Post-test Results for Reading and /sites/default/files/NDTAC ReportingToolPRR.pdf) for additional guidance onreporting complete pre- and posttest data.See “NDTAC Tip Sheet: Selecting Appropriate Pre-Posttests” files/NDTAC Tips PrePosttests 508.pdf) for guidance on selection of an appropriatepre-posttest for tracking student progress in reading and mathematics.The content of this document does not necessarily reflect the views or policies of the U.S. Department ofEducation. This document was produced by NDTAC at the American Institutes for Research with funding fromthe Office of Elementary and Secondary Education U.S. Department of Education under contract no. ED-ESE15-O-5037. Permission is granted to reproduce this document.This NDTAC tool is intended as a quick reference and does not supersede or replace any Federal forms orinformation about the collection and reporting of data pertaining to Title I, Part D.Last Updated July 20196
Data providers may also want to use these checklists as the basis for developing more detailed data quality tools to improve their data in subsequent collections. The checklists can be edited or adapted to include more detail and other State- level data. They can also be used to identify common data quality issues among facilities and programs .


