Transcription
Rationing Social Contact During the COVID-19Pandemic: Transmission Risk and Social Benefitsof US LocationsSeth G. Benzell , Avinash Collis†, Christos Nicolaides‡§This draft: April 26, 2020First draft: April 18, 2020AbstractTo prevent the spread of COVID-19, some types of stores and gathering places have been shut down while others remain open. The decisionto shut down one type of location and leave another open constitutesa judgement about the relative danger and benefits of those locations.Using location data from a large sample of smartphones, nationally representative consumer preference surveys, and government statistics, wemeasure the relative transmission risk benefit and social cost of closingabout thirty different location categories in the US. Our categories includetypes of shops, entertainments, and public spaces. Our main analysisranks twenty-six categories by those which should face stricter regulation via dominance across eight dimensions of risk and importance andthrough composite indexes. We find that from February to March, therewere larger declines in visits to locations that our measures imply shouldbe closed first. We hope this analysis will help policymakers decide howto reopen their economies.1Introduction“Society is commonly too cheap. We meet at very short intervals, not having had timeto acquire any new value for each other. We meet at meals three times a day, and giveeach other a new taste of that old musty cheese that we are.”Henry David Thoreau, Walden MITInitiative on the Digital Economy, sbenzell@mit.eduSloan School of Management, avinashg@mit.edu‡ University of Cyprus & MIT Sloan School of Management, nicolaides.christos@ucy.ac.cy§ We thank Jonathan Wolf and the rest of the team at SafeGraph for data. We are indebtedto Erik Brynjolfsson, Sinan Aral, Dean Eckles, and the researchers at the MIT Initiative onthe Digital Economy for invaluable feedback. We additionally thank the MIT Initiative on theDigital Economy for research funding. We thank Victor Yifan Ye for help with visualizations.We thank Maxwell H. Levy M.D. for medical insights. We thank Manuela Collis for helpfulfeedback on survey design. Our consumer survey was determined to be exempt by MIT’s IRB(project number E-2115).† MIT1
COVID-19 is primarily spread by droplets of mucous and saliva from those whoare infected.1 Infected people are often asymptomatic [Bai et al. (2020)], meaningthat in the absence of a comprehensive system test and trace individuals by infectionstatus, all physical proximity across different households is potentially dangerous. Agood way to think about this challenge is as an increase in the social cost of physicalproximity. Gatherings should be regulated to achieve a target R0 , the number ofpeople an infected person goes on to infect. Indeed, polities have already implementeda wide variety of new regulations on work, locations and gatherings.We conceptualize the decision to shutdown a location as a tradeoff between infection risk and economic and social costs. In this paper we make an empirical contribution regarding which types of locations pose the best and worst risk-reward tradeoffs.While other analyses have focused on the important questions of the effectivenessof government action on social distancing [Allcott et al. (2020)] or when to re-openeconomies [Alvarez et al. (2020)], we focus on a descriptive question. We aim to informpolicymakers about their portfolio of options of what to re-open as they attempt toreach a target R0 at the minimum social cost.To do so, we combine several measures of the importance and danger of categoriesof stores and locations. We consider about thirty categories of location, from fast-foodrestaurants, to museums, to grocery stores. Juxtaposing the danger and importanceof these locations yields a ranking of what should be opened earlier versus later in theeconomic restart process. We then compare our ranking to which types of locationshave seen the largest actual reductions in attendance.Our data comes from three main sources. The danger of a location due to physicalproximity is derived from Safegraph. Safegraph tracks the movement patterns of tensof millions of Americans at the monthly level. It categorizes locations into categoriesby NAICS industry. We select thirty of these categories to further investigate. Wemeasure the amount of physical contact (and danger) of a location through four mainmeasures: number of visits, number of unique visitors, and person-hours of visits abovetwo density thresholds. These last measures are inspired by the CDC’s ‘six-foot’ socialdistancing rule and the rule of 1 customer per 20 square metres implemented in partsof Germany.2We think of the benefits of a location as coming from its consumer and producersurplus. We measure the relative consumer surplus from a location by conductingdiscrete choice experiments on a nationally representative sample of US residents. Wemeasure producer surplus through a location type’s total employment, receipts andpayroll as measured by the US Census.3 While we report supplementary data for all1 TheWorld Health Organization, retrieved 4-16-20.“How COVID-19 Spreads” retrieved 4-16-20; What you need to know about plansfor Germany’s states to ease lockdown retrieved 4-17-203 Many public economic analyses of welfare exclude (or include negatively) direct changesin labor costs in evaluating a policy. The logic of this is that, during full employment, thewage of a worker is also an opportunity cost – the worker would be able to make the samewage employed elsewhere. However, during this crisis there is dramatic underemployment.Furloughed workers are being supported by the government at tremendous expense. Therefore,the work forces of these industries can be considered as having very low opportunity costs andtheir production should be counted in social surplus.2 CDC2
thirty categories, ultimately data quality concerns lead us to omit four categories fromthe main analysis.With these measures of the importance and danger of a location in hand, weevaluate categories of location using two methods. First, we consider dominated anddominating options. If a category is better than another along all dimensions of dangerand importance, then it should face looser regulation. This is our most conservativeset of results. We find electronics and furniture stores should be reopened before (orsimultaneously to) sporting goods and liquor and tobacco stores. Banks should bereopened before many types of locations, while cafes and gyms should be seventh inline at most. Places of worship should be opened before gyms but after colleges anduniversities.For a single-dimensional look at the tradeoffs of each location, we also introduceindexes of danger and importance combining all of our measures. Unsurprisingly, thedanger of a location (which is determined in large part by the frequency and lengthof visits) is positively related to importance. However, the relationship is not perfect,and we identify outliers in the overall relationship as candidates for tighter or laxerregulation.We evaluate these indexes separately for metro and non-metro locations. We alsoestimate an alternate danger index for only visitors aged over 65. Across these threevariations, differences in the importance-danger tradeoff by category are minimal.Locations our analysis implies should face relatively lighter restrictions are banks,general merchandise stores (e.g. Walmart), and colleges and universities. Locationsour analysis implies should face relatively strict restrictions are gyms, cafes, liquor andtobacco stores, and sporting goods stores.It is important to emphasize the limitations of this analysis. One of the mostimportant is that we ignore potential economic linkages, social welfare externalities,or visit substitution across different industries. We acknowledge these limitationsthroughout. We conclude with a discussion of how our analysis contrasts with policieswhich are currently being implemented.2DataWe initially selected thirty categories of locations to study. These locations are reported in Table S1.4 They correspond to NAICS industry categories or combinationsthereof. These locations were selected for being among the most visited types in ourgeolocation data. We excluded from our analysis several essential categories relatedto housing, healthcare, elderly care and categories related to travel. We collect dataof three types. These are data on the category’s transmission risk, economic outputand costs, and consumer value.4 Notethat names of these categories are shortened in the text for brevity.3
2.1Cumulative Transmission Risk by Location CategoryTo quantify the potential contribution of a location to disease transmission (i.e. itsdanger ) we utilize a fine-grained dataset of geolocations from approximately 47Msmartphone devices in United States. The data are collected by Safegraph and recordvisitation patterns to around 6M points of interest on a daily, weekly and monthlybasis. Our primary analysis focuses on February and March 2020. This data hasbeen previously used to study political polarization [Chen and Rohla (2018)], racialsegregation [Athey et al. (2019)] and the impact of open-bathroom policy enacted byStarbucks on foot traffic [Gurun et al. (2020)].The “visitation” data includes information about the total number of visits, total number of visitors, and timing and length of visits. Only information from devices associated with individuals over the age of 13 are reported for privacy reasons.The “points of interest” data includes information on location (full address), six-digitNAICS code, and branding. For each location, SafeGraph also provides data on thespace’s geometry. We use this to calculate the area of a location in square feet.5The thirty location categories of interest we focus on account for 64% of allunique visits from January 2019 through March 2020. Out of all categories, full servicerestaurants (sit down) is the most popular in terms of both number of visits and uniquevisitors. The least popular according to the same metric is bars and nightclubs (seeTable S1). Between February and March 2020 we observe a 24.9% drop in the totalnumber of visits at all places of interest included in analysis, reflecting the socialdistancing measures which began to be implemented in March. We supplement theSafeGraph data with census data to classify locations by metro and non-metro regionsusing the 2013 RUCC classification scheme.6 To account for the fact that SafeGraphis tracking only a fraction of all the individuals in the US, we upscale every SafeGraphvisit to approximate the real number of visits/visitors for each location.7 For eachindividual location, we calculate the number of person-hours of visits per square footfor any hour in a day.8We create four main monthly level measures of a location’s danger. These are: Total visits Total unique visitors5 Note that SafeGraph’s geometry data is two-dimensional, so we under-count the effectivefloor-space of locations with multiple stories.6 US Department of Agriculture, retrieved 4-16-207 Specifically, we use SafeGraph visit source data to estimate the home county of everyvisitor to a location (Only visitors from counties with at least five visitors are reported forprivacy purposes. We impute the remaining visitors as being from the home county of thelocation). We then use the ratio of devices tracked by SafeGraph in a county to that county’spopulation aged over 13. In the initial draft of this paper, we uniformly rescaled each visitby 7.01, reflecting the ratio 328M US population over 46.8M devices tracked. This change inrescaling makes no significant difference to the results.8 For a given place of interest, the person-hours of visits per square foot for a specific hourin a day is calculated as the average daily number of visits multiplied by the mean durationof a visit, multiplied by the relative popularity of that particular hour and divided by squarefootage. The mean duration of a visit is not directly reported by SafeGraph, but is inferredfrom the visit length bins provided.4
Person-hours of visits during crowding of more than 1 visitor per 113 sq. ft.9 Person-hours of visits during crowding of more than 1 visitor per 215 sq. ft.10To identify the danger of the category of interest, we sum the individual measuresof all locations within the category.11 The danger indexes we construct in this way arecumulative in the sense that they do not represent danger-per-visit or danger-per-store,but rather the aggregate risk from all locations in a category.There are many limitations of this risk data. Importantly, these measures do nottake into account heterogeneity in types of visitors. Older visitors may be at moredirect risk from visiting dense locations. There is also heterogeneity in from how faraway a visit to a location is. Visitors from distant places might spread the disease toa county that had been previously untouched. These risk measures also do not takeinto account that some types of locations offer services (like dentists and barbers) thatrequire intense physical proximity. Each of these three limitations we address in moredetail in the discussion.A limitation to our location risk data that we cannot account for is that it doesnot consider possible complementarity and substitution across locations. If one typeof location (say grocery stores) were shut down, it might lead to increased visits andcrowding in another type of location (say general goods stores).2.2Cumulative Economic Importance by Location CategoryOur economic data comes from most recent edition of the SUSB Annual Data Tablesby Establishment Industry.12 Our measures of economic importance consist of annualpayroll, receipts, and employment. Across our thirty categories there are 34.4 millionemployees, 1.14 trillion dollars in annual payroll, and 5.79 trillion in annual receipts.Across our thirty categories there are 1.548 million firms and 2.165 million establishments, compared to 3.191 million SafeGraph points of interest. The fact thatthe number of establishments is similar to, and in fact smaller than, the amount ofpoints of interest tracked by SafeGraph for these categories gives us confidence thatwe have a very high rate of coverage. Supplementary figure S1 plots the number ofSafeGraph points of interest against the number of Census establishments. The number of SafeGraph points of interest is usually higher, due to the fact that multiple9Asix-foot radius circlesocial distancing guideline of 1 customer per 20 square metres, retrieved 4-16-2011 We also consider several additional measures not currently used in the analysis. The firstis the total person-hours of visits. The latter are alternative measures of density that countany individuals in a building for a part of an hour as contributing to crowding for the full hour.We also consider variations of the density threshold to account for different epidemiologicalviews about safe distance [Bourouiba (2020)]. Figure S5 ranks locations by danger in Februaryand March 2020. The danger ranking used is person-hours of visits during crowding of morethan 1 visitor per 113 sq. ft. The changes between the ranking reflect in part social distancingmeasures imposed in mid-March and their heterogeneous impact on the different categories.For an alternate look into physical proximity of customers in various types of retail outletsusing SafeGraph data, see [Goldfarb and Tucker (2020)].12 -continuum-codes/documentation/.Created by the U.S. Census Bureau. 2017 data. Retrieved 4-16-20.10 German5
buildings in the same complex might be considered multiple points of interest but asingle establishment.13The four locations with the greatest divergence between census establishments andSafeGraph points of interest are “Bars and nightclubs,” “Banks and other FinancialServices,” “Public and Private Schools,” and “Parks and Playgrounds.” Two of theoutliers, “Public and Private Schools,” and “Parks and Playgrounds” have dramatically more points of interest than census locations. The latter two are undercounted inthe Census data because most of the examples of these location types are public. Forexample, the National Center of Education Statistics’ count of all public and privateschools is 130.9 thousand in the 2017-2018 school year, with 32.4 thousand of thesebeing private.14 The total figure is close to 116.9 thousand points of interest trackedby SafeGraph, and the private school number is closer to 22.1 thousand establishmentstracked by the census.The other pair of outliers, bars and banks, have surprisingly low SafeGraph point ofinterest counts. However, the number of SafeGraph points of interest, 83.9 thousand,is pretty close to the number of US bank branches in 2018 (88.1 thousand).15 The lowcount for banks seems due to peculiarities in how the Census counts establishments.The census count likely includes many locations that are not designed for visitors (e.g.unlisted back-offices), as well as potentially some types of financial institutions thatSafeGraph does not capture well. The very low point of interest count for bars andclubs, a mere 6.7 thousand points of interest for the entire country, is more troublingfrom the perspective of our analysis. SafeGraph staff suggest that part of the lowcount is due to ambiguity in the division between restaurants and bars and pubs thatserve food.While each of our categories are perfectly matched to this data, additional limitations remain. First, economic activity in different industries might be differentlyimpacted by a shutdown. For example, shutting down all bank branches and physicallocations would likely reduce their economic output by less than doing the same forbarbershops. We partly address this concern in the discussion. Second, unlike ourother sources of data, our economic importance data does not vary at the regional(metro vs. non-metro) level. A final important note is that we incorporate no dataabout linkages or complementarities between industries. If one industry is shut down,it could decrease the revenues and employment of another (e.g. by depriving them ofan important input) or increase them (e.g. by effectively ‘raising the cost’ of a close13 The census definition of an establishment is “a single physical location at which businessis conducted or services or industrial operations are performed. It is not necessarily identical with a company or enterprise, which may consist of one or more establishments. Whentwo or more activities are carried on at a single location under a single ownership, all activities generally are grouped together as a single establishment. The entire establishment isclassified on the basis of its major activity and all data are included in that classification.Establishment counts represent the number of locations with paid employees any time duringthe year.” So physical locations without an associated employee (perhaps because it is onlystaffed by floating workers) should have a SafeGraph point of interest, but not be counted asan establishment.14 National Center of Education Statistics, retrieved 4-22-20.15 JLL Research, retrieved 4-22-206
substitute). In the current analysis we effectively assume that all industries are perfectsubstitutes.2.3Consumer Welfare Importance by Location CategoryWe conducted a nationally representative survey of 1,099 US residents. Respondentswere recruited through Lucid, a market research firm, during April 13 to April 15,2020. The sample is representative by age, gender, ethnicity and region [Coppock andMcClellan (2019)]. The respondent’s locations (zip-codes) are validated and directlyprovided to us by Lucid.Each respondent takes part in a series of discrete choice experiments [Louviere et al.(2000)] where they choose which location, among two options, they would prefer to beopen whether or not the location is currently open (see supplementary Figures S2 andS3 for the experiment instructions and a sample choice experiment). Discrete choiceexperiments have been widely used to measure valuations of market and non-marketgoods. This specific type of discrete choice experiment is single binary discrete choice[Carson and Groves (2007)]. To make responses consequential and incentivize respondents to respond truthfully, we gave them a chance to earn an additional monetaryreward which is linked with their choices [Carson et al. (2014)].Each respondent participated in a series of thirty single binary discrete choiceexperiments. We solicited a total of 32,970 decisions. For each location category, wecompute the probability of a respondent preferring that location over other locations.We separately calculate these probabilities for respondents living in metro and nonmetro areas (see Figure S4 for a list of locations ranked by consumer welfare importanceand Table S2 for differences in importance for metro and non-metro areas).3AnalysisWe now juxtapose how different locations fare along our four dimensions of importance(consumer importance, employment, payroll, receipts) and four dimensions of transmission risk (visits, unique visitors, person hours at moderate density, person hoursat high density). The core idea is that locations that score higher in importance andlower in transmission risk should be prioritized. We exclude from this analysis fourcategories of location with data quality concerns.163.1Dominating OptionsThe most conservative way to make this comparison is to look at whether there are anylocations that dominate others in terms of both lower transmission danger and higherimportance. By dominate, we mean that for a pair of location types one location is16 We omit “Bars and Clubs” as SafeGraph seems to dramatically undercount these locations. We omit “Parks and Playgrounds” as SafeGraph struggles to precisely define the borders of these irregularly shaped points of interest. We omit “Public and Private Schools” and“Child Care and Daycare Centers” due to challenges in adjusting for the fact that individualsunder the age of 13 are not well tracked by SafeGraph.7
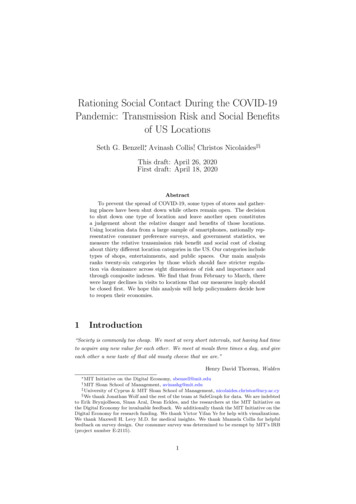
superior to the other along all eight of our dimensions of risk and importance. Thismeasure is conservative in the sense that any possible weighed aggregate measure ofrisk or importance will yield the same pairwise comparison.Of our twenty-six categories, thirteen do not dominate nor are dominated by anyother. Figure 1 reports the dominated/dominating pairs of categories for the thirteenremaining categories.17Figure 1: Grid indicating dominating and dominated categories. A cell is goldif the row category is better on all risk and importance dimensions than thecolumn category. Blue for the converse.Gyms and Cafes, Juice Bars and Dessert parlours are the two categories with themost dominated pairings. According to our measure, each of these locations shouldbe opened only after banks, dentists, colleges, clothing stores, places of worship andauto dealers and repair shops. Within types of stores, we find electronics stores andfurniture stores should be opened before liquor and tobacco stores and sporting goodsstores. The location that comes out the best in this measure is banks and finance,which dominate six other categories.17 Note that the figure is mirrored, because if a Y-axis category dominates an X-axis categorythen the X-axis category is dominated by the Y-axis category.8
3.2Comparing Location Categories Using Composite Riskand Importance IndexesAnother way to determine which locations it makes sense to open first is to createoverall indexes of danger and importance, and identify outliers. We create our dangerindex as the average rank of a category in the four danger measures. We create our importance index as the average rank of a category in our three economic importance andone consumer importance measure. We up-weight the consumer importance measureso that it is equally weighted with the three economic importance measures.We perform this analysis separately for metro and non-metro areas. Non-metroareas constitute 15% of the population and 72% of the land area of the US. Notethat transmission risk and consumer welfare rankings vary by metro/non-metro, buteconomic data does not.Figure 2 reports the results of this analysis. There is a strong positive relationshipbetween the danger of a location category and its importance. However, there are clearoutliers. Those in the top left corner of both panels have relatively high importancebut low danger. Categories near the bottom right corners of each panel have relativelyhigh danger and low importance. Categories are colored from gold to blue as a functionof their importance relative to danger. More precisely, we estimate a linear regression,including an intercept term, of importance index as a function of the danger index.Categories are colored by the magnitude and sign of the residual.The metro and non-metro area index figures are remarkably similar, suggestingthat the urban-rural divide is not a particularly important dimension for policymakers.Both figures agree that banks, general merchandise stores (i.e. Walmart), dentists,grocery stores, and colleges and universities should face relatively loose restrictions.They also agree that gyms, sporting goods stores, liquor and tobacco stores, and cafesshould face relatively tight restrictions.3.3Changes in Visits from February to MarchAs mentioned above, there is a dramatic decrease in visits to all locations from February to March 2020. A natural final question is whether these reductions in visitsare spread evenly across locations, or whether the reductions follow the risk-rewardtradeoff we measure.Figure 3 plots the percent decrease in visits to a location type, from Februaryto March 2020 as a function of ‘Importance-Risk Tradeoff Favorability’. ImportanceRisk Tradeoff Favorability is the disproportionate importance of a category relativeto it’s risk (i.e. the gold to blue categorization in Figure 2, except aggregated for allregions). Categories on the right of the figure should face less restrictions accordingto our analysis and vice versa. The size of the points is proportional to total visits inFebruary 2020.As can be seen, weighing by initial visits, there is a clear positive relationship.This suggests that at least some of the cost-benefit analysis we measure is beinginternalized by US consumers, businesses, and policymakers. The two largest outliers9
Figure 2: Category importance index and danger index for metro and non-metroareas. The color scale reflects the residuals by category of a linear regression ofthe importance index on the danger index. Golden categories have disproportionately high importance for their risk, blue categories have disproportionatelylow importance.10
Figure 3: Change in location category visits versus the category importance/riskresidual. Categories with higher residuals are positive outliers of a regression ofimportance residual on risk residuals and vice versa. The size of the points isproportional to total visits in Feburary 2020.are colleges and universities, and hardware stores. We find colleges to be relativelygood tradeoffs, but most have been shut down in March, leading to a 61% decline invisits. Conversely, liquor and tobacco stores we find to be relatively poor tradeoffs(due to mediocre economic importance and small busy stores) yet the number of visitsto these locations has declined by less than 5%. Hardware stores are the location whichhave seen the largest increase in visits, as individuals scrounge for personal protectiveequipment and other home supplies.It is important to note that these declines in attendance are due to a mix of federalgovernment, state and local government, business, and individual level actions. Wethink that our tool can be useful for any actor looking to find smart ways to minimizeCOVID-19 transmission risk.4DiscussionGovernments and civic organizations across the world have made different decisionsabout how to implement and relax social distancing measures. As they do so, theyhave various tools at their disposal. In the US, many of these restrictions have beenspecific to the type of location. The details of these restrictions have varied from stateto state. For example, as of 4-18-20, Alabama has closed schools, day cares, gyms,11
movie theaters and other ‘non-essential businesses’. On the other hand, Nebraskahas not ordered closures of day cares, but has closed all liquor stores and religiousgatherings. New Mexico also has let day cares operate, but have closed gun stores,liquor stores, and most religious gatherings.18Why are different states adopting such different policies regarding which areas toshut down? One possibility is state-level variation in the importance or danger of locations. This variation would likely have to be separate from urban-rural heterogeneity,which we showed above to not make much of a difference.We don’t know much about how most states are deciding to prioritize closuresand re-openings, but New York at least seems to conceptualize the problem the sameway we do. On April 16, the governor of New York Andrew Cuomo, gave a pressconference where he presented a slide with a two by two grid. The grid dividedbusinesses conceptually into essential vs. non-essential and high-transmission risk vs.low-transmission risk categories. He declared that businesses that are essential andlow risk should be opened first, but failed to list which types of locations belongedwhere in the grid (see supplementary figure S7). We hope that our analysis will helpGovernor Cuomo and others to populate their grids.An alternative government strategy would be to target the danger of visiting certain locations directly. Mandatory mask wearing and 6-foot rules are doing some ofthis work. Some regions have also attempted to directly regulate the density of locationvisits.
Henry David Thoreau, Walden . zUniversity of Cyprus & MIT Sloan School of Management,nicolaides.christos@ucy.ac.cy xWe thank Jonathan Wolf and the rest of the team at SafeGraph for data. We are indebted . have seen the largest actual reductions in attendance. Our data comes from three main sources. The danger of a location due to physical