Transcription
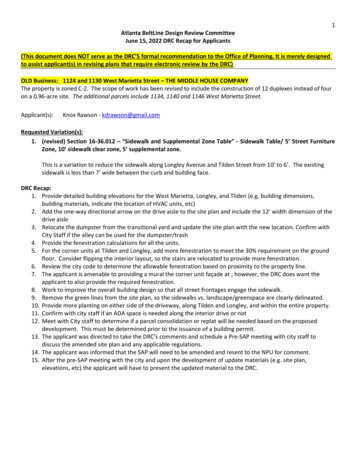
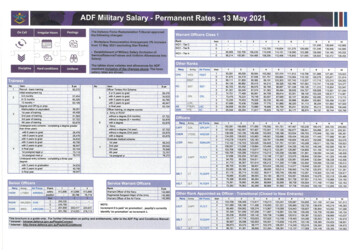
QUARTERLY RECAPFirst Quarter 2022 RecapAt-A-GlanceThe S&P 500 ended thequarter 5.2% below itsJanuary 3, 2022 recordhigh.The Nasdaq Compositegained 3.48% in March,netting an 8.95% loss in the1Q and ending 11.2%below its November 19,2021 all-time high.The Dow Industrials shedover 2,445 points in the firsttwo months of the yearbefore paring its decline to1,660 points (-4.1%) atquarter end. The Dowgained 2.49% in March.U.S. stocks are still in a bullmarket. Since plunging to apandemic bear-market lowon March 23, 2020, theS&P 500 and NasdaqComposite have surgedrespectively by 109% and110% while the DowIndustrials has rallied 94%.Supply-side issues and thewar in Ukraine have causedcommodity prices toskyrocket. From oil tometals to wheat, theBloomberg CommodityIndex surged over 25% forits best quarter since 1990.Market Indices1March1Q 2022S&P 500Russell 3000Russell 2000MSCI EAFEMSCI Emerging MarketsBloomberg US Aggregate BondBloomberg US Municipal BondBloomberg US Corporate High %-4.84%1Morningstar Direct (all performance figures are total return based, which include reinvested dividends)U.S. stocks finished the month and quarter on a sour note with the broad marketS&P 500 falling nearly 1.6% on the final trading day of March, trimming its firstmonthly gain in the new year to just over 3.7% and posting its first quarterly loss intwo years. In terms of negativity, there were a total of 35 down days this year,marking the largest number of first quarter daily drawdowns since 1984. Nearly half(17) of those daily losses were in excess of 1%.Equities notably improved in the second half of March, paring a dismal start to theyear. At its worst through a March 8 low, the S&P 500 had suffered a peak-to-troughplunge of as much as 13% before paring losses. Since then, there has been agrowing optimism that stocks may serve to help hedge against inflation, due to theirreal cash-flow generating characteristics.In all, despite four-decade high inflation ushering in a new cycle of Federal Reserveinterest rate hikes, erosion in consumer spending together with supply-chaindisruptions and prospects for food shortages worsened by the month-long Russianwar with Ukraine, the S&P 500 suffered a quarterly loss of just 4.60%. The retreatpales in comparison when contrasted with the thousands of lives lost, property andlivelihoods destroyed and resulting refugee dislocations within a nation that did notprovoke, nor prod Russia to attack. Moreover, for U.S. markets, it was the onset ofthe COVID-19 pandemic that triggered the 20% bear market loss in the first quarterof 2020. An event that continues to have an expanding global death toll most recentlyestimated at 6.14 million.Referencing the performance table above, the small cap-focused Russell 2000 Indexwidely trailed the benchmark S&P 500 with about a third of the returns in March andalmost 3% greater losses for the quarter. Similarly, foreign stocks also widely trailedAmerican large cap performance in March and for the quarter. Quickly pacedTreasury yield gains have especially caused concerns in investment-grade fixedincome bond market valuations.As shown in the style box performance boxes below, large cap core and its growthcomponent outperformed all other domestic styles and capitalization levels in March.
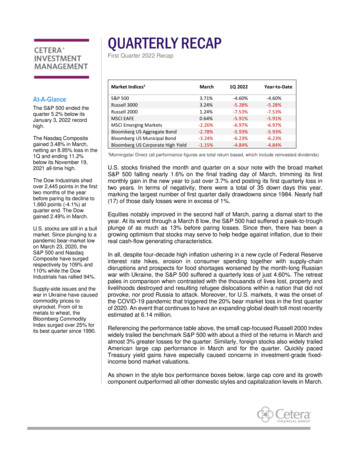
Outside of that, value defensively outperformed growth-oriented companies in mid and small cap levels last monthand for the quarter.Morningstar Direct Style Box Index returns above are represented by: Large Value (Russell 1000 Value), Large Core (Russell 1000), LargeGrowth (Russell 1000 Growth), Mid Value (Russell Mid Cap Value), Mid Core (Russell Mid Cap), Mid Growth (Russell Mid Cap Growth), SmallValue (Russell 2000 Value), Small Core (Russell 2000), Small Growth (Russell 2000 Growth). Source: Morningstar Direct, total return based,including reinvested dividendsIn the sector performance tables below, 10 of the 11 major sector groups ended broadly higher in March, withUtilities at the top of the leaderboard and Financials the only declining sector. Big investment banks are contendingwith a slowdown in capital markets issuance. Although not reflected below, Materials was the fourth-bestperforming sector last month, up 6.11%. First quarter sector performance was dominated by strong gains inEnergy, a reflection of the 33% YTD surge in crude oil prices. U.S. WTI oil prices have moderated from a March8 closing high of 123.70 before ending the quarter at 100.28/barrel. Defensively oriented sectors Utilities andConsumer Staples rounded out the list of top first quarter performers.Top Sector Performers – March 1Bottom Sector Performers – March 1Utilities ( 10.36%)Energy ( 8.96%)Real Estate ( 7.79%)Top Performers – First Quarter 1Consumer Staples ( 1.81%)Communication Services ( 0.95%)Financials (-0.19%)Bottom Performers – First Quarter 1Energy ( 39.03%)Utilities ( 4.77%)Consumer Staples (-1.01%)Top Performers – YTD 2022 1Technology (-8.36%)Consumer Discretionary (-9.03%)Communication Services (-11.92%)Bottom Performers – YTD 2022 1Energy ( 39.03%)Utilities ( 4.77%)Consumer Staples (-1.01%)Technology (-8.36%)Consumer Discretionary (-9.03%)Communication Services (-11.92%)1Morningstar Direct (all performance figures are total return based, which include reinvested dividends)As mentioned, overseas equity performance widely trailed the U.S. S&P 500 Index last quarter. Emerging marketsexperienced deeper quarterly losses than the U.S. as Chinese stocks tumbled on U.S. delisting fears. The MSCIChina Index saw its worst quarterly start to a year since 2008, down 14.19%. Moreover, Russian markets wereclosed most of March, causing performance tracking firms to report 100% Russian equity valuation declines toreflect inability to trade (zero liquidity). The MSCI All-Country World Index climbed 2.17% in March and fell 5.36%during the first quarter. The ACWI excluding U.S. performance rose just 0.16% last month and fell 5.44% lastquarter.
U.S. Treasurys, as measured by the Bloomberg U.S. Government Bond Index, fell 3.09% in March and lost 5.53%in the first quarter. After the Fed raised its key Fed Funds interest rate by a ¼-point in March with at least sevenmore such increases forecast this year, the yield on benchmark 10-year Treasury notes jumped 83 basis pointsfrom 1.51% at the start of the year to 2.32% at the end of the quarter. The long end of the yield curve suffereddeeper declines, with the Bloomberg U.S. Government Long-term Bond Index falling 5.34% last month and posteda 10.57% loss for the first quarter.In other fixed-income assets, investment-grade bonds of all types (as measured by the Bloomberg U.S. AggregateBond Index) also ended March and the quarter with outsized losses, sliding nearly 2.8% last month and downover 5.9% for the quarter. Municipal bonds fared even worse, losing around 3.2% in March and almost twice thatfor the quarter, down 6.2%. Non-investment-grade high-yield debt fell the least in March, with the Bloomberg U.S.Corporate High Yield Index off nearly 1.2% and down over 4.8% in the first quarter.This report is created by Cetera Investment Management LLC. For more insights and information from the team,follow @CeteraIM on Twitter.About Cetera Investment ManagementCetera Investment Management LLC is an SEC registered investment adviser owned by Cetera FinancialGroup . Cetera Investment Management provides market perspectives, portfolio guidance, modelmanagement, and other investment advice to its affiliated broker-dealers, dually registered broker-dealers andregistered investment advisers.About Cetera Financial Group“Cetera Financial Group” refers to the network of independent retail firms encompassing, among others, CeteraAdvisors LLC, Cetera Advisor Networks LLC, Cetera Investment Services LLC (marketed as Cetera FinancialInstitutions or Cetera Investors), Cetera Financial Specialists LLC, and First Allied Securities, Inc. All firms aremembers FINRA / SIPC. Located at 655 W. Broadway, 11th Floor, San Diego, CA 92101.DisclosuresIndividuals affiliated with Cetera firms are either Registered Representatives who offer only brokerage servicesand receive transaction-based compensation (commissions), Investment Adviser Representatives who offeronly investment advisory services and receive fees based on assets, or both Registered Representatives andInvestment Adviser Representatives, who can offer both types of services.The material contained in this document was authored by and is the property of Cetera Investment ManagementLLC. Cetera Investment Management provides investment management and advisory services to a number ofprograms sponsored by affiliated and non-affiliated registered investment advisers. Your registeredrepresentative or investment adviser representative is not registered with Cetera Investment Management anddid not take part in the creation of this material. He or she may not be able to offer Cetera InvestmentManagement portfolio management services.Nothing in this presentation should be construed as offering or disseminating specific investment, tax, or legaladvice to any individual without the benefit of direct and specific consultation with an investment adviserrepresentative authorized to offer Cetera Investment Management services. Information contained herein shallnot constitute an offer or a solicitation of any services. Past performance is not a guarantee of future results.For more information about Cetera Investment Management, please reference the Cetera InvestmentManagement LLC Form ADV disclosure brochure and the disclosure brochure for the registered investmentadviser your adviser is registered with. Please consult with your adviser for his or her specific firm registrationsand programs available.
No independent analysis has been performed and the material should not be construed as investment advice.Investment decisions should not be based on this material since the information contained here is a singularupdate, and prudent investment decisions require the analysis of a much broader collection of facts and context.All information is believed to be from reliable sources; however, we make no representation as to itscompleteness or accuracy. The opinions expressed are as of the date published and may change withoutnotice. Any forward-looking statements are based on assumptions, may not materialize, and are subject torevision.All economic and performance information is historical and not indicative of future results. The market indicesdiscussed are not actively managed. Investors cannot directly invest in unmanaged indices. Please consult yourfinancial advisor for more information.Additional risks are associated with international investing, such as currency fluctuations, political and economicinstability, and differences in accounting standards.GlossaryThe Bloomberg U.S. Aggregate Bond Index is a broad-based flagship benchmark that measures theinvestment grade, US dollar-denominated, fixed-rate taxable bond market. The index includes Treasuries,government–related and corporate debt securities, MBS (agency fixed-rate and hybrid ARM pass-throughs),ABS and CMBS (agency and non-agency) debt securities that are rated at least Baa3 by Moody’s and BBB- byS&P. Taxable municipals, including Build America bonds and a small amount of foreign bonds traded in U.S.markets are also included.The Bloomberg U.S. Municipal Bond Index covers the USD-denominated long-term tax-exempt bond market.The index has four main sectors: state and local general obligation bonds, revenue bonds, insured bonds, andpre-refunded bonds. Eligible securities must be rated investment grade (Baa3/BBB- or higher) by Moody’s andS&P and have at least one year until final maturity, but in practice the index holding have a fluctuating averagelife of around 12.8 years.The Bloomberg U.S. Corporate High Yield Index measures the USD-denominated, non-investment grade,fixed-rate, taxable corporate bond market. Securities are classified as high yield if the middle rating of Moody's,Fitch, and S&P is Ba1/BB /BB or below, excluding emerging market debt. Payment-in-kind and bonds withpredetermined step-up coupon provisions are also included. Eligible securities must have at least one year untilfinal maturity, but in practice the index holdings has a fluctuating average life of around 6.3 years.The Bloomberg U.S. Government Bond Index is comprised of the U.S. Treasury and U.S. Agency Indices.The index includes U.S. dollar-denominated, fixed-rate, nominal US Treasuries and US agency debentures(securities issued by US government owned or government sponsored entities, and debt explicitly guaranteedby the US government).The Bloomberg Commodity Index is a broadly diversified index that allows investors to track commodityfutures through a single, simple measure. It is composed of futures contracts on physical commodities and isdesigned to minimize concentration in any one commodity or sector. It currently includes 19 commodity futuresin five groups. No one commodity can comprise less than 2% or more than 15% of the index, and no group canrepresent more than 33% of the index (as of the annual re-weightings of the components).The Cboe Volatility Index (VIX ) is a key measure of market expectations of near-term volatility conveyed byS&P 500 stock index option prices.The MSCI EAFE is designed to measure the equity market performance of developed markets (Europe,Australasia, Far East) excluding the U.S. and Canada. The Index is market-capitalization weighted.The MSCI Emerging Markets is designed to measure equity market performance in global emerging markets. Itis a float-adjusted market capitalization index.
The MSCI All-Country World Index (ACWI) is a market cap weighted index designed to representperformance of the full opportunity set of large- and mid-cap stocks across 23 developed and 26 emergingmarkets, covering more than 2,700 companies across 11 sectors and approximately 85% of the free floatadjusted market capitalization in each market.The Russell 1000 Growth Index measures the performance of the large-cap growth segment of the U.S. equityuniverse. It includes those Russell 1000 Index companies with higher price-to-book ratios and higher forecastedgrowth values.The Russell 1000 Value Index measures the performance of the large-cap value segment of the U.S. equityuniverse. It includes those Russell 1000 Index companies with lower price-to-book ratios and lower forecastedgrowth valuesThe Russell 2000 Index measures the performance of the small-cap segment of the U.S. equity universe and isa subset of the Russell 3000 Index representing approximately 10% of the total market capitalization of thatindex. It includes approximately 2000 of the smallest securities based on a combination of their market cap andcurrent index membership.The Russell 3000 Index measures the performance of the largest 3,000 U.S. companies representingapproximately 98% of the investable U.S. equity market.The Russell Midcap Index measures the performance of the mid-cap segment of the U.S. equity universe andis a subset of the Russell 1000 Index. It includes approximately 800 of the smallest securities based on acombination of their market cap and current index membership. The Russell Midcap represents approximately31% of the total market capitalization of the Russell 1000 companies.The S&P BSE SENSEX Index is a free-float market-weighted index of 30 well-established and financially soundstocks on the Bombay Stock Exchange, representative of various industrial sectors of the Indian economy.The S&P 500 is a capitalization-weighted index of 500 stocks designed to measure performance of the broaddomestic economy through changes in the aggregate market value of 500 stocks representing all majorindustries.The Dow Jones Industrial Average is a price-weighted average of 30 significant stocks traded on the NewYork Stock Exchange and the NASDAQ.The Nasdaq Composite Index includes all domestic and international based common type stocks listed on TheNASDAQ Stock Market. The NASDAQ Composite Index is a broad-based capitalization-weighted index.The Shanghai Composite Index is a stock market index of all stocks (A shares and B shares) that are tradedat the Shanghai Stock Exchange.The U.S. Dollar Index is a weighted geometric mean that provides a value measure of the United States dollarrelative to a basket of major foreign currencies. The index, often carrying a USDX or DXY moniker, started inMarch 1973, beginning witha value of the U.S. Dollar Index at 100.000. It has since reached a February 1985 high of 164.720, and hasbeen as low as 70.698 in March 2008.West Texas Intermediate (WTI) is a crude oil stream produced in Texas and southern Oklahoma which servesas a reference or "marker" for pricing a number of other crude streams. WTI is the underlying commodity of theNew York Mercantile Exchange's oil futures contracts.
About Cetera Investment Management Cetera Investment Management LLC is an SEC registered investment adviser owned by Cetera Financial Group . Cetera Investment Management provides market perspectives, portfolio guidance, model management, and other investment advice to its affiliated broker-dealers, dually registered broker-dealers and