Transcription
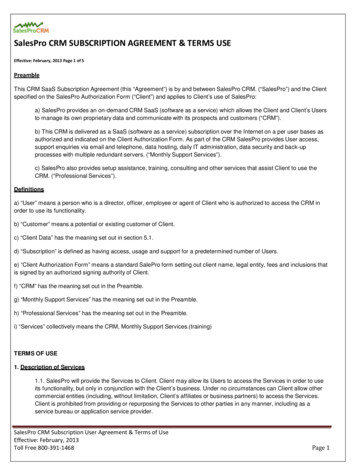
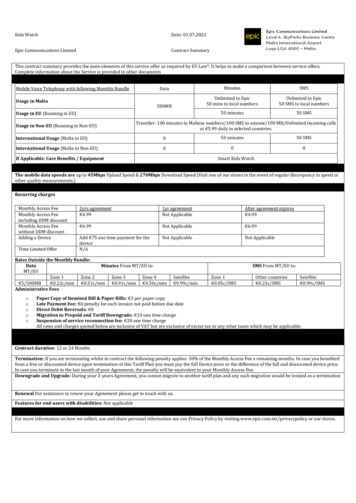
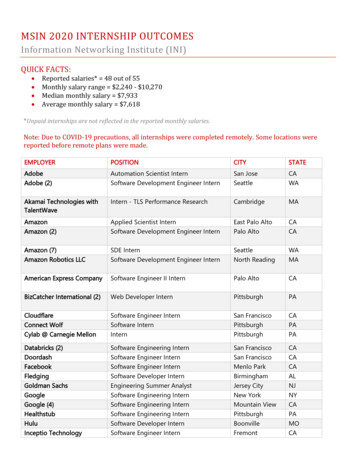
MONTHLY RECAPFebruary 2022 RecapMarket Indices1S&P 500Russell 3000Russell 2000MSCI EAFEMSCI Emerging MarketsBarclays U.S. Aggregate BondBarclays U.S. Municipal BondBarclays U.S. Corporate High YieldAt-A-GlanceThe S&P 500 endedFebruary 8.6% below itsmost recent all-time highset on January 3, 2022.The Dow Industrials lost1,239 points (-3.29%) lastmonth. The Dow 30 indexended February 7.6%below its January 4, 2022record high.The Nasdaq Composite fell3.4% in January, ending themonth 14.2% below itsNovember 19, 2021 recordhigh and is down 12% YTD.Despite the two-month2022 slump, in the 23months since the March 23,2020 COVID-19 bearmarket low, U.S. stockshave still more thandoubled (S&P 500 101%,Nasdaq Comp. 83%-3.25%-3.09%-3.73%1Morningstar Direct (all equity performance is total return, which includes reinvested dividends)All three major U.S. equity indices fell a second-straight month, whipsawed byRussia’s war with Ukraine together with Western nations taking steps toisolate Russia. Disruptions to supplies from both nations’ raw materials suchas grain, metals and energy are likely to extend red-hot inflation and threatenglobal growth. The S&P 500 briefly dipped 10% below its peak and intocorrection status on February 23. It has slumped 8.2% over the past twomonths, its worst multi-month percentage loss since February-March 2020.The Cboe VIX Volatility Index surged a further 21% in February after soaring44% in January. Geopolitical risks are overshadowing mostly solid fourthquarter corporate earnings as investors try to gauge what the impact will be toglobal economies.Russia is paying a high price for its invasion into Ukraine with economicsanctions targeting Russian banks, companies and wealthy individuals,sparking a currency collapse for the ruble. This in turn, prompted Russia’scentral bank to more than double its primary interest rate to 20% from 9.5%.Sanction effects are also increasing risks that Russian securities may comeunder review for exclusion from benchmark indices, thus potentially cutting offtheir inclusion within the investment-fund industry. Moreover, the growing listof nations opting to exclude Russian lenders from the SWIFT messagingsystem could stir missed payments and overdrafts within the internationalbanking system. As February drew to a close, S&P downgraded Russia’scredit rating to below investment-grade status (BB from BBB-) and loweredUkraine to B- from B.As shown below, six of the nine style boxes ended negative last month, withsmall cap core, growth and value outperforming with small gains. The Russell1000 Value index outperformed the Russell 1000 Growth index for the thirdstraight month and a year-to-date (YTD) performance differential of just over9%. The top three performing sectors this year are all value-oriented, includingEnergy, Financials, and Consumer Staples.
Style Box Index returns above are represented by: Large Value (Russell 1000 Value), Large Core (Russell 1000), Large Growth(Russell 1000 Growth), Mid Value (Russell Mid Cap Value), Mid Core (Russell Mid Cap), Mid Growth (Russell Mid Cap Growth), SmallValue (Russell 2000 Value), Small Core (Russell 2000), Small Growth (Russell 2000 Growth). Source: Morningstar Direct, total returnbased, including reinvested dividends.In additional sector performance below, among the 11 major groups only Energy posted positive returnslast month and YTD. Real Estate and Communication Services fell the most in February, while Real Estateand Consumer Discretionary are down the most so far this year.Top Performers – February1Top Performers – YTD 1Energy ( 7.13%)Industrials (-0.87%)Healthcare (-1.02%)Bottom Performers – FebruaryEnergy ( 27.59%)Financials (-1.30%)Consumer Staples (-2.77%)Bottom Performers – YTD 1Technology (-4.90%)Real Estate (-4.91%)Communication Services (-6.98%)Communication Services (-12.75%)Real Estate (-13.00%)Consumer Discretionary (-13.28%)Morningstar Direct (all performance percentages are total return based, which include reinvested dividends)Foreign equity market performance was uneven relative to U.S. equities in February, with the MSCI EAFEIndex (representing developed markets outside of the U.S. and Canada) falling around 1.2% less than theS&P 500. Germany (-6.90%) posted outsized losses among Europe’s overall 2.8% loss. Emerging marketsmatched the 3% U.S. loss even as Russian equities cratered nearly 53% to extend its YTD loss to nearly57%. Mainland China tumbled 3.9% and is down 6.7% YTD.Turning to fixed income markets, U.S. Treasurys outperformed equities, with the Bloomberg U.S.Government Bond Index (-0.66%) falling significantly less. On a broader basis, investment-grade bonds ofall types fell just over 1.1% in February while higher-risk, non-investment grade high yield corporate bondsfell around 1%. Municipal bonds of all types fell the least, down 0.36%, becoming the second best bondperformer behind U.S. Treasury TIPS which gained 0.85%.This report is created by Cetera Investment Management LLC. For more insights and information from theteam, follow @CeteraIM on Twitter.
About Cetera Investment ManagementCetera Investment Management LLC is an SEC registered investment adviser owned by Cetera FinancialGroup . Cetera Investment Management provides market perspectives, portfolio guidance, modelmanagement, and other investment advice to its affiliated broker-dealers, dually registered broker-dealersand registered investment advisers.About Cetera Financial Group“Cetera Financial Group” refers to the network of independent retail firms encompassing, among others,Cetera Advisors LLC, Cetera Advisor Networks LLC, Cetera Investment Services LLC (marketed asCetera Financial Institutions or Cetera Investors), Cetera Financial Specialists LLC, and First AlliedSecurities, Inc. All firms are members FINRA / SIPC. Located at 655 W. Broadway, 11th Floor, SanDiego, CA 92101.DisclosuresIndividuals affiliated with Cetera firms are either Registered Representatives who offer only brokerageservices and receive transaction-based compensation (commissions), Investment AdviserRepresentatives who offer only investment advisory services and receive fees based on assets, or bothRegistered Representatives and Investment Adviser Representatives, who can offer both types ofservices.The material contained in this document was authored by and is the property of Cetera InvestmentManagement LLC. Cetera Investment Management provides investment management and advisoryservices to a number of programs sponsored by affiliated and non-affiliated registered investmentadvisers. Your registered representative or investment adviser representative is not registered withCetera Investment Management and did not take part in the creation of this material. He or she may notbe able to offer Cetera Investment Management portfolio management services.Nothing in this presentation should be construed as offering or disseminating specific investment, tax, orlegal advice to any individual without the benefit of direct and specific consultation with an investmentadviser representative authorized to offer Cetera Investment Management services. Informationcontained herein shall not constitute an offer or a solicitation of any services. Past performance is not aguarantee of future results.For more information about Cetera Investment Management, please reference the Cetera InvestmentManagement LLC Form ADV disclosure brochure and the disclosure brochure for the registeredinvestment adviser your adviser is registered with. Please consult with your adviser for his or her specificfirm registrations and programs available.No independent analysis has been performed and the material should not be construed as investmentadvice. Investment decisions should not be based on this material since the information contained here isa singular update, and prudent investment decisions require the analysis of a much broader collection offacts and context. All information is believed to be from reliable sources; however, we make norepresentation as to its completeness or accuracy. The opinions expressed are as of the date publishedand may change without notice. Any forward-looking statements are based on assumptions, may notmaterialize, and are subject to revision.All economic and performance information is historical and not indicative of future results. The marketindices discussed are not actively managed. Investors cannot directly invest in unmanaged indices.Please consult your financial advisor for more information.Additional risks are associated with international investing, such as currency fluctuations, political andeconomic instability, and differences in accounting standards.GlossaryThe Bloomberg Barclays Capital U.S. Aggregate Bond Index, which was originally called the LehmanAggregate Bond Index, is a broad-based flagship benchmark that measures the investment grade, USdollar-denominated, fixed-rate taxable bond market. The index includes Treasuries, government–relatedand corporate debt securities, MBS (agency fixed-rate and hybrid ARM pass-throughs), ABS and CMBS
(agency and non-agency) debt securities that are rated at least Baa3 by Moody’s and BBB- by S&P.Taxable municipals, including Build America bonds and a small amount of foreign bonds traded in U.S.markets are also included. Eligible bonds must have at least one year until final maturity, but in practicethe index holdings has a fluctuating average life of around 8.25 years. This total return index, created in1986 with history backfilled to January 1, 1976, is unhedged and rebalances monthly.The Bloomberg Barclays US Municipal Bond Index covers the USD-denominated long-term taxexempt bond market. The index has four main sectors: state and local general obligation bonds, revenuebonds, insured bonds, and prerefunded bonds. Eligible securities must be rated investment grade(Baa3/BBB- or higher) by Moody’s and S&P and have at least one year until final maturity, but in practicethe index holding have a fluctuating average life of around 12.8 years. This total return index is unhedgedand rebalances monthly.The Bloomberg Barclays US Corporate High Yield Index measures the USD-denominated, noninvestment grade, fixed-rate, taxable corporate bond market. Securities are classified as high yield if themiddle rating of Moody's, Fitch, and S&P is Ba1/BB /BB or below, excluding emerging market debt.Payment-in-kind and bonds with predetermined step-up coupon provisions are also included. Eligiblesecurities must have at least one year until final maturity, but in practice the index holdings has afluctuating average life of around 6.3 years. This total return unhedged index was created in 1986, withhistory backfilled to July 1, 1983 and rebalances monthly.The Barclays U.S. Government Bond Index is comprised of the U.S. Treasury and U.S. AgencyIndices. The index includes U.S. dollar-denominated, fixed-rate, nominal US Treasuries and US agencydebentures (securities issued by US government owned or government sponsored entities, and debtexplicitly guaranteed by the US government). The US Government Index is a component of the U.S.Government/Credit and U.S. Aggregate Indices, and eligible securities also contribute to the multicurrency Global Aggregate Index. The U.S. Government Index has an inception date of January 1, 1973.The Bloomberg Commodity Index is a broadly diversified index that allows investors to track commodityfutures through a single, simple measure. It is composed of futures contracts on physical commoditiesand is designed to minimize concentration in any one commodity or sector. It currently includes 19commodity futures in five groups. No one commodity can comprise less than 2% or more than 15% of theindex, and no group can represent more than 33% of the index (as of the annual reweightings of thecomponents).The Cboe Volatility Index (VIX ) is a key measure of market expectations of near-term volatilityconveyed by S&P 500 stock index option prices.The MSCI EAFE is designed to measure the equity market performance of developed markets (Europe,Australasia, Far East) excluding the U.S. and Canada. The Index is market-capitalization weighted.The MSCI Emerging Markets is designed to measure equity market performance in global emergingmarkets. It is a float-adjusted market capitalization index.The Russell 1000 Growth Index measures the performance of the large-cap growth segment of the U.S.equity universe. It includes those Russell 1000 Index companies with higher price-to-book ratios andhigher forecasted growth values.The Russell 1000 Value Index measures the performance of the large-cap value segment of the U.S.equity universe. It includes those Russell 1000 Index companies with lower price-to-book ratios and lowerforecasted growth valuesThe Russell 2000 Index measures the performance of the small-cap segment of the U.S. equity universeand is a subset of the Russell 3000 Index representing approximately 10% of the total marketcapitalization of that index. It includes approximately 2000 of the smallest securities based on acombination of their market cap and current index membership.
The Russell 3000 Index measures the performance of the largest 3,000 U.S. companies representingapproximately 98% of the investable U.S. equity market.The Russell Midcap Index measures the performance of the mid-cap segment of the U.S. equityuniverse and is a subset of the Russell 1000 Index. It includes approximately 800 of the smallestsecurities based on a combination of their market cap and current index membership. The RussellMidcap represents approximately 31% of the total market capitalization of the Russell 1000 companies.The S&P BSE SENSEX Index is a free-float market-weighted index of 30 well-established and financiallysound stocks on the Bombay Stock Exchange, representative of various industrial sectors of the Indianeconomy.The S&P 500 is a capitalization-weighted index of 500 stocks designed to measure performance of thebroad domestic economy through changes in the aggregate market value of 500 stocks representing allmajor industries.The Dow Jones Industrial Average is a price-weighted average of 30 significant stocks traded on theNew York Stock Exchange and the NASDAQ.The NASDAQ Composite Index includes all domestic and international based common type stockslisted on The NASDAQ Stock Market. The NASDAQ Composite Index is a broad-based capitalizationweighted index.The Shanghai Composite Index is a stock market index of all stocks (A shares and B shares) that aretraded at the Shanghai Stock Exchange.The U.S. Dollar Index is a weighted geometric mean that provides a value measure of the United Statesdollar relative to a basket of major foreign currencies. The index, often carrying a USDX or DXY moniker,started in March 1973, beginning witha value of the U.S. Dollar Index at 100.000. It has since reached a February 1985 high of 164.720, andhas been as low as 70.698 in March 2008.West Texas Intermediate (WTI) is a crude oil stream produced in Texas and southern Oklahoma whichserves as a reference or "marker" for pricing a number of other crude streams. WTI is the underlyingcommodity of the New York Mercantile Exchange's oil futures contracts.
Cetera Financial Institutions or Cetera Investors), Cetera Financial Specialists LLC, and First Allied Securities, Inc. All firms are members FINRA / SIPC. Located at 655 W. Broadway, 11th Floor, San Diego, CA 92101. Disclosures Individuals affiliated with Cetera firms are either Registered Representatives who offer only brokerage