Transcription
AcknowledgementsAll data presented here were collected by the author. Some of theexamples shown were part of studies funded by the United StatesFederal Highway Administration, Pittsburgh Clean Cities, New YorkCity Department of Transportation, Port Authority of New York andNew Jersey, IdleAire Corporation, California Air Resources Board,and others. Some work has been done as portion of author’sgraduate studies. Part of the work, including compilation andpreparation of this presentation, has been done at the Josef BožekII. Internal Combustion Engine and Automobile Research Center,funded by the Czech Ministry of Education, project no.1M68407700002.
11th ETH Conference on Combustion Generated NanoparticlesZurich, 13th - 15th August 2007Real-time, on-road measurements ofdiesel exhaust aftertreatmentdevice PM removal efficiencyMichal Vojtíšek-LomTechnical University of LiberecDepartment of Vehicles and Engines, Faculty of Mechanical EngineeringHálkova 6, 461 17 Liberec, Czech Republic, michal.vojtisek@tul.cz, tel. 420 774 262 854Thomas R. LanniBureau of Mobile Sources, Division of Air QualityNew York State Department of Environmental ConservationAlbany, New York, USA(New York City measurements portion)
BackgroundModern engines increasingly rely on the combination ofelectronic engine controls and exhaust aftertreatmentdevices to achieve low emissions.Various deviations from “ideal operation” typically resultin substantially higher emissions.Small number of vehicles and small portion of totaloperating time have a disproportionately highcontribution to the total emissions.
Example: On-road tests of CNG buses(Pittsburgh, USA, 1996-99)
Example: On-road tests of CNG busesHC emissions deterioration 50.50.50.00.00.00.0004411115000 10000 15000 20000 25000 300005000 10000 15000 20000 25000 30000test mileagetest mileage005000 10000 15000 20000 25000 300005000 10000 15000 20000 25000 30000test mileagetest mileage
Example: On-road tests of CNG busesDifferences among identical vehicles0.80Vehicle 1Vehicle 11Vehicle 200.70CO (g/km)0.600.500.400.300.200.100.000.000.200.40NOx (g/km)0.600.80
Why on-road measurements?When evaluating benefits of a fleet-wide deployment ofa new technology, high emissions vehicles and highemissions episodes cannot be ignored as “outliers”, butmust be characterized and accounted for.On-road measurements using portable on-boardsystems allow for testing of a large set of vehiclesunder a wide range of operating conditions.Measurements can be done during normal everydayoperation of the tested equipment.
Evaluation of aftertreatment devicesUse one monitoring system. Run separate identical testswith and without aftertreatment, compare. Relatively easy test– Tests have to be repeatableReal-time or proportional sampling instrumentationUse two monitoring systems, one upstream, onedownstream of the aftertreatment Tests do not have to be repeatable– More difficult realization of the testInstrumentation has to measure in real-time (1 Hz)
Repeatability of on-road measurementsInstrumentation:- Five-gas (HC, CO, NO, CO2, O2) “garage” analyzer- Light scattering device for PM concentration measurements- Sampling: No dilution, no heating of the line- Exhaust flow: Computation based on engine rpm, intake airtemperature and pressure, engine parameters and exhaust composition- Second-by-second dataVehicle: 1999 International 24-passenger bus, DT-444-E 145 kW,7.3-liter V-8 electronically controlled direct-injection turbodiesel
On-road tests on a test track can be repeatablespeed [mph]Bus operating on different blends of diesel fuel and di-methyl ether (DME)Emissions measured using Manhattan Bus cycle driven on a 1,6 km test trackManhattan Bus Driving Cycle - target road esel - no DME2500PM emissions [ug/s]301Manhattan Bus39142145114% DME / dieselblend48151154125% DME / 71301331361391421451481Test-to-test variance: 10% for computed total PM mass511541
Measurements in ordinary traffic arepoorly repeatableExample: VW Golf / Jetta cars powered by diesel fuel andvegetable oil. Multiple runs along a 20,9 km suburban-highway-cityroute.Unlike in laboratory tests, comparison is done on a distance basis(x-axis: distance from start of the test)120VO-1D-1D-2VO-2D-3D-4VO-3VO-4VO-5D-5D-6road speed [km/h]10080604020002468101214161820elapsed km
NOx emissions [mg/s]Example: VW Golf car powered by diesel fuel and vegetable oil.Multiple runs along a 20,9 km suburban-highway-city VO-3VO-5D-502468101214161820 elapsed kmPM emissions 68101214161820 elapsed km
Simultaneous upstream-downstreamsamplingMore weight, higher power consumption, decreasedsystem reliabilityImpossible to sample from a laminar flow upstream ofthe aftertreatment due to exhaust system geometry ofmost enginesBut: Most diesel particles 1 um; if sampling PM1 orPM0.5, sampling error is relatively small compared toother factorsPilot studies done using a simple light-scattering device
Simple on-board systems can be capable of repeatablemeasurements in the lab even at 0.01 g/kWh levels(but no claims about accuracy)2000 International 3400 truck, DT-466-E turbodiesel, CRT trapCBD cycle driven on a chassis dynamometerPM concentrations measured with a light scattering device, exhaust flow computedPM [micrograms per second]100001000CBD ColdCBD Hot 1CBD Hot 2CBD Hot 310010113016019011201150118012101
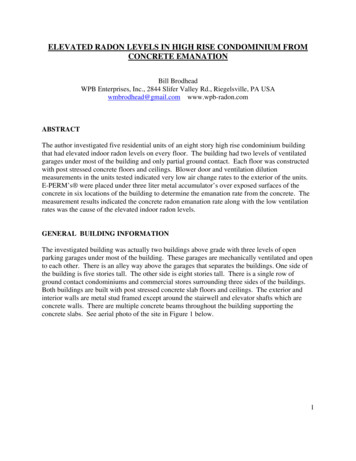
On-board PM concentrations measurement usinga light scattering instrument¾ Samples raw, undiluted exhaust from the tailpipe using 6 mm sample line¾ Real-time measurements of PM scattering efficiency¾ Robust, easy to use, low power consumption¾ Data requires considerable interpretation4. ScatteringdetectorSAMPLE FLOWLASER BEAM PATHDETECTOR5. Flowcontrol2. Impaction of condensateand large particles6. Pump3. Samplereheat1. Sample inlet
On-line diesel oxidation catalyst evaluationSimultaneousUpstream /DownstreamSampling(2 monitoringSystems)Exhaust samplingport before catalyst,¼” probe, unheatedline, no dilutionExhaust sampling attailpipe¼” probe, unheatedline, no dilutionConstruction equipment, World Trade Center, New York
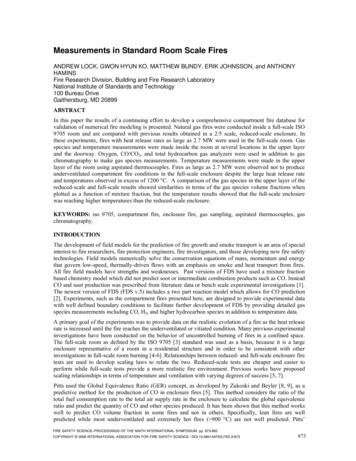
On-line diesel oxidation catalyst evaluationThree sampling locations: Identical sample ports upstream anddownstream of DOC, ordinary probe at the tailpipeTwo monitoring systems (light scattering device for PM concentrations)10PM[mg/m3]DSampledfrom- Unitport APM[mg/m3]- Unit Fof DOC9upstream8PM [mg/m3]7Sampledfrom fPortdownstreamof DOCtailpipe probeupstreamof DOCDOCSampleSampledfrom portupstream eamportportdownstreamof DOCof DOCSampled fromSmplportline downstreamswap of mpledSmplfromlinetailpipeswapprobe16:00(MQ 100 kVA electric generator, 6.8-liter, 135-hp John Deere engine)
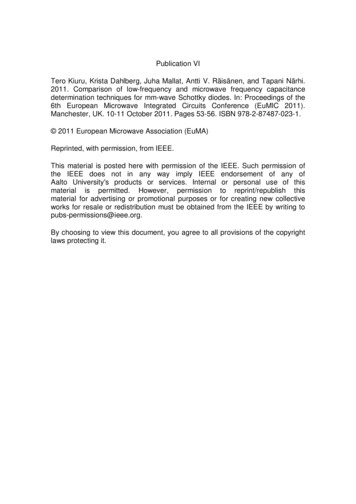
Engine-out vs. tailpipe-out: New York City ferries(Staten Island Ferry, Manhattan - Staten Island) True in-use testing 2 x Caterpillar 3516 V-161155 kW drive engines Baseline for biofuels andSCR evaluation Sampling at turbochargeroutlet AND at stack endF20710C1000EngineAF20711BoutEngineV20710DB outV20711BStack Stack-Opacityout (alternating)100Stack opacityStack-PM907010060504010302010122:00 22:30 23:00 23:30 0:00 0:301:001:302:00 2:303:003:30 4:004:305:00 5:3006:00Stack opacity [%]Exhaust PM [mg/m3]80
On-line diesel oxidation catalyst evaluation In-use emissions testing on construction equipmentduring regular operation at the World Trade Center no. 7site, New York, NY Operation not repeatable and difficult to simulate Simultaneous upstream and downstream 6:58 16:59 17:00 17:01 17:02 17:03 17:04 17:05 17:06 17:07 17:08 17:09 17:10DOC efficiency [%]PM [g/h]Downstream
On-road emissions from recycled frying oil studyVW Golf / Jetta 1,9 TDI cars with GreaseCar vegetable oil conversionFuels: Highway diesel fuel and a mix of recycled frying oil from different sourcesVegetable oil heated to 60 C fuel temperature at injection pump inlet20,9 km suburban / highway / urban test routeEmissions measurements upstream and downstream of DOCData still being analyzedSuburban VO-3VO-4VO-5D-5D-6road speed ed km
Passenger car DOC efficiency – diesel fuelVW Jetta 1,9 TDI, 20,9 km test route in ordinary trafficPM emissions [mg/s]5Simultaneous 1012PM emissions [mg/s]314161820 elapsed kmSampling on two separate 468101214161820 elapsed km
Passenger car DOC efficiency – vegetable oilVW Jetta, 20,9 km test route in ordinary trafficSimultaneous samplingPM emissions 1618Sampling on two separate runs10PM emissions [mg/s]820 elapsed 0 elapsed km
Passenger car DOC efficiency – diesel vs. vegetable oilVW Jetta, 20,9 km test route in ordinary trafficDiesel-UpstreamDiesel-DownstreamPM emissions [mg/s]10Diesel fuel10.10.010246810PM emissions [mg/s]101214161820 elapsed kmVO-DownstreamVO-UpstreamVegetable oil10.10.0102468101214161820 elapsed km
Passenger car DOC efficiency – difference in catalysts20,9 km test route in ordinary trafficPM emissions [mg/s]10Upstream-1Downstream-1Poor catalyst performance10.10.010246810PM emissions [mg/s]101214161820 elapsed kmDiesel-UpstreamDiesel-Downstream“Normal” operation10.10.0102468101214161820 elapsed km
Passenger car DOC efficiency – diesel fuel vs. vegetable oil20,9 km test route in ordinary trafficTransient high loadsOverfueling conditionsRelatively infrequentPM dominated by sootIdle (also prolonged idling)Low exhaust and catalyst temperaturesPM dominated by organicsPM emissions vs. engine torque - Vegetable oilPM emissions vs. engine torque - Diesel fuel1010.1Diesel.DownstreamMean.DownstreamPM concentration [relative]PM concentration n.UpstreamMean.Downstream0.0102468CO2 in raw exhaust [%] (as a surrogate of engine torque)100.0102468CO2 in raw exhaust [%] (as a surrogate of engine torque)During bulk of the medium load operation, PM concentrations are lowerfor vegetable oil; but mean PM concentrations are higher, suggesting thata large contribution to the total comes from transients10
Passenger car DOC efficiency – diesel fuel vs. vegetable oilMean vs. median values – median values suppress transientsPM emissions vs. engine torque - Vegetable oilPM emissions vs. engine torque - Diesel fuel1010.1Diesel.DownstreamMean.DownstreamPM concentration [relative]PM concentration n.UpstreamMean.Downstream0.0102460.0180CO2 in raw exhaust [%] (as a surrogate of engine torque)468PM emissions vs. engine torque - Vegetable oilPM emissions vs. engine torque - Diesel fuel101010.1Diesel.DownstreamMedian.UpstreamPM concentration [relative]PM concentration [relative]2CO2 in raw exhaust [%] (as a surrogate of engine ownstream0.010246CO2 in raw exhaust [%] (as a surrogate of engine torque)8Mean.Downstream0.010246CO2 in raw exhaust [%] (as a surrogate of engine torque)8
Passenger car DOC efficiency – diesel fuel vs. vegetable oilDiesel oxidation catalyst efficiency - Veg. oilDiesel oxidation catalyst efficiency - Diesel fuel20%PM conc. drop across DOCPM conc. drop across 50%-60%-60%002468exhaust CO2 [%] (as a surrogate of engine torque)2468exhaust CO2 [%] (as a surrogate of engine torque)Diesel oxidation catalyst efficiency - Veg. oilDiesel oxidation catalyst efficiency - Diesel fuel20%PM conc. drop across DOC20%PM conc. drop across 0%-40%-50%-60%0.11PM concentration [relative]1001PM concentration [relative]10
PM dynamics within the exhaust system Secondary growth of PM Deposition, storage and re-entrainment of PMMost pronounced– during and following idle and low loads– with long exhaust systems– with high aerosol fraction of PMMust be differentiated from the aftertreatment deviceeffects
Effect of prolonged idling on PM emissions1999 Freightliner truck, CAT 3406 engine, 150,000 miles 8-hour extended idling test Idle AireTechnologies, Knoxville, TN, December 17, 2001
Effect of prolonged idling on emissionsduring subsequent driving Class 8 truck idled for 8 hours at highidle, then driven for 32 miles on aninterstate highway PM emissions were sampled at theturbocharger outlet (engine-out) andat each stack (tailpipe) using threeportable, on-board systems1999 Freightliner truck, CAT 3406 engine, 150,000 miles 8-hour extended idling test Idle Aire Technologies,Knoxville, TN, December 17, 2001
Field test – excavator with diesel particulate filterEmissions measured simultaneously upstream & downstream of DPFduring a field test designed to mimic real-world operationPM emissions [mg/s]Typical test run, construction equipment with diesel particulate trapEngine-out10Tailpipe10.1PMidleloadedloaded modeidleidle :140:16PM emissions [mg/s]Test run after prolonged idling: Elevated PM during high load 0:040:060:080:100:120:140:16PM
Example: Effect of driving styleon particulate matter emissions1991 International school bus195-hp DTA-360 turbodieselArea of bubble proportional to emissionsEach point 1 second of drivingNormaldrivingAggressivedrivingVery calm,“zen master”drivingSource: Author data, personal research
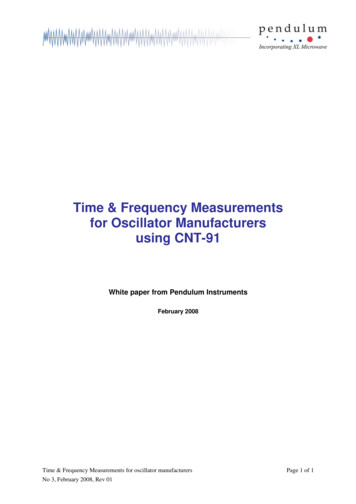
Crude evaluation of overall diesel oxidationcatalyst function by CO measurementsExtreme case: Bus catalyst operational only during sustained high load operationMeasurement is far from accurate (repair-grade analyzer used), but useful for the purpose.1Engine rpm0,90,8ColdGPS mphrpmstartHeavy urban 00%50%0,060%0,05B CO[g/s]RedP CO[g/s]– emissions upstream of DOCBlue –d CO[%]emissions downstream of 3:3013:4514:0014:1514:30-300%14:45PTI vs. UBunit difference0,07Catalyst efficiencyEmissionsCOg/s emissions (g/s)Green – catalyst efficiency
Discussion – PM sampling,PM measurement using light scattering Dilution at the sampling port upstream of aftertreatment adds to thecomplexity of the system No dilution, no heating of the sampling system – secondary growth ofPM in the sampling system, plus condensation of water vapor contained inthe exhaust on particles Low concentration – counting of individual particles possible butgenerally not possible without dilution High concentration – “aggregate” number but some size information canbe obtained with very fast sampling Response d6Response d2Response d0For soot, massfor particles wavelength of lightfor particles wavelength of lightif particles grown to uniform size dfd, where fd fractal dimension of particles Complexity of issues requires careful use and thoughtful, applicationspecific calibration with other methods; still, results might not be accurate
Discussion – accuracy of on-road measurementsOn-road testingWide intermediate areaDevelopment and pilotdeployment of ionof the2.52.5effects2233171718182020Inspection programsHigh-volume, fast, lowcost field testingGoal is to identify highemitters (order-ofmagnitude deviations)2.02.01.51.51.01.00.50.50.00.00Basic applied researchLow-volume laboratorytestingCan be costly and complexGoal: Laboratory quality data05000 10000 15000 20000 25000 300005000 10000 15000 20000 25000 30000test mileagetest mileageAccuracy and other parameters of onboard test equipment and methodsneed to be carefully matched to theneeds of the application.
Crude evaluation of overall particulate trapfunction by visual inspectionVisible soot: Signs ofmechanical problemNo visible traces of soot Trap function probably OK
Conclusions Aftertreatment device evaluation requires, after initialdevelopment but before mass deployment, testing of a large set ofvehicles under a variety of conditions; such testing can be done onthe road Studies done using a simple on-board system show thatrepeatable measurements can be obtained by replicatingdynamometer driving cycles on a closed road; tests can be thendone alternately with and without the aftertreatment device Ordinary operation (i.e., of a vehicle on the road) is generallypoorly repeatable; in this case, measurements can be done bysimultaneous sampling upstream and downstream of theaftertreatment device Studies done using a simple on-board system show that errorsdue to non-isokinetic sampling upstream of the device appear to berelatively small (compared to other sources of error) Simultaneous emissions measurements upstream anddownstream of an aftertreatment device appear to be afeasible way of evaluating its efficiency in real-worldoperation.
Manhattan Bus Driving Cycle - target road speed 0 5 10 15 20 25 30 1 31 61 91 121 151 181 211 241 271 301 331 361 391 421 451 481 511 541 speed [mph] Manhattan_Bus 0 500 1000 1500 2000 2500 1 31 61 91 121 151 181 211 241 271 301 331 361 391 421 451 481 511 541 PM emissions [ug/s] 25% DME / diesel blend