Transcription
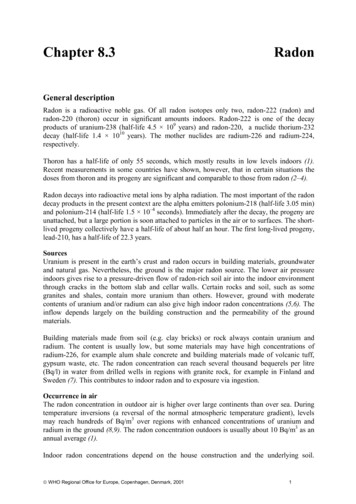
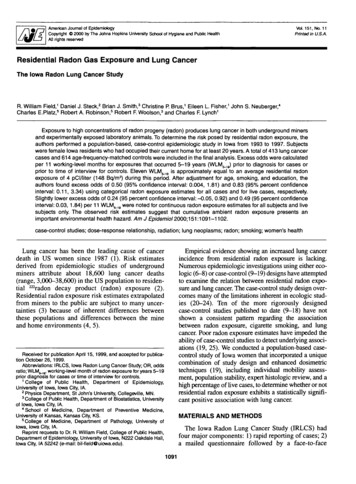
ELEVATED RADON LEVELS IN HIGH RISE CONDOMINIUM FROMCONCRETE EMANATIONBill BrodheadWPB Enterprises, Inc., 2844 Slifer Valley Rd., Riegelsville, PA USAwmbrodhead@gmail.com www.wpb-radon.comABSTRACTThe author investigated five residential units of an eight story high rise condominium buildingthat had elevated indoor radon levels on every floor. The building had two levels of ventilatedgarages under most of the building and only partial ground contact. Each floor was constructedwith post stressed concrete floors and ceilings. Blower door and ventilation dilutionmeasurements in the units tested indicated very low air change rates to the exterior of the units.E-PERM’s were placed under three liter metal accumulator’s over exposed surfaces of theconcrete in six locations of the building to determine the emanation rate from the concrete. Themeasurement results indicated the concrete radon emanation rate along with the low ventilationrates was the cause of the elevated indoor radon levels.GENERAL BUILDING INFORMATIONThe investigated building was actually two buildings above grade with three levels of openparking garages under most of the building. These garages are mechanically ventilated and opento each other. There is an alley way above the garages that separates the buildings. One side ofthe building is five stories tall. The other side is eight stories tall. There is a single row ofground contact condominiums and commercial stores surrounding three sides of the buildings.Both buildings are built with post stressed concrete slab floors and ceilings. The exterior andinterior walls are metal stud framed except around the stairwell and elevator shafts which areconcrete walls. There are multiple concrete beams throughout the building supporting theconcrete slabs. See aerial photo of the site in Figure 1 below.1
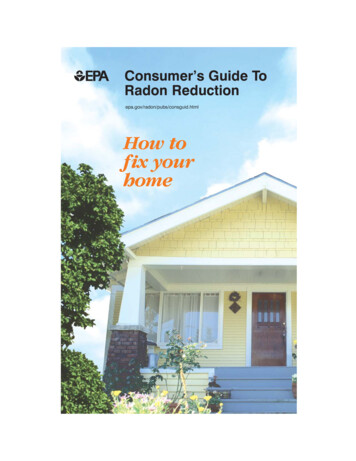
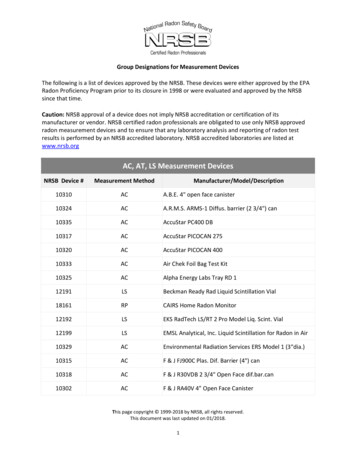
Figure 1 1998 aerial view of the buildingFigure 1 Aerial Photo of both BuildingsBuilding Radon MeasurementsShort term radon measurements were made by independent testing contractors in 23 differentunits mostly in the Fall of 2007. The radon measurements in the units varied from 4.0 pCi/l (150Bq/m3) to a high of 16.3 pCi/l ( 600 Bq/m3). The average of all the measurements was 7.5 pCi/l( 278 Bq/m3). Every floor of both buildings had units with radon measurements above the EPAguideline. Radon measurements in five different hallways averaged 6.2 pCi/l (230 Bq/m3).Three of the units had short term tests with the windows open. The radon levels with windowsopen ranged from 0.6 pCi/l (22 Bq/m3) to 3.0 pCi/l (111 Bq/m3). See the range of radonmeasurements in Figure 2 below.The parking garage under the building has a large exhaust fan on one side and a supply fan onthe other side. There were seven measurements made in the parking garage that ranged from 0.3pCi/l (11 Bq/m3) in two locations to a high of 2.9 pCi/l (107 Bq/m3). The elevator shaft in oneof the buildings measured 3.4 pCi/l (126 Bq/m3) and 4.5 pCi/l (167 Bq/m3).The garage measurements and elevator shaft measurements were all less than the measurementsin the units indicated that the source of the radon was not likely to be from the soil. There are noother air pathways from the lower level to the upper units other than the elevator shaft, the2
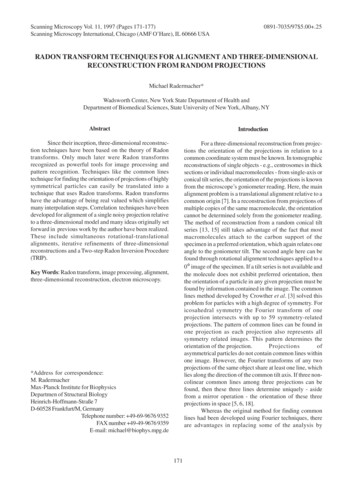
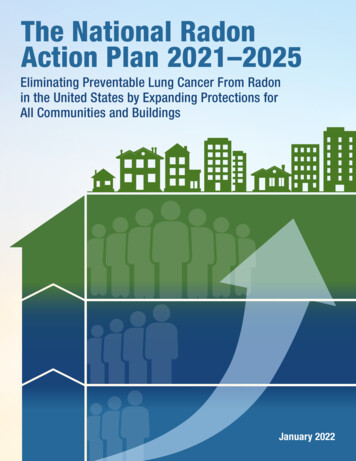
stairwell and possibly some small unsealed openings around conduit runs that are routed upthrough the building. There is no central HVAC system in the building. Each of the units hasit’s own heat pump air don levels in 23 measured units42012345678910 11 12 13 14 15 16 17 18 19 20 21 22 23Figure 2 Short term radon levels measured inside unitsDetermining the Source StrengthA charcoal canister sealed under a poly sheet against a concrete wall in the parking garageaveraged 97.7 pCi/l (3615 Bq/m3). This clearly demonstrated that there is significant radonemanation coming from the concrete at the location tested. This test does not however allow anyconclusion about how much radon is emanating from the concrete. Note that it is unclear ifcharcoal canisters can be used to reliably determine the radon emanation from a buildingmaterial.In order to quantify the radon emanation out of the concrete and to determine if there wassignificant variation in emanation rates in different locations, concrete emanation measurementswere made of the floor, ceiling and walls as well as the ambient air in three different locations ineach building. S chamber E-PERMs with short term electrets were used for these tests becausethey are true integrating detectors and multiple locations can be tested at the same time. Theemanation rate was determined by placing an E-PERM inside metal accumulators that weresealed to bare surfaces of the concrete. The accumulator was a stainless steel 3.0 liter mixingbowl that was carefully sealed to the concrete using a putty window sealer (Mortite by Frost3
King) that was placed on the lip of the bowl to form an air tight seal against the concrete. Seethe photos in Figure 3, 4 and 5 below. Note that in order to obtain the largest signal from theradon emanation from the concrete it is necessary to have as large a surface area versus free airvolume inside the accumulator as possible. The three liter mixing bowls provide 0.13 ft2 ofsurface area per liter of accumulator. The accumulator test was run from 16 to 23 hours at eachlocation. In each case the emanation tests were made on an exposed concrete floor, ceiling orwall of electrical room, storage room or stairwell. No emanation measurements could be madein a unit because there was no exposed concrete.Figure 3 E-PERM placed inside Emanation Bowl with edge sealing4Figure 4 E-PERM Slab Emanation with room air measurement
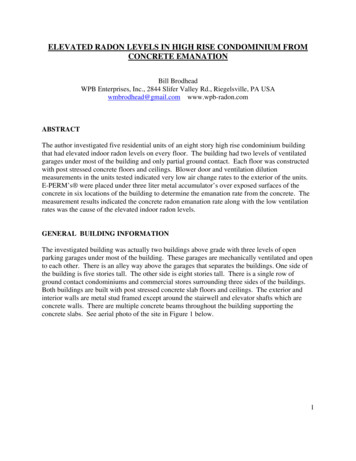
Figure 5 E-PERM Emanation of ceiling of electrical roomThe electret pre-exposure and post exposure voltages were used to obtain the average radonconcentration under the accumulator and in the room the accumulator tests was being performedin. Note that it is important to quantify the initial radon concentration when the accumulator issealed to the concrete, especially if the emanation rate is low. The average radon concentrationwas determined by exposing an E-PERM in the test location. This average concentration wasthen assumed to be the concentration in the air when the flux tests were started. A more exactmethod of obtaining the ambient radon at the beginning of the flux test is to expose an E-PERMinside a sealed glass jar that is available from Rad Elec for making radon in water measurements.The voltage loss of the electret sealed in the jar could be subtracted from each flux measurementvoltage loss to subtract out the influence of gamma as well as the ambient radon. Note that thereis about a 15% lower voltage loss of an electret starting with 250 initial volts versus an electretwith 750 initial volts that will cause a small bias.A Bicron Micro-Rem gamma survey meter was used to determine the gamma levels used incalculating the average radon concentration. The gamma measurements throughout the buildingvaried from a low of 4.0 μR/hr to a high of 10.0 μR/hr. There was not any significant increase ofgamma directly adjacent to the concrete which might influence the E-PERM reading. Note thatthe gamma variation would be more critical if a low emanation rate was being measured. Ineach case the gamma measurements made at the test locations were used in determining the EPERM radon measurement result.The E-PERM chambers were closed up immediately after being removed from the accumulator.A small correction factor of an additional 10% was added to the calculated emanation rate tocompensate for the additional radon and radon decay products that have entered the chamber but5
have not had sufficient time to discharge the electrets. This correction is not typically necessarywhen making longer measurements in a relatively stable radon concentration. An ingrowthmeasurement produces the highest radon concentration at the end of the measurement with acorresponding greater influence from the final radon and radon decay products left in thechamber from the exposure. WPB obtained this calibration adjustment by carefully measuringE-PERMs exposed to an ingrowth that were closed immediately and some E-PERMs that had thesame exposure but were left open in a low radon environment for an additional 3 hours beforereading the final voltage.The average radon measurement result from the E-PERM under the accumulator and the roomair measurement was used to determine the emanation rate by a simple formulae that did not takeinto consideration the change in ingrowth rate that happens over a multi-day exposure or becauseof back diffusion into the concrete that also happens with an increasing influence as the length ofthe measurement extends greater than a day. The emanation rate was determined by subtractingout the assumed or measured initial radon in air concentration (which is actually decaying away),the number of hours exposed, area the bowl covers and the free air inside the accumulator. Theconcrete emanation was calculated in units of pCi/ft2/hr. The emanation rate can be converted toBq/m2/hr by multiplying the pCi/ft2/hr by 0.398. See the results in Table 2 below. The radonemanation out of the concrete did not vary significantly across the building. The lowest resultwas 26.7 pCi/ft2/hr and the highest was 43.9 pCi/ft2/hr. For detailed information on thecalculations to use to determine the emanation rate for different length exposures refer to theauthors paper entitled “Measuring radon, thoron and action emanation from concrete and granitewith continuous radon monitors and e-perms, 2008”.LocationEast 5thFloorEast 6thFloorEast 7thFloorWest 3rdFloorWest 4thFloorWest 119.642.516.934.213.635.914.341.716.631.715.2Table 2 Concrete Emanation results for both buildings6
Although there is some variability in the emanation from the different locations there is actuallyreasonable consistence between all the measurements. The walls which are thicker did have thehighest average radon emanation rate. This indicates that it is likely that all of the concrete usedin both building has a similar emanation rate. The builder indicated that the same concretecompany was used for the entire project.There were four different locations where the concrete ceiling and the concrete slab floor directlyabove it were measured. The difference between the measurements in each case is given inTable 3 below.Concrete Ceiling36.243.937.040.6Concrete Floor26.742.632.042.5Ceiling versus Floor 35.6 % 3.1 % 15.6%- 4.5%Table 3 Variation between ceiling and floor above it emanation rateCozumuta, Graaf and Maijer in 2003 reported that although radon emanation out of concrete canvary by an order of magnitude depending on the relative humidity, there would typically be onlya 10-15% emanation difference in the indoor humidity range of 30% to 70% RH.The floors and ceilings were reported to be 7.5 inches (19 cm) thick. The thickness of theconcrete walls could not be determined. The average emanation rate from the walls was 23%greater than the average of the ceilings and slab but there is significantly more floors and ceilingsthan piers or walls in the building. This paper does not address the difference in emanation ratesbased on the thickness of the concrete. Note that emanation rate is not influenced by buildingpressures. Radon emanation can be significantly reduced by vinyl flooring or other densematerials that are sealed to the floor. Carpeting and drywall would likely provide very littlereduction in radon emanation rate. A section of concrete wall in the stairwell of the fifth floorwas tested over a painted section and an unpainted section. The painted concrete emanation testwas 9% lower. This variation is within the error range of the detectors so the conclusion is thatthe paint used in the stairwell on the concrete did not have a significant impact on reducing radonemanation from the concrete. The ceilings of the units were covered with drywall and the floorshad carpeting, vinyl, wood flooring or tile.MITIGATION BY ADDITIONAL VENTILATIONAlthough it is easy to say the units simply need more ventilation. The difficult questions are howmuch ventilation do they need and how can that ventilation be most practically, effectively andconsistently introduced into each unit. Increasing the ventilation carries a penalty in energy costs,7
occupant comfort, increased humidity as well as requiring the HVAC to handle any extra load.There would also be a significant cost to re-work a ventilation change if it was inadequate toreduce the radon levels below the EPA guideline or desired maximum final radon concentration.Discussions with Florida Department of Health officials revealed that there had been cases inFlorida were the increased unconditioned ventilation used to reduce the radon levels in similarbuildings had produced mold growth inside the dwelling. The ventilation increase thereforeneeds to be carefully designed and installed based on the exact amount of air each unit needs.Determining the Current Ventilation RateThere are a number of methods used to determine the ventilation rate of a building. Air changesper hour (ACH) is the common unit used to define the amount of building ventilation. ACH isconsidered to be the amount of air coming into and leaving a building in an hour compared to thetotal volume of the building. In general it isassumed that a building with 1.0 ACH is aleaky building. A typical home built in thefifties and sixties might have 0.5 or greaterACH. A recently built home wouldgenerally be thought to have about 0.3ACH. A very tight home would have 0.1ACH. ACH are determined by twomethods.One method known as a Blower Door Testhas a fan with a calibrated orifice blow airinto or out of a building. The pressureincrease or decrease compared to the airflow is used in blower door softwareprograms to calculate the total area ofopenings through the shell of the building.The amount of air flow needed to induce apressure in the building equal to 50 pascals(0.20” sp) is often divided by 20 toapproximate an average residentialbuildings natural ACH ventilation ThisACH rate is just an approximation and theACH rate will change with outdoor wind speedFigure 6 Blower door set upand direction as well as outdoor temperatureversus indoor temperature. This method of determining natural ventilation rate is based on atypical home having most of its exterior walls adjacent to the outdoors and it’s entire upper levelceiling adjacent to a ventilated attic. In a condominium there may be only one exterior wall thatis adjacent to the outdoors and the ceiling and floor is constructed of concrete. In addition anyexterior shell leakage to the hallway would not be adding outdoor ventilation. Therefore blower8
door determinations of natural ventilation rate of a building similar to this building would needto have a very different calculation than typical single family homes. Infiltec, a manufacturer ofblower doors, was consulted and they suggested that the ventilation rate could be approximatedby dividing the ACH rate obtained at 50 pascals of pressure by 40 instead of 20 however fromthe measurements made dividing the ACH rate at 50 pascals by 50 would be closerapproximation. See table 4 below.A more accurate method of determining the current ventilation rate is to make a directmeasurement of the ventilation rate by releasing a unique stable tracer gas into the air andmeasuring how long it takes for this tracer gas to be reduced. If there is minimal occupantactivity in the building, CO2 is often used because it is easy to measure, available and safe. CO2is already present in the outdoors and people exhaust it while breathing which complicates themeasurement. The condo units however have a constant source of radon that can be used for thetracer gas since the introduction of outdoor air is likely to have very little radon concentration.Measuring the change in radon levels as the ventilation is increased can then be back calculatedto determine what the ventilation rate is and how much additional ventilation will reduce theradon concentration.In five separate units the radon levels were measured hour by hour and the ventilation levelswere varied. Blower door measurements were also made to determine the leakage area of eachof these five units.Condo UnitEast 5th FloorEast 6th FloorWest 3rd floorWest 4th floor AWest 4th Floor BLeakage areain21751179475100Typical ACHrate(divide 50 Parate/20)0.240.380.270.280.23More likelyACH(divide 50 080.100.130.100.035Table 4 Blower door resultsBlower Door MeasurementsBlower door measurements were made in by varying the airflow with an HP220 fan that wasexhausting air while measuring the reduction in pressure in the unit compared to the hallway.Blower door depressurization provides a more realistic measure of leakage than pressurizationbecause it maintains bath fans and dryer exhaust louvers in a closed position.The first and last column in table 4 above has the actual measured leakage area and measuredventilation rate. The blower door results obtained at 50 pascals of pressure divided by 50 appear9
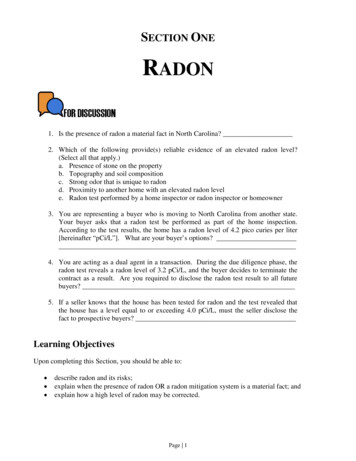
to be closer to the actual measured value. Note that this is 2 ½ times more air tight than mostresidential housing. Using standard blower door calculations to determine natural ventilation incondominiums is not recommended.16pCi/14lPyl 269Pyl 59812Pyl 35210femto 3718Femto 374Femto 384642hours01357911131517192123252729313335Figure 7 WPB Inter-Comparison of CRM monitorsTrace Gas MeasurementsThe continuous radon monitors used in this study wereinter-compared against three Femto-Tech 210 monitorsthat had just been calibrated at the factory. See the resultsin Figure 7 above.A base line radon measurement of the radon levels withthe doors and windows closed is required to measure theeffects of ventilation changes. Unfortunately in the threeoccupied units there were open windows and doors at thebeginning of the measurement period. See the photos inFigure 8 and 9 of the ventilation happening in one of theunits to reduce radon levels. In this particular unit theradon levels were reduced from 13.2 pCi/L (488 Bq/m3)down to around 1.0 pCi/L (37 Bq/m3) with the screenedwindow and patio door left adjar.Figure 8 Occupant kept bedroomdoor to patio open10
The radon levels were measured over the next 24hours as the radon levels climbed to a typicalclosed house level. Once the typical closedhouse radon levels were obtained a knownquantity of outdoor air was added to each unitand the change in radon levels was thenmeasured. The change in radon concentrationversus the quantity of air being introduced wasused to determine the natural ventilation rate thattook place during the testing period. Thisventilation rate can then be used to predict whatthe ventilation rate was during the previous testingthat produced the elevated radon concentrations.This measurement and back calculation can alsobe used to determine the amount of additionalventilation of outdoor air that is necessary tomaintain radon levels below the EPA actionguideline.Figure 9 Occupant placed screen inwindow opening for ventilationIn five units plywood frames were secured in anexterior window. In each frame a small fan wasinstalled that included a heater in case theoccupants felt the air was cooling the unit toomuch. The air flow was carefully measured usinga 6” flow grid that had been previously calibratedwith a low flow bolometer. See photo in Figure10 belowThe windows and exterior doors in all the unitswere closed during the diagnostic testing period.The windows and exterior doors in the two eastunits were closed prior to the diagnostic testingbecause the units were vacant. The followingradon graphs in Figure 11 through 15 depict theinitial baseline radon levels that were achievedand the levels that were achieved as additionalventilation was added. Note, there was aFigure 10 Combination ventilation fan and heaterstrong rain and wind weather patternwith calibrated flow grid airflow measuring setuphappening during the first 24 hours of themeasurement period.11
8.0pCi/L959 ft2t8631 ft3East 5th FloorvacantWindows were closedbefore test7.02400 ft2concrete2.0 pCi/l at 0.014 CFMper ft2 concrete6.05.0Windowsclosed4.0Natural0.08 ACH12 CFMCRMglitchadded20 CFMOA3.00.005 CFMper ft2concreteadded41 CFMOA2.01.0Blower doorindicated0.12 ACH / 17 CFM75 SI of opening0.013 CFMper ft2concreteHours0.022 CFM per ft2concretenn0.0Figure 11 Radon Reduction from Increased Outdoor Air12
5.0Windows were closedbefore test4.5pCi/LEast 6th Floorvacant1039 ft29351 ft32475 ft2concrete2.0 pCi/l at 0.011 CFMper ft2 concrete4.03.53.0added41 to 35CFM OAWindowsclosed2.5Natural0.10 ACH16 CFM2.01.51.00.5added59 CFMOA0.006 CFMper ft2concreteBlower doorindicated 0.19ACH / 28 cfm117 SI of opening0.02 CFMper ft2concretehours0.00.03 CFMper ft2concreteFigure 12 Radon Reduction from Increased Outdoor Air13
6.0Windows were openbefore test begunWest 3rd Floor1122 ft210,098 ft32850 ft2Concrete5.02.0 pCi/l at 0.017 CFMper ft2 concretepCi/L4.0Natural 0.13ACH22 CFM0.007 CFMper ft2concreteWindowsclosed3.0added34 CFMOAadded48 CFMOA2.01.00.02 CFMper ft2concreteBlower doorindicated0.13 ACH / 22 cfm94 SI of openinghours0.024 CFMper ft2concrete0.0Figure 13 Radon Reduction from Increased Outdoor Air14
4.5Windows were openbefore testWest 4th Floor A822 ft27394 ft31950 ft2Concrete4.02.0 pCi/l at 0.012 CFMper ft2 concretepCi/L3.5Windowsclosed3.0Natural0.10 ACH12 CFM2.50.006 CFMper ft2concrete2.0added23 CFMOA1.5Blower doorindicated0.12 ACH / 24 cfmadded36 CFMOA1.00.5Blower doorindicated 0.14ACH / 17 cfm0.001 CFMper ft2concrete100 SI of concreteFigure 14 Radon Reduction from Increased Outdoor Air15
3.0West 4th Floor BvacantWindows were openbefore test1434 ft212,906 ft33350 ft2concrete2.5pCi/L2.0 pCi/l at 0.003 CFMper ft2 concrete2.0Natural 0.035 ACH7.0 CFMWindowsclosed1.50.002 CFMper ft2concreteadded16 CFMOA1.0added30 CFMOABlower doorindicated0.12 ACH / 24 cfm0.5100 SI of opening0.001 CFMper ft2concreteHours0.00.006 CFMper ft2concreteFigure 15 Radon Reduction from Increased Outdoor Air16
MITIGATION RECOMMENDATIONSThe radon reduction achieved by the added ventilation during the diagnostic testing was used todeduce the ventilation rate at the test time. In Table 5 below the ventilation rate is compared tothe predicted radon levels inside the unit if 0.015 CFM of outdoor air is added for each ft2 ofconcrete that is adjacent to the interior area of the building. In four of the five units there wasreasonable correlation between the predicted values and the actual radon levels. In unit West 4thFloor B the radon levels were the lowest of all the units and yet this unit had the most squarefootage of concrete. This unit also backs up to the stairwell which provides more exposedconcrete from the stairwell poured concrete walls. There is no explanation why this unit’s radonlevels were so low. The reduction in radon achieved by the ventilation fan in unit West 4th FloorB was also the greatest amount which then calculates the units ventilation rate at one third thelevel of the other units. There is no explanation of why condo unit West 4th Floor B is behavingin this manner.UnitEast 5TH FloorEast 6th FloorWest 3rd FloorWest 4th Floor AWest 4th Floor .03210.99.513.210100.0420.0380.0480.0350.0080.015 CFMper ft2.concrete ACHof prev x1.71.41.71.30.41.51.41.71.61.8Table 5 Effect of adding 0.03 CFM/ft2 of floor area to each unitTable 5 above shows that the ventilation level in four of the condo units was around 0.1 ACHduring the diagnostic testing. Unit West 4th Floor B had one third this level.The ventilation rate that occurred during the previous tests that had higher radon levels can bededuced to be around 0.04 ACH. Moderate temperatures and lack of wind during the previousradon measurement can easily explain the ventilation rate being half of the ventilation raterecorded during the diagnostic visit.In the table above the predicted radon levels were determined by adding ventilation equal to0.015 CFM/Ft2 of exposed concrete plus the natural ventilation that existed during the previousradon test period when the natural ventilation rate was very low. In the last column this amountof added ventilation is used to determine the radon levels based on 40 pCi/SqFt/hr emanationsfrom the exposed concrete. The radon levels for both calculations are comparable except for unitWest 4th Floor B.17
Since the radon is coming from the concrete and the emanation rate did not vary significantly,the ventilation added to the building should be proportional to the concrete exposure. Theventilation rate for each unit will need to take into consideration all concrete that the unit isexposed to. Note that the diagnostic testing calculations used the square foot area of the condoand included an approximation for additional concrete walls and beams.It was therefore recommended that a minimum of 0.015 CFM be added to each unit for everysquare foot of concrete floor, concrete ceiling, concrete wall and concrete support column that isexposed to the unit with no less than 30 CFM per single bedroom unit and 45 CFM for a twobedroom unit. Additional ventilation may be appropriate.POSSIBLE MITIGATION OPTIONSNegative Pressure VentilationOne method of inducing ventilation into a building is to exhaust air out of the building fromcentral locations on each floor. Exhaust ducting could be routed from the hallways of each floorto the roof. This would tend to draw air from any leakage points in the building that have accessto the hallway. This method would cause varying amounts of air flow to happen to theindividual units. Units that have large gaps under the door way to the hallway would tend tohave higher air flows than those that having small gaps due to carpeting or other restrictions.This could be remedied by having a pass through transition grill installed between the inside ofeach unit and the drop ceiling of the hallway. The ventilation to each unit would then varydepending upon each units openings to the outdoors. A unit without an open window mightreceive very little ventilation while another unit that typically keeps its windows or doors openwould have large ventilation increases. This might require over sizing the exhaust system tocompensate. The owners that enjoy having windows or patio doors open might find that thissystem induces increased moisture gain during humid outdoor conditions. This approach wouldalso have reduced effectiveness on any level that had doors from the hallway to the outside.Hallway areas with doors to the outside would tend to get excessive moisture gain on days ofelevated outdoor humidity. Negative pressure ventilation is not recommended as the remediationmethod.Installation of ERVAnother method of increasing the ventilation is to install an Energy Recovery Unit (ERV) eitherinside or outside every unit. This would require two penetrations of the exterior to allow supplyair in and exhaust air out. In some cases it may be possible to use an existing bathroom exhaustduct as the ERV exhaust duct if an adequate backdraft damper exists or is installed to prevent recirculation of the air exhausted by the ERV. Note that the EPA radon mitigation standard’srecommends that the intake port installed on the exterior of the unit for the ERV be ten feet awayfrom any exhaust ports. The ERV will only partially condition the incoming air with theoutflowing air. If the outdoor air is 40 degrees and the indoor air is 70 degrees, the entering air18
will typically be around 60 to 65 degrees. Ideally this air should be routed to the return side ofthe air handler to further condition it. Note that the ERV must run continuously unless the ownerturns the unit off during periods of open house conditions.In most high rise condominiums there is very limited additional space in the equipment room orcloset to install the ERV. It will often be necessary to enclose the ERV and new ductwork withfinish materials that allow access to the ERV for maintenance. Figure 16 below is a picture of aFanTech SE704N ERV being pre-tested to determine its effectiveness. This unit moves about 60CFM.Figure 16 Small ERV being tested for effectivenessInstallation of Conditioned AirThe units in this building have floor areas from 650 ft2. to 1450 ft2. with a few larger exceptions.This would require at least 30 to 50 CFM of outdoor air for each unit based on the minimum of0.015 CFM per square foot of concrete exposure. This could be provided with roof top mountedunits that fully condition the air. Using 100% conditioned air would minimize any moistureproblems or occupant discomfort. There are mechanical storage rooms on each corner of the19
buildings that line up above each other that could be used to provide air ducts to each floor. Thelarger challenge will be routing the air from these mechanical/storage rooms to each unit on eachfloor while ensuring that each unit gets adequate amount of outdoor air. The hallways in thebuildings did have a drop ceiling with fire suppression piping and other mechanical utilitiesrouted through the space already. There might be enough space above the drop ceiling to routesome or all of the necessary ducts. Note that all the hallways will also need outdoor air.There are a number of grade level condo units that along with their exposure to concrete alsohave exposure to soil based radon. These units were not tested for radon an
The radon measurements in the units varied from 4.0 pCi/l (150 Bq/m3) to a high of 16.3 pCi/l ( 600 Bq/m3). The average of all the measurements was 7.5 pCi/l ( 278 Bq/m3). Every floor of both buildings had units with radon measurements above the EPA guideline. Radon measurements in five different hallways averaged 6.2 pCi/l (230 Bq/m3).