Transcription
Measurements in Standard Room Scale FiresANDREW LOCK, GWON HYUN KO, MATTHEW BUNDY, ERIK JOHNSSON, and ANTHONYHAMINSFire Research Division, Building and Fire Research LaboratoryNational Institute of Standards and Technology100 Bureau DriveGaithersburg, MD 20899ABSTRACTIn this paper the results of a continuing effort to develop a comprehensive compartment fire database forvalidation of numerical fire modeling is presented. Natural gas fires were conducted inside a full-scale ISO9705 room and are compared with previous results obtained in a 2/5 scale, reduced-scale enclosure. Inthese experiments, fires with heat release rates as large as 2.7 MW were used in the full-scale room. Gasspecies and temperature measurements were made inside the room at several locations in the upper layerand the doorway. Oxygen, CO/CO2, and total hydrocarbon gas analyzers were used in addition to gaschromatography to make gas species measurements. Temperature measurements were made in the upperlayer of the room using aspirated thermocouples. Fires as large as 2.7 MW were observed not to produceunderventilated compartment fire conditions in the full-scale enclosure despite the large heat release rateand temperatures observed in excess of 1200 C. A comparison of the gas species in the upper layer of thereduced-scale and full-scale results showed similarities in terms of the gas species volume fractions whenplotted as a function of mixture fraction, but the temperature results showed that the full-scale enclosurewas reaching higher temperatures than the reduced-scale enclosure.KEYWORDS: iso 9705, compartment fire, enclosure fire, gas sampling, aspirated thermocouples, gaschromatography.INTRODUCTIONThe development of field models for the prediction of fire growth and smoke transport is an area of specialinterest to fire researchers, fire protection engineers, fire investigators, and those developing new fire safetytechnologies. Field models numerically solve the conservation equations of mass, momentum and energythat govern low-speed, thermally-driven flows with an emphasis on smoke and heat transport from fires.All fire field models have strengths and weaknesses. Past versions of FDS have used a mixture fractionbased chemistry model which did not predict soot or intermediate combustion products such as CO. InsteadCO and soot production was prescribed from literature data or bench scale experimental investigations [1].The newest version of FDS (FDS v.5) includes a two part reaction model which allows for CO prediction[2]. Experiments, such as the compartment fires presented here, are designed to provide experimental datawith well defined boundary conditions to facilitate further development of FDS by providing detailed gasspecies measurements including CO, H2, and higher hydrocarbon species in addition to temperature data.A primary goal of the experiments was to provide data on the realistic evolution of a fire as the heat releaserate is increased until the fire reaches the underventilated or vitiated condition. Many previous experimentalinvestigations have been conducted on the behavior of uncontrolled burning of fires in a confined space.The full-scale room as defined by the ISO 9705 [3] standard was used as a basis, because it is a largeenclosure representative of a room in a residential structure and in order to be consistent with otherinvestigations in full-scale room burning [4-6]. Relationships between reduced- and full-scale enclosure firetests are used to develop scaling laws to relate the two. Reduced-scale tests are cheaper and easier toperform while full-scale tests provide a more realistic fire environment. Previous works have proposedscaling relationships in terms of temperature and ventilation with varying degrees of success [5, 7].Pitts used the Global Equivalence Ratio (GER) concept, as developed by Zukoski and Beyler [8, 9], as apredictive method for the production of CO in enclosure fires [5]. This method considers the ratio of thetotal fuel consumption rate to the total air supply rate in the enclosure to calculate the global equivalenceratio and predict the quantity of CO and other species produced. It has been shown that this method workswell to predict CO volume fraction in some fires and not in others. Specifically, lean fires are wellpredicted while most underventilated and extremely hot fires ( 900 C) are not well predicted. Pitts’FIRE SAFETY SCIENCE–PROCEEDINGS OF THE NINTH INTERNATIONAL SYMPOSIUM, pp. 873-882COPYRIGHT 2008 INTERNATIONAL ASSOCIATION FOR FIRE SAFETY SCIENCE / DOI:10.3801/IAFSS.FSS.9-873873
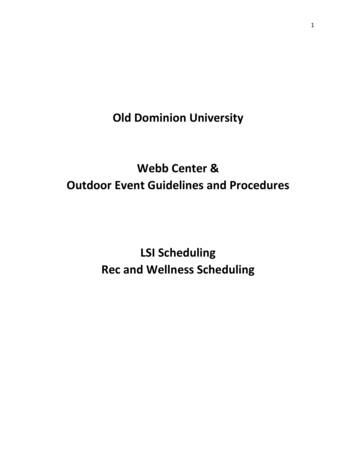
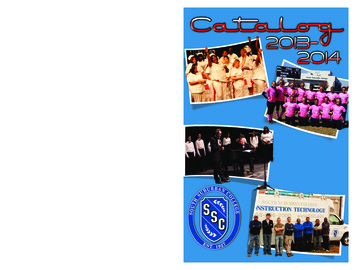
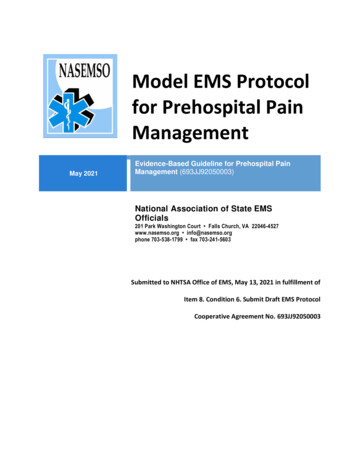
experiments considered only natural gas as a fuel. More recently Andersson [4] considered the GERapplied to four more complicated fuels with similar findings: She also found that the GER generally workswell only for relatively cool fires. The current investigation provides detailed species measurements inreduced-scale and full-scale enclosures to facilitate development and validation of field models.The current predictive capability in FDS is based on the mixture fraction concept [2]. The mixture fractionrelates the total mass of material originating in the fuel stream present at any given location. This conceptwas developed by Bilger to analyze flame data [10]. It was adapted to predict turbulent combustion in fieldmodels by Peters [11] and has been used to analyze the structure of laminar counterflow and coflow flames[12, 13]. In FDS, the mixture fraction has been used to represent fire chemistry in terms of an irreversibleinstantaneous single chemical step, where fuel reacts completely with all available oxygen in a region toform complete combustion products. A new predictive scheme has been implemented in FDS 5 to predictthe production of CO in underventilated fires, using two-step chemistry [2]. The results provided here wereused as part of the model development.Another issue surrounding the prediction of CO and other species is scalability. Scaling relationships allowa reduced or bench scale fire to be used as a basis for predicting the behavior of full-scale fires without theexpense of creating a full-scale experiment. On this basis, many of the GER experiments as well as otherenclosure experiments have been conducted in reduced-scale enclosures with the intent of using the resultsto predict full-scale fires. Pitts, Bryner, and others have used the Ah1/2 scaling factor, where A is area and his height of an enclosure vent [5, 7, 14]. The Ah1/2 quantity is proportional to the area of the vent and the airflux into the enclosure [15-18]. Using this quantity the ventilation air flow into an enclosure is scaled as thesquare of the scaling factor. The 2/5 scale ISO 9705 room used in this investigation will be referred to hereas the reduced-scale enclosure (RSE). The RSE results are used for comparison with the full-scale results(FSE) and for an evaluation of previously developed scaling rules [19].This paper summarizes the current progress on a long-term project experimentally characterizing thebehavior of room fires. Natural gas fires are considered and experimental data on gas species, heat releaserate and temperature are presented. The species composition results are compared to a mixture fractionmodel and with the results obtained previously in reduced-scale compartment fires. This experimental datais an improvement of previous data in the sense that it features well defined and steady wall boundaryconditions and the gas species measurements are more detailed than previous measurements. It alsoprovides further insight into the differences in dynamics between a reduced-scale and full-scale enclosurefire.EXPERIMENTAL CONFIGURATIONThe ISO 9705 standard stipulates a room with internal dimensions of 2.4 m x 3.6 m x 2.4 m with a door forventilation that has dimensions of 2 m x 0.8 m [3]. All dimensions in the room are allowed a tolerance of 4 cm. The dimensions of the reduced-scale enclosure were 1.42 m x 0.95 m x 0.98 m with a doorway of0.81 m x 0.48 m, or 2/5 the scale of the full-scale room. The full-scale enclosure used in these experimentsis shown in Fig. 1. The full-scale room was lined with a 2.5 cm thick noncombustible alumina-silicazirconia ceramic blanket. Investigations in the reduced-scale enclosure have shown that ceramic blanketwas a stabile and reliable lining material for these experiments [19]. The structural stability and chemicallynon-reactive nature of the ceramic blanket also make it an easier boundary condition to prescribe fornumerical modeling.A water-cooled pool burner was placed in the center of the full-scale enclosure on the floor. The poolburner was a 1 m square pan with a total external height of 15 cm. The internal surface of the burner wasinclined. The reduced-scale enclosure (RSE) used a 13 cm square pan with a total height of 15 cm abovethe floor. House water flowed through the full-scale burner at a variable rate up to 57 L/min to control theburner temperature. The RSE burner was not water cooled. The burners were filled with gravel and thehouse natural gas flow was metered to obtain the desired heat release rate. GC gas analysis of the housenatural gas was conducted, as it differed slightly in each of the experiments.Water-cooled gas sampling probes were inserted into the structure at points A and B, as illustrated in Fig. 1.The locations of these points, relative to the origin indicated in Fig. 1, are listed in Table 1. These points arescaled geometrically between the measurement points in the reduced-scale and full-scale enclosures [19].Temperature and soot measurement probes were also included at these locations in an attempt to capture a874
Fig. 1. Schematic drawing of the enclosure with internal sampling locations indicated. The samplinglocations for the reduced- and full-scale enclosures are list in Table 1.Table 1. Location of sampling points in the upper layer of the reduced-scale enclosure (RSE) and the fullscale enclosure (FSE).SamplePointX (cm)Y (cm)Z (cm)MeasurementsRSEFSERSEFSERSEFSEA, Front29189102588208B, Rear2918911328688208Gas Species,TemperatureGas Species,Temperature,more complete picture of the fire environment. Temperature measurements were also made at various otherlocations inside the room [19].Gas samples were pulled through two cooled (T 25 C 5 C) sample lines to freeze the chemistry. Thesample then flowed to a heated line to prevent condensation and a Nafion polymer membrane, whichselectively removed water from the gas stream [20]. The dried gas streams then flowed to a Servomex 4100paramagnetic oxygen analyzer, a Siemens Ultramat 6E non-dispersive infrared (NDIR) CO and CO2analyzer, a Baseline-Mocon 8800H total hydrocarbon analyzer using a flame ionization detector (FID), andfinally to a Agilent 3000A micro gas chromatograph (micro-GC) for detailed gas analysis. The sample flowpath was nearly identical to that reported for the RSE [19]. Each gas analyzer was calibrated before eachtest, the uncertainty introduced by the span and calibration gases was 1% [19]. The uncertainty in gasanalyzer measurement through repeat experiments using a standard gas mixture [21]. A gas sampling andstorage system was designed and constructed, allowing capture and storage of sixteen 10 ml gas samplesextracted from the front position in the room. The samples were stored for analysis after the experiment.The micro-GC was connected directly to the other gas sample line, sampling from the rear location, andcontinually sampled. Analysis of the gas flow was done every 2.5 minutes throughout each test. Theuncertainty in GC measurement was less than 1% based on calibration and the repeatability tests. All of theexhaust gasses from the room fires were captured by the 6 m hood at the NIST Large Fire Laboratory875
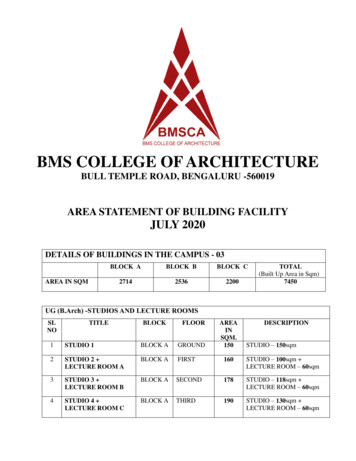
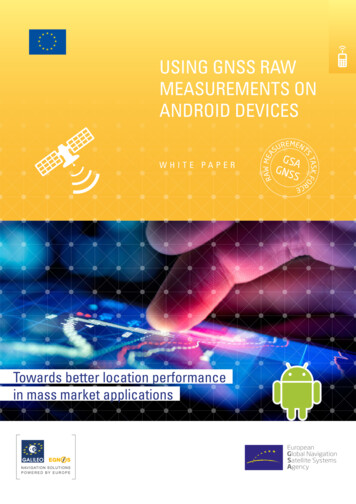
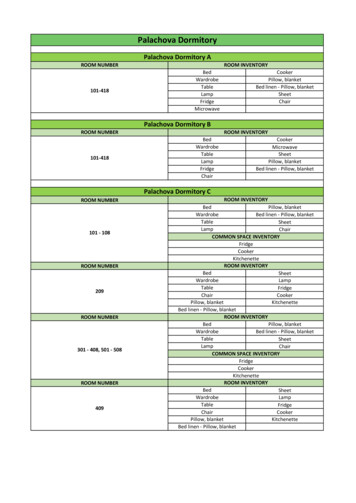
(LFL), where oxygen-consumption calorimetry was conducted to determine the fire heat release rate [22,23]. The LFL 6 m hood calorimetry has been shown to have a combined expanded uncertainty of 14 %.The expanded uncertainty refers to a factor of two times the standard uncertainty.Aspirated thermocouples were used for internal room temperature measurements. These thermocoupleswork by pulling combustion gasses directly from a sample location at a high velocity over a thermocouplebead enclosed by two radiation shields [24]. The aspirated thermocouples sacrifice temporal and spatialresolution, but lead to significantly reduced radiative exchange, as compared to bare bead thermocouples,and generally improve measurement accuracy. The expanded uncertainty in the temperature measurementstaken in the upper layer was estimated as 7 % [24].RESULTS AND DISCUSSIONExperiments were conducted for a variety of fire sizes with natural gas as the fuel in both the reduced andfull-scale enclosures. Figure 2 shows a photographic image of a natural gas fire at 2.7 MW in the full-scaleenclosure with flames emanating from the front of the enclosure. Despite this behavior, indicative ofunderventilated burning, a completely vitiated environment was not measured in the upper layer of theroom, as will be discussed later. Figure 3 presents experimental data collected from several fires, combinedtogether and organized by the size of the enclosure, i.e. reduced-scale and full-scale. Each test started at alow heat release rate (HRR), which was gradually increased in steps to a maximum heat release rate of2.7 MW for the full-scale and 400 kW for the reduced-scale fires. Each step in the HRR was allowed tostabilize, so that the measurements were acquired for near-steady fire sizes. Nominal fire sizes were0.9 MW, 1.25 MW, 2.4 MW, and 2.7 MW in the full-scale enclosure experiments and 0.15 MW, 0.2 MW,0.25 MW, and 0.4 MW in the reduced-scale enclosure experiments.Quantitative differences between the gas analyzer results and the GC gas sample analysis were generallyless than 1% in both reduced and full-scaleFig. 2. Image of a 2.7 MW natural gas fire in the full-scale enclosure.876
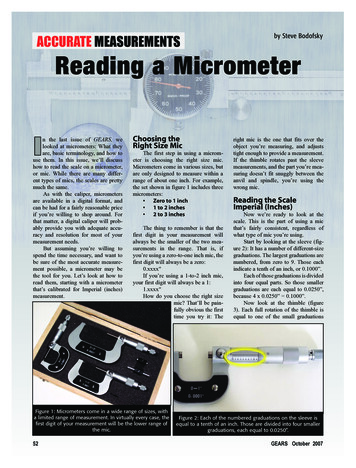
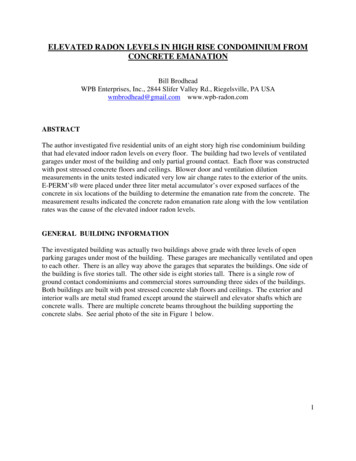
Figure 3 shows the measured volume fraction of gas species at Position A (left) and Position B (right) inthe upper layer of natural gas fires burning in the reduced-scale enclosure, RSE, (top) and the full-scaleenclosure, FSE (bottom) as a function of the heat release rate. Each data point in Fig. 3 was averaged overthe steady burning period in the experiment to statistically determine standard deviation in themeasurements. These plots indicate several trends. The variation in the gas species concentrationsqualitatively follows the expected behavior relative to the heat release rate. That is, as the heat release rateincreased, oxygen in the room was consumed and more product species such as CO2 and intermediatespecies, such as CO were present. Steady state was reached within 2 min after a step change in the fueldelivery rate. Soot volume fraction was measured and found to be relatively insignificant for the natural gasfires (less than 0.1 %, and often unmeasureable).Intermediate species were not observed in appreciable quantities until the HRR reached 2.7 MW in the fullscale fire and 250 kW in the reduced-scale enclosure. According to the simple Ah1/2 scaling relationship, ifintermediate species were observed at 250 kW in the reduced-scale enclosure, then one could expect themFront, Position ARSEFSERear, Position BRSEFSEFig. 3. Measured gas volume fractions at Position A (left) and Position B (right) in the upper layer ofnatural gas fires burning in the reduced-scale enclosure, RSE, (top) and the full-scale enclosure, FSE(bottom) as a function of the heat release rate.877
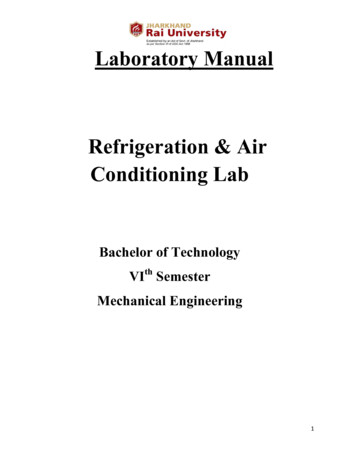
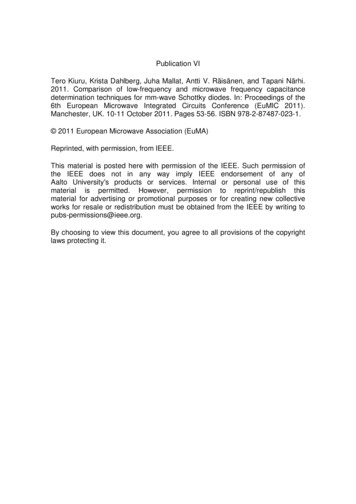
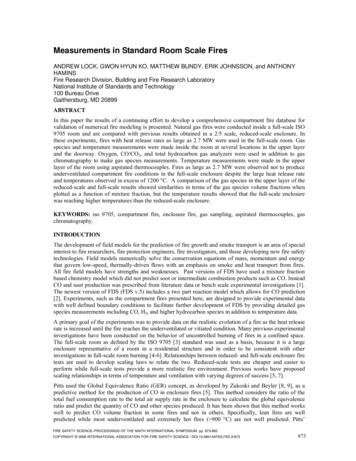
to be present 1.6 MW in the full-scale enclosure. This indicates that in a global sense that the full-scaleenclosure was burning slightly lean and that underventilated conditions (no oxygen present), and therebyenclosure chemistry, did not occur as predicted by the scaling relationship. Different dynamics also seem tocome into play for these two enclosures. In the reduced-scale enclosure, both front and rear samplinglocations had approximately the same levels of CO and unburnt hydrocarbons. This was not true for thefull-scale fires, indicating that the upper layer of the room was more homogeneous in the reduced-scalethan in the full-scale enclosure. In the full-scale enclosure, at the peak heat release rate, less oxygen andmore CO and unburnt hydrocarbons (UHC) were observed at point A, near the front of the enclosure, whileslightly more oxygen and less CO or UHC were observed at point B, in the rear of the enclosure. Thisindicates that as air enters the room, it is transported quickly to the rear of the compartment and was onlyvitiated as it approached the front of the enclosure, just prior to exiting.Mixture Fraction AnalysisThe mixture fraction is defined as the local mass fraction of species which originated in the fuel stream:Z YF YcoMWFMWFMWF Yco2 YSootx MWcox MWco2x MWSootWhere Z is the local mixture fraction, YF, YCO, YCO2, and YSoot represent the mass fractions of Fuel, CO,CO2, and Soot respectively. x is the number of carbon atoms in the fuel, MWF, MWCO, MWCO2, andMWSoot, are the molecular weights of Fuel, CO, CO2, and Soot. Local mass fractions of key species areplotted versus mixture fraction and presented for natural gas fires in Fig. 4. The stoichiometric mixturefraction, Zst, is the mixture fraction at which the stoichiometric ratio of fuel to air is present. For natural gasthe stoichiometric mixture fraction was approximately Zst 0.0554 0.0002 [19]. The uncertainty in thisnumber is related to the uncertainty in the GC gas analysis of the house natural gas, which differed slightlyin each of these experiments. At larger mixture fractions, theory predicts that all oxygen consumed andincomplete combustion products are formed. At smaller mixture fractions all of the fuel is consumedproducing only complete combustion products. This theory works well at predicting local chemicalcompositions for lean fires, however it has been well documented that for Z Zst, the measured compositiondeviates significantly from the theoretically predicted composition [19].The local species mass fractions are plotted as a function of the mixture fraction in Fig. 4. For both thereduced and full-scale fires, the previous comments about mixture fraction hold true in that the measuredlocal chemical composition follows the theoretical state relationship trends well for Z Zst and thendeviates after Z Zst. In reduced-scale, an underventilated condition was achieved readily and the mixturefraction increased to a level in which a significant amount of CO was present and oxygen was completelyconsumed. For these rich conditions, as expected the CO mass fraction did not follow the staterelationships, as was also true for the mass fractions H2O and CO2, which were both underpredicted. Forthe full-scale enclosure, even though the volume fraction of oxygen did not drop to zero, the local chemicalsystem does transition to a slightly rich-burning regime, Z Zst, where more partial combustion productsare produced. Specifically, there was an increase in total hydrocarbons, mostly methane, and an increase inCO, which was not predicted by the state relationships, which assumes complete combustion. Strongagreement was still observed between the experimentally measured gas species concentrations and thetheoretically predicted composition of the gas for Z Zst. The disparity in the scaling relationship is alsoevident from Fig. 4. Even though the heat release rate in the full-scale enclosure reached a level of2.7 MW, well in excess of the predicted underventilated condition based on the reduced-scale enclosure,the chemistry in the upper layer was only beginning to produce substantial products of incompletecombustion.878
Reduced ScaleTHCTHCCO2CO2O2O2H2 OH2 OCOmass fraction0.20.1000.10.20.30.4mixture fractionFull ScaleTHCTHCCO2CO2O2O2H2 OH2 OCOmass fraction0.20.1000.10.20.30.4mixture fractionFig. 4. Measured mass fractions (symbols) and theoretical mass fractions (lines) of important reactant,product, and intermediate species plotted as a function of mixture fraction in the upper layer of a reducedscale enclosure (left) and full-scale enclosure (right) burning natural gas.The temperatures inside the reduced-scale and full-scale enclosures are presented in Fig. 5 as a function oflocal mixture fraction. In the reduced-scale enclosure there was a significant difference in the measured gastemperatures, approximately 300 C, in spite of the fact that the local mixture fractions are largely similar.In the full-scale enclosure, the opposite was observed in that very similar temperatures are observed despitethe fact that a larger mixture fraction was observed in the front of the enclosure than in the rear.Specifically, for the full-scale at the rear of the enclosure, the high level of oxygen (as indicated by Z Zstand observed in Fig. 3) was unexpected since the sampling location was remote from the doorway vent.Despite the locally similar temperatures between the front and rear of the enclosure, the ventilation profilewas such that as fresh air enters the front of the enclosure it flows along the floor and rises in the rear of theenclosure. This indicates that there are different flow dynamics occurring in the full-scale enclosure thanwere observed in the reduced-scale enclosure. Different enclosure dynamics are credited with the reasonthat the scaling relationships are under-predicting the heat release rate necessary to achieve theunderventilated condition.879
Reduced Scale1200Full Scale1200Front Temperatures1000800800Rear TemperaturesFront TemperaturesooT ( C)T ( C)1000600600Rear 350.4000.050.10.150.20.250.30.350.4ZFig. 5. Aspirated thermocouple temperatures in the upper layer of natural gas fires burning in the reducedscale enclosure (left) and the full-scale enclosure (right) as a function of the local mixture fraction, Z.The other salient feature of Fig. 5 is that the temperatures observed in the full-scale enclosure are higherthan those observed in the reduced-scale enclosure. This is significant because it may contribute to theexplanation of the failure of the simple scaling relationship. In the reduced-scale enclosure, underventilatedfires were easily achieved for natural gas with a HRR of 250 kW [19]. The full-scale ISO room was justbecoming underventilated at 2.7 MW, cf. Fig. 3. According to the ventilation scaling mentioned earlier [5,7] the full-scale ISO room should be expected to be underventilated at 1.6 MW. The GER concept onwhich the ventilation scaling was based has been shown to be valid for certain ventilation conditions andgenerally for temperatures less than 900 ºC [4, 5]. As seen in Fig. 5, the temperature in the full-scale roomwas often above this threshold, with temperatures observed in excess of 1200 C. In a previous report byPitts et al. [25], results for reduced and full-scale enclosures showed better agreement with this scaling rule,but for a different burner configuration, again suggesting different enclosure dynamics play a significantrole in how incomplete combustion products are being produced.SUMMARYFull-scale room fire tests were conducted in an ISO 9705 standard room and a 2/5 scaled room. Gas speciesand temperatures were compared with the reduced-scale enclosure fire tests. Heat release rates up to2.7 MW were produced in the full-scale enclosure. Instrumentation included oxygen-loss calorimetry forheat release rate measurements, aspirated thermocouples for temperature measurements, and several gasanalyzers for gas species measurements. The main findings are:8801.In the full-scale enclosure, oxygen levels were only observed to drop to near zero levelsoccasionally in these experiments. None of the heat release rates tested produced a steadyunderventilated fire. This was also seen in the very low levels of intermediate products andunburnt fuel. This is in contrast to the reduced-scale fires which were more easily underventilated.This indicates that simple scaling laws may be inappropriate. Scaling of the burner area may alsoplay a role.2.Mixture fraction calculations based on fuel, CO, and CO2 mass fractions measured in the fireshowed that for lean fires (Z Zst) the mixture fraction does a reasonable job of predicting thecomposition. For Z Zst the experimental measurements departed from the theoretical predictionssignificantly. This is in line with previous observations. The behavior of the reduced-scaleenclosure mimicked the full-scale.
3.The full-scale enclosure was only observed to approach an underventilated condition at 2.4 MW.Reduced-scale enclosure fires became underventilated at 250 kW, this suggested that the full-scaleenclosure would become underventilated at 1.6 MW. This difference in required heat release rateis not consistent with the ventilation scaled prediction for the 2/5 scale reduced-scale enclosure.4.The deviation in measured results from that predicted by the scaling relationship is attributed totwo factors. First, even though the room geometry was scaled geometrically, the burner geometrywas not. This produced a different dynamic flow behavior in the room which may have affectedthe scaling. Second, the temperatures in the reduced-scale enclosure were near 1000 C whiletemperatures in the full-scale enclosure were in excess of 1200 C. Previous authors have shownthat the scaling relationship fails at predicting ventilation conditions when the enclosuretemperature is in excess of 900 C.ACKNOWLEDGEMENTSA number of individuals were instrumental in the completion of this work. The fabrication work andexecution of these tests would not be possible without the expert assistance of the LFL staff: AlexMaranghides, Laurean DeLauter, Edward Hnetovsky, Greg Masenheimer, Jay McElroy, and TonyChakalis.DISCLAIMERCertain companies and commercial properties are identified in this paper in order to specify adequately thesource of information or of equipment used. Such identification does not imply endorsement orrecommendation by the National Institute of Standards and Technology, nor does it imply that this sourceor equipment is the best available for the purpose.REFERENCES[1]National Fire Protection, A.; Society of Fire Protection, E., SFPE handbook of fire protectionengineering. National Fire Protection Association, Quincy, Mass, 2002.[2]McGrattan, K. B.; Baum, H.; Rehm, R.; Hostikka, S.; Floyd, J. "Fire Dynamics Simulator(Version 5): Technical Reference Guide;" National Institute of Standards and Technology, NISTSP 1018-5: 2007.[3]ISO9705 "Fire Tests - Full-Scale Room Test for Surface Products First Edition;" InternationalOgranization for Standardization: Geneva, Switzerland, 1993.[4]Andersson, B.; Markert, F.; Holmstedt, G., (2005) Combustion products generated by heteroorganic fuels on four different fire test scales, Fire Safety Journal 40, (5): 3.002[5]Pitts, W. M., (1995) The Global Equivalence Ratio Concept and the Formation Mechanisms ofCarbon-Monoxide in Enclosure Fires, Progress in Energy and Combustion Science 21, (3): 197237.[6]Pitts, W. M.; Johnsson, E. L.; Bryner, N. P., (1994) Carbon Monoxide Formation in Fires ByHigh-Temperature Anaerobic Wood Pyrolysis, Twenty-Fifth Symposium (International) onCombustion: 1445-1462.[7]Bryner, N. P.; Johnson, E. L.; Pitts, W. M. "Carbon Monoxide Production in Compartment Fires Reduced-Scale Enclosure Test Facility;" National Institute of Standards and Technology, NIST IR5568: 1994.[8]Beyler, C. L., (1986) Major Species Production by Diffusion Flames in A 2-Layer CompartmentFire Environment, Fire Safety Journal 10, (1): 47-56. http://dx.doi.org/10.1016/03797112(86)90031-7881
[9]Zukoski, E. E.; Morehart, J. H.; Kubota, T.; Toner, S. J., (1991) Species Production and HeatRelease Rates in 2-Layered Natural-Gas Fires, Combustion and Flame 83, (3-4): 79-Q[10]Bilger, R. W., (1977) Reaction-Rates in Diffusion Flames, Combustion and Flame 30, (3): 277284. Peters, N., (1984) Laminar Diffusion Flamelet Models in Non-Premixed Turbulent Combustion,Progress in Energy and Combustion Science 10, (3): 319-339. amins, A.; Seshadri, K., (1987) The Structure of Diffusion Flames Burning Pure, Binary, andTernary Solutions of Methanol, Hepatane, and Toluene, Combustion and Flame 68, (3): anu, Y. R.; Faeth, G. M., (1990) Generalized State Relationships for Scalar Properties inNonpremixed Hydrocarbon Air Flames, Combustion and Flame 82, (2): 99-D[14]Hull, T. R.; Carman, J. M.; Purser, D. A., (2000) Prediction of CO evolution from small-scalepolymer fires, Polymer International 49, (10): 1259-1265. 1259::AID-PI573%3E3.0.CO;2-D[15]Gross, D.; Roberston, A. F. "Experimental fires in enclosures", Tenth International Symposium onCombustion, 1965; 1965; pp 931-942.[16]Heskestad, G. "Modeling of enclosure fires", Fourteenth International Combustion Symposium,1972; 1972; pp 1021-1030.[17]Kawagoe, K. "Fire behavior in rooms;" Building Research Institute of Japan, 27: September,1958.[18]Quintiere, J. G., (1989) Scaling Applications in Fire Research, Fire Safety Journal 15, (1): 3[19]Bundy, M.; Hamins, A.; Johnsson, E. L.; Kim, S. C.; Ko, G. H.; Lenhert, D. B. "Measurements ofHeat and Combustion Products in Reduced-Scale Ventilation-Limited Compartment Fires;"National Institute of Standrads and Technology, TN1483: 2007.[20]Mauritz, K. A.; Moore, R. B., (2004) State of understanding of Nafion, Chemical Reviews 104,(10): 4535-4585. http://dx.doi.org/10.1021/cr0207123[21]Taylor, B. N.; Kuyatt, C. E. "Guidelines for Evaluating and Expressing the Uncertainty
Gas species and temperature measurements were made inside the room at several locations in the upper layer and the doorway. Oxygen, CO/CO2, and total hydrocarbon gas analyzers were used in addition to gas chromatography to make gas species measurements. Temperature measurements were made in the upper layer of the room using aspirated thermocouples.