Transcription
MAP College Readiness Benchmarks:A Research BriefJune 29, 2015Yeow Meng Thum, Ph.D.Tyler Matta, Ph.D.
SUGGESTED CITATION:Thum Y. M., & Matta, T. (2015). MAP College Readiness Benchmarks: A Research Brief. NWEAResearch Report. Portland, OR: NWEAAll rights reserved. No part of this document may be reproduced or utilized in any form or by anymeans, electronic or mechanical, including photocopying, recording, or by any information storageand retrieval system, without written permission from NWEA.In keeping with the NWEA rebrand, the front cover and the first page have been updated to reflectthe NWEA logo. The MAP product name has been updated to MAP Growth, where appropriate. Noedits were made to contents of the June 29, 2015 Revised release of the study.MAP, Measures of Academic Progress, and MAP Growth are registered trademarks and NorthwestEvaluation Association and NWEA are trademarks of Northwest Evaluation Association in the U.S. andother countries. EXPLORE and PLAN are registered trademarks of ACT, Inc. SAT is a registeredtrademark of the College Board and the National Merit Scholarship Corporation.Disclaimer: This report is the product of research conducted by the Northwest EvaluationAssociation. Neither the report nor its findings are sponsored or endorsed by ACT, Inc. or The CollegeBoard.
MAP College Readiness Benchmarks:A Research Brief Yeow Meng ThumTyler MattaNorthwest Evaluation AssociationPortland, OregonJune 29, 2015 (Revised)Preparing students for success in college and the workplace is at the center of educational policydebates across the country. According to a widely-accepted definition (Conley, 2007, p. 5), astudent who is college ready is someone who can “enroll and succeed – without remediation – in acredit-bearing general education course at a postsecondary institution that offers a baccalaureatedegree or transfer to a baccalaureate program.” With college and career readiness as the new focusof K-12 education1 , increasing attention has been given to traditional college entrance examination.Prospective college applicants typically take the ACT R , SAT R , or both, when they are high schoolsophomores, juniors, and seniors. A college admissions office would evaluate an applicant’s ACT(ACT, 1997) or SAT (The College Board) scores as part of the decision to admit students. Morepertinent to this study is that both ACT and The College Board have published benchmarks fortheir respective tests to address whether students might be college ready (Allen & Sconing, 2005;Kobrin & Michel, 2006). However, college entrance examination results obtained during the endof high school lack utility for educators because it may be too late to help weak-performing highschool students make-up the deficit in their preparation for college. To help younger students gaugetheir preparation prior to taking the ACT, 8th and 9th graders may take EXPLORE R and 10thgraders may take PLAN R from ACT’s Educational Planning and Assessment Series (or EPAS).Scores from EXPLORE and PLAN not only share the scale of the ACT, they may be used topredict performance on the ACT itself; therefore, indirectly serving as early indicators for collegereadiness2 . The Preliminary SAT, or PSAT, from The College Board, plays a similar role for We thank Don Draper for leading an immense data collection effort and Branin Bowe for data preparation.Comments from many other colleagues, and specific feedback from Meg Guerreiro, Michael Dahlin, Jim Soland, JohnCronin, Carl Hauser, and Gage Kinsbury, significantly improved the report. Opinions expressed in this paper arehowever the sole responsibility of the authors, as are all remaining errors. Please direct all correspondence to Y. M.Thum, at yeow.meng@nwea.org.1See, for example, the President’s clarion call identifying college and career preparedness as the goal of US publiceducation (US Department of Education, 2010).2Although the EPAS series has recently been discontinued, its role as a early indicator of college preparedness
MAPCollege Readiness Benchmarksstudents taking the SAT.For many educators, receiving indications of whether their students are on a track to be college readyearlier in their schooling would be very helpful. Such indicators may inspire students who otherwisemay not have thought post-secondary study was a possibility to consider college. Likewise, earlyindicators of college readiness can enable teachers to identify students who are off-track and putin place the appropriate interventions. Gavin (2011), writing for the Evanston Roundtable in May2011, described just such an effort in Illinois. The results are back-mapped ACT college readinessbenchmarks for grades 3-8 reading and mathematics for the Illinois Standard Achievement TestTMTM(ISAT). Northwest Evaluation Association(NWEA ) partners similarly recognize the value ofcollege readiness information for Measures of Academic Progress R (MAP R ).OverviewThis brief reports a set of college readiness benchmarks for use with MAP reading and mathematicstests from grades 5 through 93 . The report also outlines how the study meets some of the dataand statistical challenges to arrive at defensible results for MAP users. A fairly diverse group of14 small to medium-sized school districts from across the country participated in the study. Inall, over 621,058 test events from 410 schools that serve a total of 83,318 students are analyzed.Evidence suggests that districts vary in a number of student and school factors (as measured byNWEA’s School Challenge Index4 , or SCI).Critical to the benchmarking effort, participating districts also vary widely in the proportion ofhigh school students who take ACT (from about 20% to 70%). It seems reasonable to believe thatwhether or not a student takes the ACT is not a random outcome but is one that reflects somedegree of self-selection. Introducing an approach to mitigate potential self-selection biases in thebenchmark estimates is a central contribution of the study.Generally, the study finds that middle school5 students are likely to be college ready if they perremains important to this discussion. These remarks regarding ACT’s EPAS applies to ACT Aspire, which replacesEPAS and extends college readiness assessments into earlier grades.3College readiness is the focus of this work. It is widely-recognized that College and Career Readiness is a muchgreater challenge, in definition of “success” and its measurement, and is beyond the scope of the research reportedhere.4The SCI is a school-level indicator of how public schools compare “in terms of the challenges and opportunitiesthey operate under as reflected by an array of factors they do not control” (Northwest Evaluation Association, 2015).This indicator is keyed on the proportion of students who are eligible for a free-and-reduced-priced lunch programin a school. Thus, it generally taps the collective economic circumstance of its students but it also offers a broaderview of the “economic strain” they experience, as seen through a relevant set of socio-demographic, organizational,and educational policy programming factors. The SCI ranges from 1 to 99, with higher values for schools servinglesser-privileged student bodies. It has an average of 50 among public schools in the US.5The study addresses grades 5 through 9, which represent more than the standard designation for the middleschool grade span. “Middle school” is mostly used in this study for ease of communication.Thum & MattaPage 2 of 25
MAPCollege Readiness Benchmarksformed between the 70th to 84th percentiles in mathematics or between the 66th to 75th percentilesin reading6 . Results also suggest, according to the 2015 achievement norms for MAP, that college readiness benchmarks are more stringent the closer it is to graduation from high school. Itis important to stress that the estimated MAP benchmarks are anchored on the ACT score of24, for both reading and mathematics, a benchmark recommended for use with NWEA partners.This benchmark, which takes into consideration the college admissions profile of enrolled studentsin major state universities across the country, is more stringent than the widely-circulated ACTcollege readiness benchmark of 227 . For the less stringent ACT 22 benchmark, middle schoolstudents are likely to be college ready if they performed between the 61st to 76th percentiles inmathematics or between the 59th to 69th percentiles in reading on MAP.The Digest of Educational Statistics estimates of 18.9 and 24.9 are the 25th and 75th percentileson ACT English for about 1 million freshmen enrolled in public 4-year institutions in 2013 (Snyder& Dillow, 2013, Table 305.40). The interquartile range for ACT Math is given by 19.2 and 24.9.Although an ACT score of 22 is roughly at the middle of this range for both subjects, it is very likelythat an ACT score of 22 is not stringent enough as a goal for admissions to modestly selective stateuniversities such as the University of California, Florida, Oregon, South Carolina, or Wisconsin.For many of these universities, the lower quartile of students who were admitted is just above theACT score of 24. That is, about 75% of entering class for these institutions have an ACT scoreof 24 or greater. Just being on-track in preparation for college (i.e., the student is predicted toobtain a score of 22 or greater on his ACT) will be a vacuous achievement without also having ameasurable likelihood of being admitted to the class of institutions of your choice. To recognizethe importance of college admissions standards, targeting an ACT of 24 would seem like a prudentaspirational goal for staying on-track in college preparation. For comparison purposes, MAP collegereadiness benchmarks corresponding to an ACT score of 22 are also provided.Using the more stringent MAP college readiness benchmarks (ACT 24), about 63 to 73 studentsout of 100 who meet or exceed the benchmarks are correctly classified as college ready and only10 to 18 students of 100 of those students who are not on-track are misclassified. Similarly, MAPcollege readiness benchmarks, which assume the ACT college readiness benchmark is 22, about 67to 75 students out of 100 who meet or exceed the benchmarks are correctly classified as collegeready and only 13 to 20 students of 100 of those students who are not on-track are misclassified.These benchmarks are selected with the view that higher misclassification rates of non-collegeready students are more costly than the misclassification of college ready student to all stakeholders.Mistaking a student to be on-track when he is not would mean missing the opportunity to interveneand returning him to the path of college preparedness.6All achievement percentiles are from the NWEA 2015 MAP Norms (Northwest Evaluation Association, 2015).ACT estimates that students meeting or exceeding 22 points on the ACT have a 50% chance of obtaining a gradeof “B” or higher or about a 75% chance of obtaining a “C” or higher in corresponding credit-bearing first-year collegecourses.7Thum & MattaPage 3 of 25
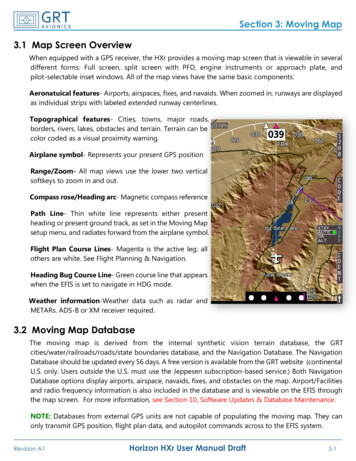
MAPCollege Readiness BenchmarksTable 1: Illustrative Cohort Structure for a District2003Grade Fa Sp121 1112 2103 394 485 576 667 758 849 92004Fa Sp2 23 34 45 56 67 78 89 910 102005Fa Sp3 34 45 56 67 78 89 910 1011 112006Fa Sp4 45 56 67 78 89 910 1011 1112 122007Fa Sp5 56 67 78 89 910 1011 1112 1213 132008Fa Sp6 67 78 89 910 1011 1112 1213 1314 142009Fa Sp7 78 89 910 1011 1112 1213 1314 1415 15Note: Used with permission from Thum & Matta (2015).These robust classification accuracy rates are achieved through the use of all relevant longitudinalstudent MAP scores within each district and adjustments are made for self-selection in college admissions test-taking practices. Benchmarks that are generally applicable to middle-school studentsare the result. The study also provides a rationale for aggregating the benchmarks from individualdistricts for use with the wider MAP partner-base. Finally, ways with which the benchmarks maybe used (a) to give the comparative standing of the middle school student in terms of his collegereadiness in relation to his peers and (b) to ascertain whether a student has met or exceeded abenchmark are suggested.Data and DesignLongitudinal, as opposed to cross-sectional, data hold the most information for describing andpredicting individual and collective growth in learning. This study employed MAP and ACTassessments for mathematics and reading from multiple age-cohorts of students from 14 schooldistricts across the US. From each district, the study uses data from age-cohorts of 4th through12th grade students to provide the requisite MAP results (grades 4 through 9 only) and, if available,their ACT results in high schools. Fall and spring MAP scores are available for each grade. Forthe illustrative district data-layout in Table 1, Cohorts 6 through 9 will be selected for analysisalthough only Cohorts 6 and 7 contribute to benchmark estimation because these student haveACT scores. For the students in Cohorts 8 and 9, only their MAP scores from grade 4 through 9contribute to the estimation of the MAP score trends from the 4th through the 9th grade.Table 2 provides the counts of students, schools, MAP Reading test events, and cohorts per district.Districts ranged in cohort size from large (District 10, N 6, 545) to small (District 13, N 113).A total of 83,318 students from 410 schools, in 52 cohorts were used to estimate the MAP readingThum & MattaPage 4 of 25
MAPCollege Readiness BenchmarksTable 2: Descriptive statistics for the 14 districts in the study: MAP ReadingDistrictCountTake ACTSCISchools Students Tests Cohorts%Mean 045513129131471378Summary410833186210585250 46†18†Note: total†pooled estimateand mathematics college readiness benchmarks. Additionally, the proportion of students takingthe ACT varied across districts with 76% of students taking the ACT in District 13 and 19% ofstudents taking the ACT in District 11. On average, across all 14 districts, more than half of thegraduating class completed the ACT during high school. The counts for MAP Mathematics arehighly comparable.Are districts comparable and how well do they collectively “represent” typical middle school students in the US? The data suggest, not surprisingly, that students performed quite differently onMAP and ACT among the districts. It is clear that some districts have more higher performingstudents than others. In addition, districts are compared in terms of the average SCI. As Table 2shows, participating districts have average SCIs from 35 to 60, values that cluster around the national average of 50. It seems reasonable to infer that the participating district schools collectivelyserve a spectrum of public school students clustered at the national SCI average. Consequently,these results are representative of districts in this more limited sense of the term, rather than beingstatistically representative of public schools across the US.Missing Data and SelectionIn this study, each district provides all the ACT data from district archives. NWEA receivespermission to extract all available MAP scores for use in the study. As a result, ACT data are inThum & MattaPage 5 of 25
MAPCollege Readiness BenchmarksTable 3: Sample Size and Correlation between ACT and MAP for a Single Cohort from District 116Fa7SpFa8SpFa9SpFaSpACTMathematicsN 594 611 639 648 678 687 171 688Corr. 0.71 0.73 0.72 0.76 0.75 0.78 0.67 0.77801ReadingN 593 611 1117 1127 1180 1201 206 1159 1375Corr. 0.66 0.66 0.67 0.65 0.70 0.68 0.64 0.65truth “complete” except for those students who have not taken the college test during high school.Recently, Thum and Matta (2015) found that only about a third of recent graduates in a mediumsized district take either the ACT or the SAT. This pattern is echoed in Table 2. While on average,those who take the ACT also have stronger MAP score trends than those who have not taken theACT, there is a good proportion of students who do not take the ACT but show MAP score trendsthat are comparable to students who have taken the college admissions test. Neglecting the MAPscores of these students (that is, ignoring self-selection in test-taking) may lead to biases in theestimated benchmarks. MAP scores are also missing for some students, although in much smallerproportion and appear to be haphazard in their occurrence. Missing MAP data, therefore, are notexpected to bias the results and may be ignored.Correlations between MAP and ACT scores provide the basis for relating one scale to another.Table 3 shows the sample correlations of seniors from one cohort in District 11 who have taken theACT and MAP scores they received when they attended middle school. The sample correlationsare moderately high (from 0.65 to 0.78) but they do not show a trend towards higher values inthe higher grades as one expects. Not only do the counts reflect self-selection from the start, thereis a pattern of “reverse attrition” in the number of scores available that makes information frombivariate analyses weak. These patterns in the observed data are the very reason why selectionneeds to be factored into any reasonable approach. It also suggests that growth modeling oflongitudinal data is superior to bivariate or cross-sectional analyses. With a longitudinal design,shared information across the grades and terms is maximized and estimates of the links betweenearly MAP scores and ACT are improved.Linking MethodMany methods are available for relating scores from any two scales for a population of examinees.A delineation of the factors leading to each plausible approach and the significance of its results arebeyond the scope of this brief. The interested reader should consult, for example, Kolen (2004).According to the framework shared by Mislevy (1992) and Linn (1993), this application is bestThum & MattaPage 6 of 25
MAPCollege Readiness Benchmarksconsidered a projection to the extent that the tests do not tap the same construct and regressionis key for constructing the benchmarks. However, several considerations regarding the data areunique to this application.First, the study seeks to relate scores from two scales (MAP, ACT) obtained over an extendedperiod (grades 5-12), as is also the case with the Illinois ISAT described above. Most applicationsinvolve two scales measuring two similar constructs and the scores are obtained at about the sametime-frame for a known examinee population. A frequently cited example is the effort to estimatethe concordance of scores between the ACT and SAT, but concordance is unsuitable for use inwhat turns out to be essentially a projection or prediction problem. In relating MAP scores to theACT however, instead of studying the bivariate relationship using conventional regressions between,for example, the 5th grade MAP mathematics scores with the ACT scores for the population ofall examinees, the approach in this study considers the entire score trajectory of every individualmember of the student population in order to maximize the shared information across time points.Second, the study recognizes that not all members of a graduating class take a college entranceexamination. Scale relationships based only on the data of examinees who have taken a collegeentrance exam are likely to contain an element of selection bias that generally makes the relationshipobtained for college entrance examinees unsuitable for predictive use among the entire studentpopulation. For example, it is hard to predict if a 5th grader will opt to take a college entranceexamination during high school. Instead, what is needed is information, derived from the availabledata, about the likelihood of a student taking a college entrance exam in order to identify a relevantbenchmark for the grade. Given the challenges posed by the need to employ longitudinal test scoresfrom multiple scales, a special analysis is required to achieve sound results.The core of the analysis is built on a multilevel growth model that allows examination of multiplesequential age-cohorts of students and jointly considers the impact of selection on the results. Fromthe growth curve estimates, the joint distribution of a set of MAP and ACT scores from multipleage-cohorts of examinees is determined. Inferences for the individual student at any grade and termare based on the estimated multivariate-normal distributions of MAP scores. These distributionsare conditional on selected ACT benchmarks and a stated probability of a student taking the collegeentrance exam in high school (by grade and term). Many elements of the approach are discussedin the literature on statistical inference for longitudinal data in the presence of missing data andselection (e.g., Albert & Follmann, 2009; Hedeker & Gibbons, 1997; Little, 2008).Following Thum (2011), the recent paper by Thum and Matta (2015) provides the methodologicalbasis for the analyses performed in this study. They successfully deployed this approach for obtaining back-mapped college readiness benchmarks for MAP mathematics and reading based on boththe ACT and SAT scores that were available. Appendix A provides a summary of the approach.Recognizing the potential for seasonal bias (and hence auto-correlated errors), a new functionalform – constructed from an additive polynomial describing between grade features of within gradeThum & MattaPage 7 of 25
MAPCollege Readiness Benchmarkslevel changes – is introduced in place of the more conventional polynomial regression model. Inaddition, adjustment is also made to reflect the measurement error in MAP and ACT scores. Itis important to note that, due to the presence of selection effects, the estimated benchmarks aredependent on the probability that a student takes the college test in high school. This probabilityis set at 0.5 throughout to represent the very reasonable situation where the user wishes to suppressany such knowledge, even if it is available subjectively, when evaluating the college readiness ofmiddle school students. Finally, the approach demonstrated by Thum (2011) and Thum and Matta(2015) for data from a single district is extended in this study to produce a set of benchmarks frompooling the benchmarks of individual districts.ResultsExploratory analysis of the data for each of the 14 districts consistently suggested that high schoolstudents whose MAP scores on reading or mathematics are higher than the district average achievement in the spring of the 8th grade are more likely to take the ACT. The selection model is thenspecified in a manner to exploit this information. The resulting model estimates are used to derivethe college readiness benchmarks (see Appendix A).BenchmarksTo set the MAP college readiness benchmark for mathematics and reading at each grade and term,given an ACT score of 22 or 24 and a 0.5 probability8 that a student will opt to take a college test,are examined. Using the estimated bivariate relationships between each MAP assessment and theACT, benchmarks are identified by considering two classification accuracy standards. The first isthe true positive rate (TPR) and the second is the false positive rate (FPR)9 . The true positiverate is the proportion of students who are considered college ready based on a given MAP scorefor a grade and term and who are actually college ready (based on a score of 24 (or 22) or betteron the ACT during high school), among all those students who scored a 24 (or 22) or better onthe ACT. The false positive rate is the proportion of students who are considered college readybased on a given MAP score but do not score a 24 (or 22) or higher on the ACT among all thosestudents who did not score a 24 (22) or better on the ACT. Locating a MAP score that balanceshigh true positive rate with low false positive rate is key to determining a benchmark for each termand grade.8This probability value merely reflects the situation in which the reader has no specific knowledge about how likelya student will be taking the ACT in high school.9In the wider research literature on decision quality, false positive rate is the Type I error rate and false negativerate is the Type II error rate.Thum & MattaPage 8 of 25
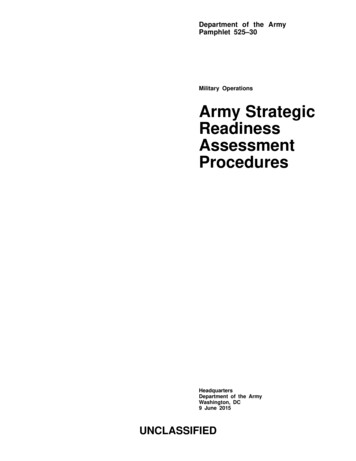
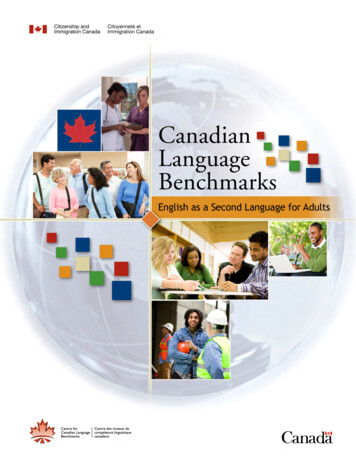
College Readiness Benchmarks1.01.00.90.90.80.80.70.7True Positive RateTrue Positive .0 0.1 0.2 0.3 0.4 0.5 0.6 0.7 0.8 0.9 1.0False Positive Rate0.0 0.1 0.2 0.3 0.4 0.5 0.6 0.7 0.8 0.9 1.0False Positive Rate(b) Math, Spring1.01.00.90.90.80.80.70.7True Positive RateTrue Positive Rate(a) Math, Fall0.60.50.40.60.50.40.30.30.20.20.10.10.00.00.0 0.1 0.2 0.3 0.4 0.5 0.6 0.7 0.8 0.9 1.0False Positive Rate(c) Reading, Fall0.0 0.1 0.2 0.3 0.4 0.5 0.6 0.7 0.8 0.9 1.0False Positive Rate(d) Reading, SpringFigure 1: ACT 22 ROC Plots for Mathematics and Reading Benchmarks, Grades 5 - 9Plotting the true positive rate against the false positive rate for all possible MAP benchmarks for agiven grade and term generates an ROC curve10 . The area under the ROC curve (AUC) is a wellknown measure of predictive power, where a straight 45-degree line represents no predictive power(or 50-50 chance) and an AUC of 1 is perfect prediction11 . As is shown in Table 4, AUC estimatesfor all benchmarks are relatively high, indicating predictions are well calibrated (or reliable).10A “receiver operating characteristic” or ROC curve is a graphical device representing the trade-off between thehit and false alarm rates of a binary decision rule; here, the proposed benchmark for college readiness. See, e.g.,Thum & MattaPage 9 of 25
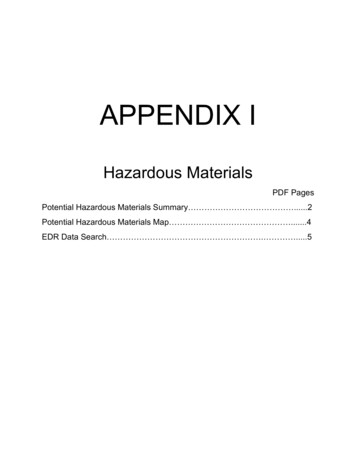
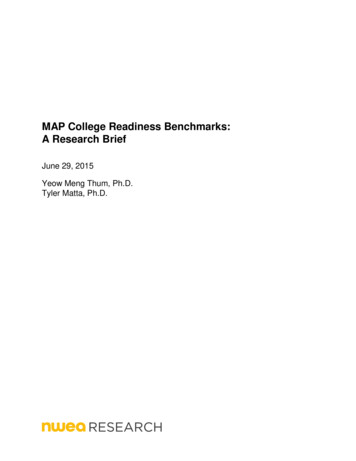
College Readiness Benchmarks1.01.00.90.90.80.80.70.7True Positive RateTrue Positive .0 0.1 0.2 0.3 0.4 0.5 0.6 0.7 0.8 0.9 1.0False Positive Rate0.0 0.1 0.2 0.3 0.4 0.5 0.6 0.7 0.8 0.9 1.0False Positive Rate(b) Math, Spring1.01.00.90.90.80.80.70.7True Positive RateTrue Positive Rate(a) Math, Fall0.60.50.40.60.50.40.30.30.20.20.10.10.00.00.0 0.1 0.2 0.3 0.4 0.5 0.6 0.7 0.8 0.9 1.0False Positive Rate(c) Reading, Fall0.0 0.1 0.2 0.3 0.4 0.5 0.6 0.7 0.8 0.9 1.0False Positive Rate(d) Reading, SpringFigure 2: ACT 24 ROC Plots for Mathematics and Reading Benchmarks, Grades 5 - 9Figure 1 provides four graphs, each one containing the ROC curves for grades 5 through 9 fordifferent subjects (mathematics and reading) and terms (fall and spring) on assuming the ACTbenchmark of 22. Figure 2 displays the same graphs if we assume the more stringent ACT collegereadiness benchmark of 24. Graph (a) illustrates the ROC curves for fall term mathematics, Graph(b) illustrates spring term mathematics, Graph (c) illustrates fall term reading, and Graph (d)represents spring term reading. In each graph, the grade 5 scores are the shallowest (smaller AUC)Swets, Dawes, and Monahan, (2000).11The AUC is also called a “concordance” statistic.Thum & MattaPage 10 of 25
MAPCollege Readiness BenchmarksTable 4: Area Under the Curve (AUC) for MAP College Readiness BenchmarksGradeSubjectACT Term5f6sf7sf8sf9sfsReading22240.873 0.886 0.892 0.901 0.902 0.908 0.904 0.906 0.897 0.8960.879 0.893 0.898 0.907 0.909 0.914 0.910 0.912 0.904 0.902Mathematics22240.866 0.887 0.896 0.906 0.912 0.917 0.917 0.919 0.914 0.9140.877 0.897 0.906 0.916 0.922 0.926 0.927 0.928 0.924 0.923and are represented by the solid curved line. As the grade level increases, the AUC becomeslarger and the curve approaches the top-left corner of the plot. This indicates, as expected, thatbenchmarks at 8th and 9th grade are more predictive of college readiness than benchmarks in 5thgrade. On the whole, use of the benchmarks leads to highly accurate predictions. The point plottedon each curve is the MAP benchmark with the given true positive rate and false positive rate inTable 5.In addition to the pooled benchmarks for each grade, term and subject listed in Table 5 are theirstandard errors, 2015 normative percentiles, true positive, and false positive rates. The standarderrors indicate that the benchmarks are well-estimated. As expected, benchmarks increase withgrade level and they also appear to be more stringent, as they approach high school. For example,the mathematics benchmark (corresponding to the ACT score of 24) for fall term of grade 7 is 236.84which corresponds with the 81st12 percentile based on the 2015 NWEA MAP national norms. Usingthis benchmark will correctly classify students who are college ready 68% of the time while falselyclassifying students who are not college ready as college ready only 10% of the time. The truepositive rate for mathematics ranges from 0.63 (fall, grade 5) to 0.70 (spring, grade 7; fall, grade 8;spring, grade 8; spring, grade 9). The false positive for mathematics benchmarks ranges from 0.15(fall, grade 5) to 0.10 (fall, grade 7 and on). The true positive rates for reading benchmarks rangefrom 0.70 to 0.73 and the false positive rates range from 0.18 to 0.13. Table 5 also gives the resultscorresponding to the ACT benchmark of 22.ApplicationsRather than use a cut-score to make a simple pronouncement of whether a student is college readyor not, inference statements that provide a suitable normative context and acknowledges thatdata quality precludes such deterministic characterization are to be preferred (Maruyama, 2012).Specifically, two types of inferences are useful based on the estimated benchmarks for students:comparison with peers and evaluating college readiness.12This percentile was incorrectly reported as 79th in an earlier version of the report.Thum & MattaPage 11 of 25
MAPCollege Readiness BenchmarksTable 5: Normative Stringency and Classification Accuracy of Pooled Benchmarks for MAP Mathematics and Reading TestsMathematics, ACT 22
high school students who take ACT (from about 20% to 70%). It seems reasonable to believe that whether or not a student takes the ACT is not a random outcome but is one that reflects some degree of self-selection. Introducing an approach to mitigate potential self-selection biases in the benchmark estimates is a central contribution of the study.