Transcription
Architecture of energy balance traits in emerging linesof the Collaborative CrossWendy Foulds Mathes, David L. Aylor, Darla R. Miller, Gary A. Churchill, ElissaJ. Chesler, Fernando Pardo-Manuel de Villena, David W. Threadgill and DanielPompAm J Physiol Endocrinol Metab 300:E1124-E1134, 2011. First published 22 March 2011;doi:10.1152/ajpendo.00707.2010You might find this additional info useful.Supplemental material for this article can be found 1/03/17/ajpendo.00707.2010.DC1.htmlThis article cites 60 articles, 15 of which can be accessed free 24.full.html#ref-list-1Updated information and services including high resolution figures, can be found 24.full.htmlThis infomation is current as of July 6, 2011.AJP - Endocrinology and Metabolism publishes results of original studies about endocrine and metabolic systems on any level oforganization. It is published 12 times a year (monthly) by the American Physiological Society, 9650 Rockville Pike, Bethesda MD20814-3991. Copyright 2011 by the American Physiological Society. ISSN: 0193-1849, ESSN: 1522-1555. Visit our website athttp://www.the-aps.org/.Downloaded from ajpendo.physiology.org on July 6, 2011Additional material and information about AJP - Endocrinology and Metabolism can be found at:http://www.the-aps.org/publications/ajpendo
Am J Physiol Endocrinol Metab 300: E1124–E1134, 2011.First published March 22, 2011; doi:10.1152/ajpendo.00707.2010.Architecture of energy balance traits in emerging linesof the Collaborative CrossWendy Foulds Mathes,1 David L. Aylor,1 Darla R. Miller,1 Gary A. Churchill,2 Elissa J. Chesler,2Fernando Pardo-Manuel de Villena,1 David W. Threadgill,3 and Daniel Pomp1,41Department of Genetics, University of North Carolina, Chapel Hill, North Carolina; 2The Center for Genome Dynamics, TheJackson Laboratory, Bar Harbor, Maine; 3Department of Genetics, North Carolina State University, Raleigh; and4Departments of Nutrition, Cell and Molecular Physiology, University of North Carolina, Chapel Hill, North CarolinaSubmitted 29 December 2010; accepted in final form 15 March 2011genetics; wheel running; adiposity; body weight; quantitative trait lociand composition is dependentprimarily on energy balance, the net sum of calories consumedand calories expended. Complex interactions between manygenes and environmental factors modulate body weight, adiposity, and physical activity, contributing to the developmentof obesity, obesity-related disease, and individual differencesin response to treatments and interventions to combat obesity(5, 20, 26, 34, 49) including exercise (26). Human genomewide association studies have identified several loci associatedwith body weight and obesity, although the individual contributions of these loci to the genetic variance are relatively small(38, 41), and the functions of identified genes are often difficultto ascertain.REGULATION OF BODY WEIGHTAddress for reprint requests and other correspondence: W. F. Mathes, Dept.of Genetics, Univ. of North Carolina at Chapel Hill, 120 Mason Farm Rd., CB#7264, Chapel Hill, NC 27599 (e-mail: wfmathes@med.unc.edu).E1124Studies in mice have identified hundreds of quantitativetrait loci (QTL) for body weight, obesity, and physicalactivity traits (28, 29, 31, 33, 39, 46, 50). Most QTL studieshave used intercross or backcross (BC) mouse populationsto identify regions of the genome associated with metabolism- and exercise-related phenotypes. These studies haveseveral limitations. First, QTL in these populations generally map to broad genomic intervals due to large regions oflinkage disequilibrium (LD) (11, 12). Recently, the use ofadvanced intercross lines (AIL) and recombinant inbredlines (RIL) has increased QTL mapping precision, butidentification of the underlying genetic variation remainselusive in almost all cases (14, 16, 25, 30). Second, themajority of QTL mapping crosses employ only the mostcommonly used inbred strains, which harbor a relativelysmall proportion of the genetic diversity of Mus musculus,greatly limiting the search space for genetic variation controlling complex traits (44). In addition, a large fraction of thegenome are blind spots for genetic mapping because recentshared ancestry leads to identity by descent in crosses based ontwo parental strains (59).The Collaborative Cross (CC) recombinant inbred panel wasconceived as an improved resource for mammalian systemsgenetics and to overcome many of the limitations of traditionalQTL mapping populations (10, 55). To investigate the utilityand insights that can be learned from the CC, an experimentwas performed involving incipient CC lines that had undergoneat least five generations of inbreeding (pre-CC). CC linesoriginated from a cross of eight founder inbred strains, including three representing wild-derived strains from three of theMus musculus subspecies and traditional inbred strains genetically predisposed to the development of complex disorderssuch as types 1 and 2 diabetes, obesity, and insulin insensitivity(36). Analysis of pre-CC genetic architecture revealed highdiversity, balanced allele frequencies, and well-distributed recombination, all ideal qualities for a mapping panel (2).In this study, we characterized phenotypic variation andmapped QTL in the pre-CC population for a suite of traitsrevolving around energy balance, including body weight andbody composition, both before and after a 12-day period ofvoluntary exercise in running wheels. We found that thepre-CC lines adequately captured and often exceeded thephenotypic variation among the eight founder strains. In someinstances, such as wheel running distances and body weightchange in response to exercise, phenotypic variation in thepre-CC far exceeded the range of variability afforded by theprogenitors. Importantly, many phenotypic correlations existing within the progenitor and also larger panels of extant inbred0193-1849/11 Copyright 2011 the American Physiological Societyhttp://www.ajpendo.orgDownloaded from ajpendo.physiology.org on July 6, 2011Mathes WF, Aylor DL, Miller DR, Churchill GA, Chesler EJ,Pardo-Manuel de Villena F, Threadgill DW, Pomp D. Architectureof energy balance traits in emerging lines of the Collaborative Cross.Am J Physiol Endocrinol Metab 300: E1124 –E1134, 2011. Firstpublished March 22, 2011; doi:10.1152/ajpendo.00707.2010.—Thepotential utility of the Collaborative Cross (CC) mouse resource wasevaluated to better understand complex traits related to energy balance. A primary focus was to examine if genetic diversity in emergingCC lines (pre-CC) would translate into equivalent phenotypic diversity. Second, we mapped quantitative trait loci (QTL) for 15 metabolism- and exercise-related phenotypes in this population. We evaluated metabolic and voluntary exercise traits in 176 pre-CC lines,revealing phenotypic variation often exceeding that seen across theeight founder strains from which the pre-CC was derived. Manyphenotypic correlations existing within the founder strains were nolonger significant in the pre-CC population, potentially representingreduced linkage disequilibrium (LD) of regions harboring multiplegenes with effects on energy balance or disruption of genetic structureof extant inbred strains with substantial shared ancestry. QTL mapping revealed five significant and eight suggestive QTL for bodyweight (Chr 4, 7.54 Mb; CI 3.32–10.34 Mb; Bwq14), body composition, wheel running (Chr 16, 33.2 Mb; CI 32.5–38.3 Mb), body weightchange in response to exercise (1: Chr 6, 77.7Mb; CI 72.2– 83.4 Mband 2: Chr 6, 42.8 Mb; CI 39.4 – 48.1 Mb), and food intake duringexercise (Chr 12, 85.1 Mb; CI 82.9 – 89.0 Mb). Some QTL overlappedwith previously mapped QTL for similar traits, whereas other QTLappear to represent novel loci. These results suggest that the CC willbe a powerful, high-precision tool for examining the genetic architecture of complex traits such as those involved in regulation of energybalance.
E1125EXERCISE AND METABOLISM-RELATED TRAITS IN PRE-CC MICETable 1. Experimental time lineDayPhenotypeProcedureDay 1Days 4–7ArrivalSedentary food intake (FI)Day 7Day 8Days 9–20Day 21Initial BW and BFPRERWheel running and food intake: D1, D56, D12S1, S56, S12 FIRunBWpost and BFpostDay 22Day 23RERpostEuthanasia and dissectionMice housed in cages attached to running wheels with guillatine doors closed toprevent access to running wheel.BW measured and BFP determined by MRIIndirect calorimetry (24 h)Mice returned to home cages. Guillotine doors opened to allow access torunning wheels. FI measured every other day.Guillotine doors closed.BW measured and BFP determined by MRIIndirect calorimetry (24 h)See text for definitions.EXPERIMENTAL PROCEDURESOrigin of the mice and development of the pre-CC lines and theirhusbandry prior to the current phenotyping screen are describedelsewhere (2, 7). Briefly, five traditional (129S1/SvImJ, A/J, C57BL/6J, NOD/LtJ, NZO/H1Lt) and three wild-derived (CAST/EiJ, PWK/PhJ, and WSB/EiJ) inbred mouse strains were outcrossed for twogenerations, and the resulting G2:F1 population was inbred by siblingmatings at the Oak Ridge National Laboratories (ORNL). The pre-CClines used in the experiments described in this paper were a subset of650 lines initiated at ORNL (7). Initial analysis of pre-CC linesdemonstrated that all eight of the founder alleles contributed equiva-lently to the pre-CC population, suggesting that genetic contributionsfrom each of the eight founder alleles were present at all loci (2).Recombination break points were distributed approximately evenlyacross the genome in our sample.Mice were weaned at ORNL and transferred to a phenotypingfacility at the University of North Carolina at Chapel Hill. Onehundred eighty-four lines ranging from generation G2:F5 to G2:F12were transferred to the phenotyping facility, and 176 were included inthe final analyses. Animals were transferred according to availability.Exercise and metabolism data were collected as part of a highthroughput phenotyping screen (Table 1), and only these methods willbe discussed herein.Adult male mice, 10 –12 wk of age, from 176 pre-CC lines and theeight CC founder strains (129S1/SvImJ, n 10; A/J, n 10;CAST/EiJ, n 11; C57BL/6J, n 11; NOD/LtJ, n 7; NZO/H1LtJ,n 9; PWK/PhJ, n 11; and WSB/EiJ, n 7) were housedindividually in standard laboratory cages with attached runningwheels (1.1 m diameter; Lafayette Industries, Lafayette, IN) in atemperature- (23 1 C) and humidity-controlled vivarium with astandard 12:12-h light-dark cycle (lights on at 0600). Access to therunning wheels was blocked for the first 8 days after the mice arrivedin the vivarium. Mice had ad libitum access to food and water. Groundstandard laboratory chow that had been dyed blue for easier spilldetection and collection (LabDiet 5053, blue; TestDiet, Richmond,Table 2. Descriptive statistics for metabolic and exercise traits in pre-CC linesTraitPreexerciseBW, gBFPFI, kcal/day/BWNocturnal RERn176176174130Mean (95% CI)23.74 (23.15, 24.33)9.23 (8.56, 9.91)0.61 (0.58, 0.64)0.92 (0.90, 10.9114,940.8416,557.5719,333.33Exercise traitsRunning distances, mDay 1Days 5 and 6Days 11 and 12Running speeds, m/minDay 1Days 5 and 6Days 11 and 12FI, kcal/day/BWPostexerciseBW, gBFPChange in BW, gChange in BFP1761761754,096.73 (3,632.35, 4,561.11)4,850.18 (4,404.45, 5,295.91)5,610.96 (5,047.28, 6,174.63)1761761751758.63 (8.01, 9.24)13.66 (12.92, 14.40)15.54 (14.64, 16.43)0.65 (0.63, 7617617617623.88 (23.32, 24.45)6.52 (5.92, 7.11)0.14 ( 0.16, 0.45) 2.67 ( 3.14, 2.19)3.784.022.083.1714.70.62 6.57 13.9536.3421.718.355.5CC, Collaborative Cross; RER, respiratory exchange ratio (VCO2/VO2).AJP-Endocrinol Metab VOL300 JUNE 2011 www.ajpendo.orgDownloaded from ajpendo.physiology.org on July 6, 2011strains were disrupted in the pre-CC population with its randomly assorted variation. Despite the absence of full homozygosity in the pre-CC population and the small sample size,which limit statistical power in this proof-of-concept study, weidentified five significant QTL and eight suggestive QTL formany energy balance traits, including body weight, body fat,levels of voluntary exercise, body weight change in response toexercise, and food intake during exercise. QTL mapping in thepre-CC population replicated existing QTL regions and identified novel QTL for the metabolism and exercise traits weevaluated.
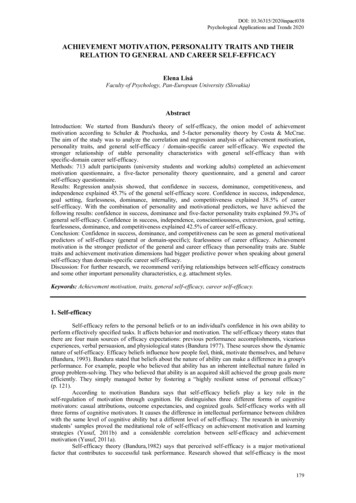
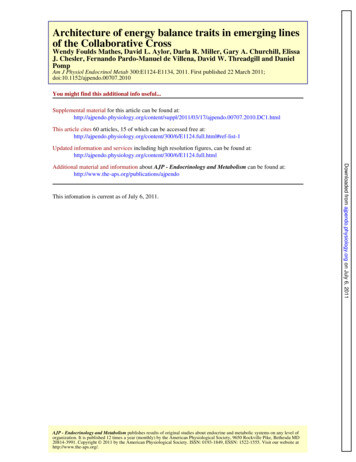
E1126EXERCISE AND METABOLISM-RELATED TRAITS IN PRE-CC MICEstrains. Similar widespread variability was observed in initialBFP, ranging from 2.4% in A/J to 32.6% in NZO/H1LtJ, andin wheel running distance and speed at all time points evaluated.Phenotypic diversity in the pre-CC lines matched and oftenexceeded that seen in the founder strains. Ranges of phenotypicvalues for traits such as initial BW and initial BFP, althoughhighly variable in the pre-CC population, did not exceed thoseobserved in the founder strains (Table 2 and Fig. 1). However,variability in wheel running traits, food intake (while sedentaryor while running), indirect calorimetry measures, and changesin BW and BF in response to wheel running often exceededthat seen in the founders (Table 2 and Supplemental Table S1).For instance, nocturnal RER, an indicator of energy utilization,measured prior to exercise ranged from 0.79 to 1.11 in thefounder strains, whereas the pre-CC lines showed a broaderrange of variability with values from 0.69 to 1.12 (Fig. 2).Likewise, average wheel running distances on days 5 and 6(D56) and days 11 and 12 (D12) of the running period farexceeded values in the founder strains, with maximum valuesof 13,600 and 13,200 m/day evident in the PWK/PhJ founderstrain and 16,600 and 19,300 m/day in the pre-CC lines, respectively (Fig. 3). The pre-CC lines also demonstrated greater variability in average daily food intake during wheel access, withRESULTSPhenotypic variation among the pre-CC lines. The genotypic diversity among the founder strains resulted in highphenotypic diversity. Metabolism- and exercise-related traitswere measured over a 3-wk period. Phenotypic measurementsincluded body weight and body fat percentage before and after12 days of wheel running, respiratory exchange ratio, foodintake while sedentary or during wheel running, and runningphenotypes such as speed and distance measured on days 1, 5and 6, and 11 and 12. There were highly significant differencesamong the eight strains in the 15 phenotypes tested [P 0.001;Supplemental Table S1 (supplementary materials are found inthe online version of this paper at the Journal website)]. InitialBW values ranged from 13.5 g in WSB/EiJ to 47.8 g inNZO/H1LtJ and averaged 26.5 0.84 g across the eightAJP-Endocrinol Metab VOLFig. 1. Body weights (BW) and body fat percentages (BFP) in pre-CC andfounder lines prior to running wheel access. A: phenotypic variation amongfounder strains exceeded the variation among the pre-CC lines for BW. BW forall pre-CC lines fell within the low and high extreme values of WSB/EiJ andNZO/H1LtJ, respectively. B: variation in BFP in pre-CC lines was comparableto that of founder strains. Although several pre-CC lines held extreme low BFPvalues, extreme high BFP were determined solely by NZO/H1LtJ. Groupmeans for each founder line are indicated in black with appropriate colorcoded asterisk above to indicate strain being depicted.300 JUNE 2011 www.ajpendo.orgDownloaded from ajpendo.physiology.org on July 6, 2011IN) was presented in spill-resistant feeders (OYC Rodent Café; OYCInternational, Andover, MA). Any spillage was collected andweighed. Daily average food intake was calculated for 3 days prior towheel access [sedentary food intake (FI)] by dividing the total amountof food consumed during this period by 3. During the 12 days ofwheel running, food intake (FIRun) was measured every other day,and daily averages were calculated. Intakes were corrected for bodyweight (BW) by dividing average intakes by the average BW for themeasurement period.BW was measured at the beginning (BW) and end (BWpost) of thesedentary and wheel running phases of the experiment (Table 1).Body composition was evaluated prior to the start [body fat percentage (BFP)] of wheel running and again after the 12-day wheel trial(BFpost) using MRI (EchoMRI, Houston, TX) to determine fat andlean mass percentages. Change in BW and BFP in response toexercise was calculated by subtracting the preexercise value from thepostexercise value (BWnet and BFnet, respectively). Negative valuesindicate a loss of BW or fat in response to wheel running. Indirectcalorimetry was used to determine energy expenditure for each mousebefore [RER (respiratory exchange ratio)] and after running wheelaccess (RERpost). The day before the mice were given access to therunning wheels, mice were placed into calorimetric chambers (TSEcalosys; TSE Systems, Germany) and O2 consumption, CO2 production, and respiratory exchange ratios were measured for 24 h.Wheel running was recorded continuously over a 12-day periodusing an automated activity wheel monitoring program (AWM;Lafayette Industries, Lafayette, IN). For data analysis, distance andspeed data were directly extracted for day 1(D1, S1), and runningdistances and speeds were averaged for days 5 and 6 (D56, S56) anddays 11 and 12 (D12, S12) of wheel access.Genotype data for QTL mapping were collected using intermediarymodels of the Mouse Diversity Array (60). This array contained181,752 high-performing single-nucleotide polymorphisms (SNP)that spanned the entire mouse genome (2).All procedures performed within this series of experiments wereapproved by the University of North Carolina - Chapel Hill Institutional Animal Care and Use Committee.One-way ANOVA was used to assess strain effects among thefounder strains on each of the phenotypes measured. Tukey’s HSD(honestly significant difference) post hoc comparisons were used todetermine significant differences among each of the strains. Pearson’scorrelations were performed to determine significant associationsamong the phenotypes for individual mice within the founder andpre-CC lines. Statistical analysis for QTL mapping is described byAylor et al. (2). Briefly, QTL mapping was performed using aregression model (37) where each phenotype was regressed on expected haplotypes at each SNP interval. Resultant F-statistics weretransformed to LOD scores. Genome-wide significance of LOD scoreswere determined by permutation.
EXERCISE AND METABOLISM-RELATED TRAITS IN PRE-CC MICEE1127Fig. 2. Nocturnal respiratory exchange ration (RER) infounder and pre-CC lines prior to exercise. RER (V̇CO2/V̇O2), a measure of energy utilization, was far more variablein pre-CC lines than in founders. RER values of 0.7 ad 1.0represent using pure fat or carbohydrate, respectively, asenergy. Mixed diets tend to produce RER values between0.8 and 0.9. Extreme values beyond 1.0 may indicatehyperactivity, anxiety, or stress. Several pre-CC lines demonstrated extreme low or high RER vs. founder lines. Groupmeans for each founder line are indicated in black withappropriate color-coded asterisk above to indicate strainbeing depicted.AJP-Endocrinol Metab VOLfor BWnet. Suggestive QTL were also identified for BF andD56 running distances.The largest effect QTL we found was for initial BW and itmapped to proximal chromosome (Chr) 4 [peak at 7.54 Mb,named Bwq14 (2)]. This locus overlaps a previously reportedQTL for BW in an F2 cross between C57BL6/J and KK/HIJmice (52, 53), a polygenic type 2 diabetes model with moderateobesity that shares phenotypic similarity with NZO/HILtJ (22,23). Similarly, a QTL for blood pressure associated withmetabolic syndrome in an NZO/HILtJ C3H/HeJ F2 population has been mapped in close proximity to this locus (40), asdoes a BW QTL in ILS ISS (LXS) RI strains (Chr 4, 9.9Mb). The BW QTL in the LXS was not identified upon initialanalysis but was found to be significant using a multiple QTLmodel that incorporated additive and epistatic interactions (4).By analyzing SNP data and allele effects for each of the eightfounder strains at this locus in the pre-CC population, positional candidate genes were identified that potentially underpinthis body weight QTL (2). By further incorporating eQTL data,a high-priority candidate for future functional analysis, aspartate- -hydroxylase (Asph), was identified from among thepositional candidate genes (2).Two significant and one suggestive QTL were identified forBWnet on Chr 6 (72.2– 83.4 Mb, 39.4 – 48.1 Mb, and 69.5–98.0 Mb, respectively). Additional suggestive QTL for BWnetwere identified on Chr 3 (47.63 Mb) and Chr 10 (111.13 Mb).A suggestive QTL for BF was also identified on Chr 6(126.7Mb). These findings overlap with previously mappedBW- and BF-associated loci (1, 8, 9, 15, 16, 45, 48).A significant QTL for D12 wheel running distance wasidentified on Chr 16 (33.2 Mb) that accounted for 17.0% of theobserved phenotypic variance for this trait (Fig. 6). A similarpeak was observed for D56 wheel running distance, althoughthis peak failed to reach genome-wide significance thresholds.This likely pleiotropic effect on voluntary exercise at differentages is not surprising given the high degree of correlationbetween the two traits (r2 0.84). Chromosome 16 has notpreviously been associated with wheel running or locomotorbehavior. Previous studies using F2 intercrosses identified lociassociated with running distance on Chr 7 and 13 (27, 33, 39)300 JUNE 2011 www.ajpendo.orgDownloaded from ajpendo.physiology.org on July 6, 2011individual mice consuming 0.29 –1.33 kcal·day 1·g BW 1, whileindividual intakes ranged from 0.36 kcal·day 1·g BW 1 in theNZO/H1LtJ to 1.26 g in CAST/EiJ (Fig. 4). Additionally, BWchange after exercise (BWnet) ranged from a loss of 5.8 g BWin NZO/H1LtJ to a gain of 3.3 g BW in 129S1/SlvmJ and froma loss of 6.6 g BW to a gain of 8.4 g BW in the pre-CC mice(Fig. 5). Body fat loss (g) during exercise in the pre-CC farexceeded that of the founders, whereas body fat gain (g) wasgreater in the founders than in the pre-CC. Net changes in BFPranged from a loss of 14.0% to a gain of 5.5% in the pre-CCand a loss of 9.4% in NZO/H1LtJ and a gain of 7.5% in A/J(Fig. 5).Disruption of phenotype correlations. Recombination andassortment of the genomes of founder strains within the pre-CClines led to disruption of phenotypic correlations commonlyseen in the founder strains. For example, significant correlations were identified between most metabolism and exercisetraits in the founder strains. Specifically, correlation analysisrevealed significant correlations between BFP, both before andafter exercise, and the traits BW, BWpost, BWnet, BF changeafter exercise (BFnet), food intake while sedentary (FI), foodintake during the 12-day exercise period (FIRun), RER, and allwheel running distance and speed traits in the founder strains(Table 3). Likewise, BW was significantly correlated with allmeasured traits with the exception of RER and BFnet. Incontrast, initial BW and BFP were uncorrelated with wheelrunning in the pre-CC mice, although they remained correlatedwith other metabolic phenotypes such as FI, RER, BWnet, andBFnet (Table 4). Nevertheless, running traits were correlatedwith each other and with food intake during running (Table 4).In the pre-CC lines, only running distance and speed on D1 ofthe running period were correlated with RER, which wasmeasured on the night immediately prior to initiation of running (Table 4).QTL mapping metabolism and exercise traits. QTL mappingof the phenotypes presented above revealed five significant QTL(P 0.05) and eight suggestive QTL (P 0.20) (Table 5). Asingle significant QTL was observed for D12 and FIRun. Onesignificant and one suggestive QTL were identified for BW,and two significant and three suggestive QTL were identified
E1128EXERCISE AND METABOLISM-RELATED TRAITS IN PRE-CC MICEand loci associated with running speed and duration on Chr 9and 13 (33). In addition, recent haplotype association mappingrevealed significant QTL for running distance on Chr 5, 6, 8, 11,12, 13, 18, and 19 and for running speed on Chr 6 and 11 (32). Sixof the strains used in the Lightfoot study were the same founderstrains used to create the pre-CC population. However, significantdifferences in phenotypic expression exist across these two studies. For example, running distances for CAST/EiJ and WSB/EiJwere significantly shorter in the Lightfoot study than in the resultsreported here. This brings to light the potential effect of differences in experimental procedures and laboratory environments onthe detection of QTL, especially for traits with behavioral influences. Moreover, running was presented as the total distanceaveraged over 21 days of wheel access in the Lightfoot study,whereas the current phenotypes were the average distances onD56 and D12 of wheel access.Suggestive QTL for spontaneous locomotor activity havebeen identified on Chr 3, 8, 12, 13, and 19 (56), while noveltyand stress-induced locomotor activity are associated with locion Chr 1, 4, 5, 8, 9, 13, 14, and 19 (17). Mice examined in theaforementioned studies consisted of F2, BC, and AIL populationswith only one strain (C57BL6/J) in common with those used togenerate the pre-CC; thus, the suggestive QTL in the pre-CC mayAJP-Endocrinol Metab VOLDISCUSSIONThe CC was proposed as a model for systems biology andhigh-precision complex trait analysis. The CC is expected tocapture unprecedented mouse genetic and phenotypic diversitysimilar to that seen in the human population (44). This assertion was validated in the present experiment. We demonstratedthat the significantly broad genetic diversity captured in the300 JUNE 2011 www.ajpendo.orgDownloaded from ajpendo.physiology.org on July 6, 2011Fig. 3. Average running distances in pre-CC and founder lines on days 5 and6 (D56) and days 11 and 12 (D12) of ad libitum running wheel access. Micewere given 12 days of ad libitum running wheel access. Running distances andspeeds were recorded continuously over 24 h in 1-min increments. Meandistances for D56 (A) and D12 (B) were exceedingly more variable amongpre-CC lines than founder lines. Group means for each founder line areindicated in black with appropriate color-coded asterisk above to indicatestrain being depicted.be attributed to allele-specific effects not present in the othergenetic crosses. Additional suggestive QTL in the pre-CC studywere identified for D56 on Chr 1 and 9. Several regions of Chr 1are associated with stress- and anxiety-related locomotor activityin A/J C57BL6/J (AXB/BXA) RI strains (17). Thus, stress andanxiety may have contributed to variability in wheel running. Thelocus on Chr 9 coincides with suggestive QTL for runningdistance in a C57L/J C3H/HeJ F2 population and also overlapswith a speed QTL in that population (33).Allele effect estimates and expression QTL (eQTL) analysisfor the wheel running QTL on Chr 1, 9, and 16 were performedas described by Aylor et al. (2). Allele effect estimates suggestthat WSB/EiJ alleles consistently contributed to increasedwheel running distances at all QTL. Allele effect patterns weresimilar between the novel D56 and D12 peaks on Chr 16, withA/J and WSB/EiJ alleles contributing to increased wheel running distance at these two loci. Interestingly, when wheelrunning among the founder strains was assessed, WSB/EiJ ranthe greatest distances, while A/J ran the second shortest distances of the eight founder strains. Moreover, wheel runningdistances in the pre-CC population revealed extreme phenotypes compared with the founder strains, providing evidence oftransgressive segregation in this population (42, 43).Expression QTL analysis in liver for the D12 QTL region onChr 16 revealed 31 significant (P 0.05 genome-wide) localeQTL (Supplemental Table S2). Several of the transcriptsidentified through eQTL analysis are involved with energyhomeostasis (e.g. Atp13a3, Parp9, Tnk2, Atp6v1a) (Fig. 6).Many of the identified genes are also implicated in smoothmuscle function and mitochondrial and lung disease (e.g.,Heg1, Mylk, Ccdc58, ltgb5). Comparisons of allele effectpatterns specific to A/J and WSB/EiJ failed to refine thecandidate region to allow for the identification of specificpolymorphisms that might underpin the D12 QTL on Chr 16.A significant QTL for food intake during exercise (FIRun)was identified on Chr 12 (85.1Mb), accounting for 17.6% ofthe observed phenotypic variance. Previously identified QTLoverlapping with this locus has been demonstrated to interactwith loci on Chr 2, exerting epistatic effects on BW and growthin a C57BL6/J backcross with Mus musculus castaneus trappedfrom the wild (24). Allele effect estimates indicate that theC57BL6/J allele was the predominant contributor to increasedfood intake during wheel running at this locus. ExpressionQTL analysis in liver revealed local eQTL (P 0.05 genomewide) for 18 genes within the FIRun QTL region (Supplemental Table S2). Three of these 18 genes (Acot2, Ptgr2, Dlst) aredirectly related to metabolic processing and energy homeostasis (21, 51, 58). Expression of an additional gene, Aldh6a1, isaltered in response to fluctuations in energy states such asfasting (61). Although highly speculative, these findings suggest interesting targets for future investigations into the geneticarchitecture of energy homeostasis during exercise.
EXERCISE AND METABOLISM-RELATED TRAITS IN PRE-CC MICEE1129Fig. 4. Average daily food intake in founder and pre-CCmice during wheel access. Food intake was measured everyother day during 12 days of running wheel access. Intakeswere averaged across the 12 days and corrected for BW.Intakes are expressed as kcal·day 1·BW 1. Although
potential utility of the Collaborative Cross (CC) mouse resource was evaluated to better understand complex traits related to energy bal-ance. A primary focus was to examine if genetic diversity in emerging CC lines (pre-CC) would translate into equivalent phenotypic diver-sity. Second, we mapped quantitative trait loci (QTL) for 15 metab-