Transcription
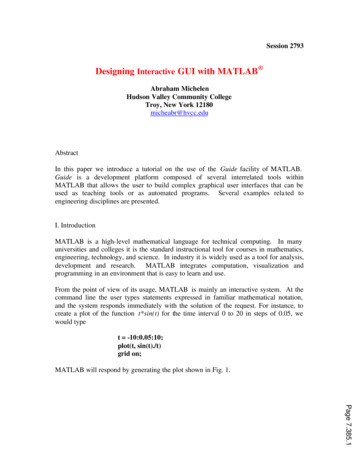
Session 2793Designing Interactive GUI with MATLAB Abraham MichelenHudson Valley Community CollegeTroy, New York 12180micheabr@hvcc.eduAbstractIn this paper we introduce a tutorial on the use of the Guide facility of MATLAB.Guide is a development platform composed of several interrelated tools withinMATLAB that allows the user to build complex graphical user interfaces that can beused as teaching tools or as automated programs. Several examples rela ted toengineering disciplines are presented.I. IntroductionMATLAB is a high- level mathematical language for technical computing. In manyuniversities and colleges it is the standard instructional tool for courses in mathematics,engineering, technology, and science. In industry it is widely used as a tool for analysis,development and research. MATLAB integrates computation, visualization andprogramming in an environment that is easy to learn and use.From the point of view of its usage, MATLAB is mainly an interactive system. At thecommand line the user types statements expressed in familiar mathematical notation,and the system responds immediately with the solution of the request. For instance, tocreate a plot of the function t*sin(t) for the time interval 0 to 20 in steps of 0.05, wewould typet -10:0.05:10;plot(t, sin(t)./t)grid on;MATLAB will respond by generating the plot shown in Fig. 1.Page 7.385.1
Figure 1: Plot of sin(t)/tIf, however, we need to generate a new plot by changing the interval or any otherparameter of the plot we would have to type again the same command lines withdifferent values. In our case this may not be a big problem because we would have tore-type only two lines. However, for more complicated engineering problems the usermay find this process quite an ordeal. To minimize this effort, a better approach is tobuild graphical user interfaces (GUIs) using the Guide facility of MATLAB where theuser can interact with the GUI by using graphical objects. In this way, to change aparameter in a particular problem and repeat an operation with the new parameter can beaccomplished by clicking a push button or by dragging an interface.Guide is a set of tools designed to build GUIs from within MATLAB. In a matter ofminutes the experienced user can create complex graphical tools that can be used toteach the behavior of a system when one or several parameters are changed; even fullsimulation laboratory exercises can be created without a big effort. The author havedeveloped simulation labs for electronics and telecommunication courses that allow thestudents to study the behavior of systems without the need to use expensive orcomplicated equipments. In the next section we introduce an example of a finishedproblem, and in subsequent sections a tutorial is presented on how to build the GUIusing the Guide facility of MATLAB.II. Example: Amplitude ModulationThe following example illustrates the effect on the amplitude- modulated signal when thecoefficient of modulation is changed. Mathematically, the amplitude modulation (AM)process can be expressed asy(t) [1 na x(t)] cos(2ðfct)(1)Page 7.385.2“Proceedings of the 2002 American Society for Engineering Education Annual Conference &Exposition Copyright 2002, American Society for Engineering Education”
where cos(2ðfct) is the carrier and x(t) is the input signal (data). The parameter na is theknown as the modulating index or coefficient of modulation. This index is defined asthe ratio of the amplitude of the input signal to the amplitude of the carrier. Theenvelope of the resulting AM signal is [1 na x(t)]. Eq. (1) represents the scheme knownas double-sideband transmitted carrier (DSBTC). As long as na 1, the envelope is anexact replica of the input signal. If, on the other hand, na 1, the envelope will cross thetime axis and information will be lost because it will not be possible to demodulate thesignal at the receiver and obtain the original signal.With the help of the Guide facility of MATLAB the GUI for this problem was created.As it is illustrated in Figures 2 to 4, this interface consists of a plot area and several pushbuttons to allow the user to select from several values of the modulation index, andbuttons to select or deselect the grid option, and one button to terminate the program.Figure 2 shows the effect of selecting a coefficient of modulation equal to 0.5.Figure 2: Amplitude modulation with na 0.5By clicking the button for na 1.0, Figure 3 will be generated without delay. Thestudent will concentrate in learning the effect of changing the coefficient of modulationrather than in the details of re-typing the statements of the problem.“Proceedings of the 2002 American Society for Engineering Education Annual Conference &Exposition Copyright 2002, American Society for Engineering Education”Page 7.385.3Figure 3: Amplitude modulation with na 1.0
Similarly, by clicking the button for na 1.5 Fig. 4 will show the effect of aliasing in theAM signal.Figure 4: Amplitude modulation with na 1.5III. The Guide facilityThe Guide is a set of five MATLAB tools that allows the user to graphically create GUIsby clicking and dragging objects with the mouse. The Guide tools are:1. The Control Panel, among other features, is a container for the other fourtools and the object palette from where the user selects the objects to beused for the design. There are ten different kinds of objects or controlsavailable: Push buttons Radio buttons Checkboxes Editable text control Sliders Frames Listboxes Pop-up menus Axes (Coordinate System)“Proceedings of the 2002 American Society for Engineering Education Annual Conference &Exposition Copyright 2002, American Society for Engineering Education”Page 7.385.42. The Property Editor, which is the tool that is used to set the properties ofthe objects. Properties include the color of the object, its size, the captionthat distinguishes the object, the visibility, the initial data assigned to theobject, etc.3. The Callback Editor lets the user assign a set of MATLAB commands orfunctions to an object. When the object is activated (by clicking the object
with the mouse, for instance) the callback commands will be executed. TheCallback Editor is also used to make change to the code assigned to theobject in real time, if desired.4. The Alignment Tool allows you to align selected object using a set ofalignment menus. While in design mode, a collection of objects can bealigned vertically, horizontally,5. The Menu Editor is used to add and edit user-created pull-down menu itemsassociated with a project.IV. A complete ExampleTo illustrate how to use the Guide to create an interactive GUI, we will create a systemto plot several different types of graphs. Our design will consist on a coordinate system(an axis) and several push buttons, each one labeled with the type of plot to be generatedwhen the button is clicked with the mouse. The final version of our design will look likeFigure 5.Figure 5: A plotting System“Proceedings of the 2002 American Society for Engineering Education Annual Conference &Exposition Copyright 2002, American Society for Engineering Education”Page 7.385.5As you can see from the figure, we have the option of plotting five different graphs byclicking the push buttons located at the right-hand side of the axis. Also, we have otherbuttons to generate or delete the grid of the figure, to clear the figure and to exit theplotting system. Figure 6 shows the result obtained after clicking the button labeledSombrero (the button runs the script that generates a 3D hat).
Figure 6: The Sombrero graph.Now let’s use the Guide to build this plotting system from the beginning.In order to use the Guide we must start MATLAB and type guide at the command line,as we would when normally working with MATLAB. This command generates a newfigure (a window object) and the Guide Control Panel will appear.Property EditorCallback EditorClick here tocreate a new axesClick here tocreate a frame“Proceedings of the 2002 American Society for Engineering Education Annual Conference &Exposition Copyright 2002, American Society for Engineering Education”Page 7.385.6Figure 7: The control Panel
Fig. 7 shows the Control Panel, and Fig. 8 shows the new figure or window to be usedfor our design.Figure 8: An empty figure or windowThe next step in the design is to position and resize an axes object. We do this byclicking the axes button on the Control Panel and then clicking the figure or window.This process will put an axes object on the figure. By dragging the handles of the axesobject we can resize and position the axes. Figure 9 shows the result of this procedure.Axes ObjectHandlesFigure 9: The Axes object“Proceedings of the 2002 American Society for Engineering Education Annual Conference &Exposition Copyright 2002, American Society for Engineering Education”Page 7.385.7Now, a frame object will be created at the right- hand side of the axes. This frame willserve the purpose of being a container for the graphs push buttons. In the Control Panel(see Figure 7) click the frame object and then click the inside of the window shown in
Fug. 9. Use the handles of the frame to position it in the location you wish. Figure 10shows the outcome of this action. To position a push-button on the window we proceedin a similar fashion: click the push-button on the Control Panel, click the figure to putthe push-button on the window and resize as desired. Figure 11 shows the final positionof the push-button that will be used to put a grid on the graph.FrameAxesFigure 10: A FramePush buttonFigure 11: A push-buttonIn order to change the color of the push-button and to put a caption on top of it, we usethe Property Editor of the Control Panel. This is accomplished by following steps:1. Select the object (the push-button in this case) by clicking it in the figure.2. Click the icon Property Editor on the Control Panel. This will open theProperty Editor for the selected object. The Property Editor lists all theproperties that can be assigned to the selected object.Page 7.385.8“Proceedings of the 2002 American Society for Engineering Education Annual Conference &Exposition Copyright 2002, American Society for Engineering Education”
3. Once the Property Editor is open you can change any of the properties listed.To change color of the selected object, for instance, find the color property,double click it, and a color palette will appear where you can select thedesired color. To change or to add a caption, locate the String property,double click it and type the caption in the entry box of the Property Editor.Figure 12 shows this process.Object browserType the caption hereName of the propertyDouble Click hereFigure 12: The Property EditorFigure 13 shows the resulting figure after using the Property Editor.Page 7.385.9“Proceedings of the 2002 American Society for Engineering Education Annual Conference &Exposition Copyright 2002, American Society for Engineering Education”
Grid On ButtonFigure 13: The Grid On buttonNow that the push-button labeled “Grid on” is in the figure, we must attach to itthe MATLAB code that will be executed when the Grid on button is pressed. Toassign commands to an object perform the following steps:1. Select the object – in this case the Grid on button – which youwant to attach MATLAB code. This can be accomplished byclicking the name of the object in the Object Browser (see Fig.12), or by clicking the object in the GUI window (see Fig. 13).2. In the Control Panel click the Callback Property (Fig. 7). Thiswill open the Callback Editor where you can type the necessarycode. In the case at hand the needed code is simply the line: gridon; Figure 14 shows the Callback Editor after the code is entered.“Proceedings of the 2002 American Society for Engineering Education Annual Conference &Exposition Copyright 2002, American Society for Engineering Education”Page 7.385.10Figure 14: The Callback Editor
To complete the layout presented in Fig. 5, we follow the same principlepresented for the creation and activation of the Grid On button. Each one of thepush buttons in the figure has a diffe rent callback MATLAB code attached to it.For example, the code associated to the button labeled Sin (t)/t is as follows:t [-10.001:.05:10.00];plot(t, sin(t)./t)grid ;Pressing this button with the mouse (when the system is active) produces theoutput shown in Fig. 15.Figure 15: Sin(t)/tSimilarly, the sombrero picture shown in Fig. 6 is easily produced by attachingthe following callback code to the corresponding button:x [-7.5:0.5:7.5];y x;[X,Y] meshgrid(x,y);R sqrt(X. 2,Y. 2 eps);Z sin(R./R);Mesh(X,Y,Z);grid onPage 7.385.11“Proceedings of the 2002 American Society for Engineering Education Annual Conference &Exposition Copyright 2002, American Society for Engineering Education”
V.A Telecommunication ExampleA typical application for the Introduction to Telecommunication course atHudson Valley Community College is the concept of the Amplitude Modulationand its several flavors. For this purpose the author developed a GUI that thestudents use to study AM, Spectrum generation and de-modulation. Figure 16shows the completed GUI.Figure 16: Amplitude ModulationAs you can see, the user selects the message frequency, the carrier frequency, thesampling rate and the number of periods to plot. After pressing the Initializebutton, three types of AM can be simulated, namely Double-Side BandSuppressed Carrier, Double-Side Band Transmission Carrier, and Single-SideBand Suppressed Carrier.In the same figure you can generate thecorresponding spectrum and the result of the de- modulation. Figures 17, 18, and19 show the results for a message of frequency of 2 Hz, a carrier frequency of 50Hz, a sampling rate of 500 Hz, and plot for 2 periods 12 .2In order to develop this application you mu st have the Communication Toolbox of MATLAB.If the reader is i
micheabr@hvcc.edu Abstract In this paper we introduce a tutorial on the use of the Gui de facility of MATLAB. Guide is a development platform composed of several interrelated tools within MATLAB that allows the user to build complex graphical user interfaces that can be used as teaching tools or as automated programs. Several examples related to engineering disciplines are presented. I .