Transcription
International Journal of Recent Advances in Engineering & Technology (IJRAET)PCB Thermal Image Analysis using MATLAB1Jibu Varghese k, 2Tripty Singh, 3Sreyas MohanAmrita School of Engineering, Bangalore, IndiaEmail: 1jibu.v.v@gmail.com, 2tripty singh@blr.amrita.edu, 3sreyaskaithavalappil@gmail.comElectronic component density on current PCB designs ishigher than ever, and with the corresponding increase inpower density, it‘s difficult for a PCB designer to ignorethermal effects. The impetus for doing PCB thermalanalysis is the simple fact that electronic componentpower is derated based on temperature. The higher thetemperature, the lower the electrical performance.Thermal analysis assists the designer in determining theelectrical performance of the components on the PCB andit also helps the designer determine if the component orPCB will burn up due to high temperatures. Thermalanalysis can be as simple as the calculation of the averagetemperature of a PCB, or it can be as complicated as atransient model of an electronics box with multiple PCBsand thousands of components. This article addresses twoof the mysteries of thermal analysis: power dissipationand thermal boundary conditions.Abstract— This paper explains a method for PrintedCircuit Board (PCB) thermal image analysis usingMATLAB. In this method, a train of thermal images of thePCB in chronological order are used as input. Each imagecorresponds to a maneuver or a particular loadingcondition of the PCB. The two parameters used for analysisare peak temperature and maximum area of the peaktemperature which co-relate with the heat dissipationregions. This program provides a MATLAB basedGraphical User Interface (GUI) for the design engineer toselect the most critical image from the lot, see thetemperature jump (in the form of difference image) andview the series of images in the form of a video for quickanalysis.Index Terms— PCB, Thermal Image, Thermal Analysis.I. INTRODUCTIONThermal analysis of an electrical / electronic system is anessential part of the circuit design process. The heavyduty electrical parts need to be designed taking thethermal loading into account. This is all the moreimportant for the Electronic Control Units (ECUs) whichwork in severe environmental conditions like automotiveengine, brake or transmission control units.No matter how meticulous the analyst has been increating the thermal model of the electronics box, PCB,and/or electronic components, the accuracy of thermalanalysis ultimately rests on the accuracy of thecomponent power dissipations provided by the PCBdesigner. In other words: garbage in, garbage out.In many applications weight and physical size are critical,and if the component power dissipations are tooconservative, thermal over-design will result. Thermalover-design refers to changes made in a PCB design inresponse to thermal analysis performed with unrealisticor overly conservative component power dissipations.During thermal analysis, the ECUs are electrically loadedto the extreme in a thermal chamber which is set at thetest ambient temperature. Thermal images are taken usingan Infra Red (IR) camera at different loading instants.These images are then analyzed manually to get thehotspots and heat spread. These inputs are used to do theproper thermal design e,g select appropriate heat-sink,design the required thermal conductivity via, copper inlayand re-routing the high power traces on the PCB.The opposite, and unfortunately more critical problem, isthermal under-design where the component temperaturespredicted by analysis are lower than the actualtemperatures including aerospace, automotive, andconsumer electronics. If your competitor has investedtime in accurately determining component powerdissipations, the PCB thermal analysis will help producea product that is as small, light and efficient as it can be.Avoid inefficient PCB designs with accurate thermalmodeling and component power dissipations.Sometimes the test continues for extended duration likeovernight, and the camera is programmed to take imagesat regular intervals throughout the test duration. Often thenumber of images is in hundreds or even in thousands. Itbecomes very difficult and time consuming to do acomparative analysis of so many images. This paperexplains a MATLAB based tool to analyze all theseimages and draw useful conclusion precisely in muchlesser time.Recent trends in electronic industry are to develop thin,light and miniature form of electronic equipment. LifeISSN (Online): 2347 - 2812, Volume-2, Issue - 3, 201446
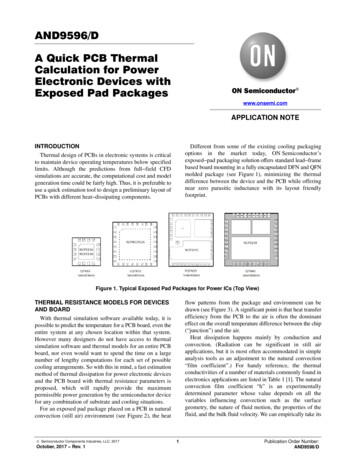
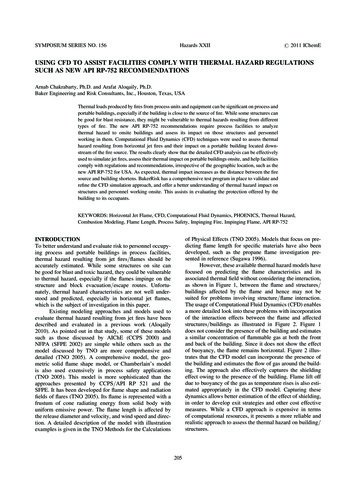
International Journal of Recent Advances in Engineering & Technology (IJRAET)span of electronic component greatly gets reduced due tohigh heat density in small and compact layout whichresults in job insecurity or failure of components. Thisreduces system reliability. This is the reason why thethermal design becomes important.The complexity of PCB manufacturing has increasedenormously, from double-sided straightforward boardswith 100% through-hole technology to highly-complexmulti-layer PCB‘s with mixtures of surface mountchip-on-board and through-hole configurations.Fig 1: The basic components of a thermal imagingsystem.Board layouts have consequently increased in densitywith tighter tolerances and decreased distances betweenelectrical contacts. Possibility of manufacturing defectincreases with increase in complexity.Thermal imaging is a method of improving visibility ofobjects in a dark environment by detecting the objects'infrared radiation and creating an image based on thatinformation.Night vision technologies that are most commonly usedare near-infrared illumination, low-light imaging andthermal imaging. Thermal imaging works inenvironments without any ambient light. Fog, haze andsmoke can be penetrated by thermal imaging just likenear-infrared illumination.Here's a brief explanation of how thermal imaging works:All objects emit infrared energy as a function of theirtemperature. Heat signature is the infrared energyproduced by an object. More radiation is been emitted asthe object becomes hotter. Tiny differences intemperature can be detected using a heat sensor called asthermal camera. Infrared radiation is collected by thedevice from objects in the scene and creates an electronicimage based on temperature differences information.Thermal camera can detect each object distinctly and cangive a distinctive image as the objects that are closer veryrarely have precisely same temperature.Fig. 2: Color – Temperature setting scale of the thermalcamera.Following explains the working of thermal imaging:Grayscale images are obtained using a thermal camera.Cold and hot objects look black and white respectivelywhereas variation between two is indicated by depth ofgray. Different temperature is indicated by differentcolors in some thermal cameras.1.A special lens focuses the infrared light emitted byall of the objects in view.2.The focused light is scanned by a phased array ofinfrared-detector elements. Thermogram is adetailed temperature pattern that is created bydetector elements. Detector array obtains thetemperature information to make the Thermogramwith one-thirtieth of a second. Field of view of thedetector array is the source of information.3.The Thermogram created by the detector elementsis translated into electric impulses.4.The impulses are sent to a signal-processing unit,a chip is used for translating the information fromthe elements into data for the display.5.The signal-processing unit sends the informationto the display. Based on the intensity of theinfrared emission, it shows different colors. TheII. PCB THERMAL IMAGEThe Thermal image of PCBs is taken using IR cameras.As it is taken in the controlled lab environment, theimages are generally of high quality. The color –temperature scale (i.e. which color means how muchtemperature) is set in the camera. The temperature settingused for this analysis is shown here, with color ‗blackrepresenting minimum temperature of -40 oC and color‗white‘ represents the maximum temperature of 120 oC.ISSN (Online): 2347 - 2812, Volume-2, Issue - 3, 201447
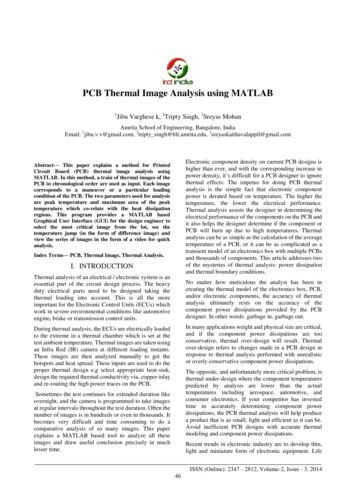
International Journal of Recent Advances in Engineering & Technology (IJRAET)mixture of all these signals from all of theelements creates the image.Fig. 3: Sample thermal image of a PCB with low thermalloading (evident from less white color).Fig. 4: Sample thermal image of a PCB with highthermal loading (as shown in white color).In this project, we have taken a series of 20 thermalimages stored in .png form as shown in figure 4. Theseare the images of the same PCB in different thermal loadconditions. Each image corresponds to a particularelectrical maneuver. The goal of the project is to developa MATLAB based tool to aid the various aspects ofimage analysis.131415161718ISSN (Online): 2347 - 2812, Volume-2, Issue - 3, 201448
International Journal of Recent Advances in Engineering & Technology (IJRAET)an image. Second type is based on dividing an image intoregions that are similar according to some criteria.Histogram Threshold approach comes under this.19Threshold is one of the widely used methods for imagesegmentation. It is useful in differentiating foregroundfrom the background. While choosing a proper thresholdT, the gray level image can be changed to binary image.The converted image contains all of the actual knowledgeabout the position and shape of the objects of interest(foreground). The benefit of obtaining primary a binaryimage is that it reduces the complexity of the data andsimplifies the process of recognition and classification.The general way to convert a gray-level image to a binaryimage is to select a single threshold value (T). Then allthe gray level values below this T will be classified asblack (0), and those above T will be white (1). Thesegmentation problem becomes one of selecting theproper value for the threshold T. A frequent method usedto select T is by analyzing the histograms of the type ofimages that want to be segmented. The ideal case is whenthe histogram presents only two dominant modes and aclear valley (bimodal). In this case the value of T isselected as the valley point between the two modes. Inreal applications histograms are more complex, withmany peaks and not clear valleys, and it rarely gives theproper the value of T. The threshold can be expressed as:20Figure 5: Input thermal images.III. GUIThe GUI of this program provides the three options to theuser to aide in thermal image analysis. Figure 5 shows asnapshot of the GUI developed.T T[x, y, p(x, y), f(x, y]In this application, instead of converting the images intobinary, number of pixels with intensity above thethreshold of 250 for each image is obtained using thecorresponding histogram. This count gives the size of theregion with higher temperature. By comparing the sizesof hot regions between each image the image with largesthot area can be identified and in turn the maneuvercausing this hot region.Figure 6: Snapshot of the GUI developed for thisprogram.The basic needs for analysis process areThe whole set of images are first read by the program andstored in unique variables. As each image is not of equalsize, only the part of image of interest is restored by using‗imcrop‘ function. Since the standard histogram function‗imhist‘ of the MATLAB image processing toolbox doesnot work with RGB images, and the fact that our Regionof Interest (RoI) is only of white color (which representsthe temperature of 120 C and above as per thetemperature scale of our thermal camera), we convert allthe images to grayscale. Our RoI remains white andshades of white. Histogram of each of the images iscalculated and stored. The program then compares eachof the histograms and finds out the image with maximumnumber of pixels of white (band of pixels with intensity 250). This is the worst case image. This image is thendisplayed.1. Find out the maneuver with maximum heat dissipation– worst case analysis.2. The amount of temperature jump between 2 selectedinstances3. Possibility to view the thermal images as a video forvisual inspection.The methods incorporated to achieve all the aboverequirements are described in further chapters.IV. WORST CASE ANALYSISIt is desirable to know which image, and hence maneuver,is the most critical one. That means we need to identifythe image having the maximum area of the peaktemperature. This is achieved by using HistogramThresholding based segmentation of the images.These are some of the results obtained after using wavemenu function.HISTOGRAM THRESHOLDING FOR IMAGE SEGMENTATIONImage segmentation algorithms are based on one of twobasic properties of intensity values discontinuity andsimilarity. Based on abrupt changes in intensity, divideISSN (Online): 2347 - 2812, Volume-2, Issue - 3, 201449
International Journal of Recent Advances in Engineering & Technology (IJRAET)Fig 7: Synthesized image after decomposition.Figure 9: Results of worst case analysis.a. With original set of images 19.png has the maximumhot region and hence the result of worst case analysisdisplays 19.png with total number of pixels as 11496.b. By renaming 19.png as 1.png and vice-versa, the sameimage with same histogram count is display but with thechanged filename.Fig 8: Histogram results and statistics of the image.Results obtained are shown in figure 9.c. By removing 19.png in the original image set and theimage with second largest hot area 20.png is displayedwith the corresponding histogram count.V. TEMPERATURE JUMPAs evident from the scale above, the white color hereshows a temperature of 120ºC, followed by pink and red.If there is just one image, or at max a few images, themanual analysis is easy. But normally we have a largenumber of such images. The consecutive images mayhave a slight temperature jump, or a significant jump,depending on the type of electrical loading.In this case, as the images were of different size, thestandard ―imabsdiff‖ function of the MATLAB imageprocessing
Circuit Board (PCB) thermal image analysis using MATLAB. In this method, a train of thermal images of the PCB in chronological order are used as input. Each image corresponds to a maneuver or a particular loading condition of the PCB. The two parameters used for analysis are peak temperature and maximum area of the peak temperature which co-relate with the heat dissipation regions. This .