Transcription
2021 CAQH INDEXWorking Together:Advances in Automation DuringUnprecedented Times
2 02 1 C AQ H I N D E XWorking Together:Advances in Automation During Unprecedented TimesContentsOverview . . . . . . . . . . . . . . . . . . . . . . . . . . . . . . . . . . . . . . . . . . . . . . . . . . . . . . . . . . . . . . . . . . . . . . . . . . . . . . . . . . . . . . . . . . . . . . . . . . . . . . . . 1Key Findings . . . . . . . . . . . . . . . . . . . . . . . . . . . . . . . . . . . . . . . . . . . . . . . . . . . . . . . . . . . . . . . . . . . . . . . . . . . . . . . . . . . . . . . . . . . . . . . . . . . . . . . . . . . . 4Industry Call to Action . . . . . . . . . . . . . . . . . . . . . . . . . . . . . . . . . . . . . . . . . . . . . . . . . . . . . . . . . . . . . . . . . . . . . . . . . . . . . . . . . . . . . . . . . . . 10Transaction Findings . . . . . . . . . . . . . . . . . . . . . . . . . . . . . . . . . . . . . . . . . . . . . . . . . . . . . . . . . . . . . . . . . . . . . . . . . . . . . . . . . . . . . . . . . . . . 12Eligibility and Benefit Verification . . . . . . . . . . . . . . . . . . . . . . . . . . . . . . . . . . . . . . . . . . . . . . . . . . . . . . . . . . . . . . . . . . . . . . . . . . . . . 13Prior Authorization . . . . . . . . . . . . . . . . . . . . . . . . . . . . . . . . . . . . . . . . . . . . . . . . . . . . . . . . . . . . . . . . . . . . . . . . . . . . . . . . . . . . . . . . . . 17Claim Submission . . . . . . . . . . . . . . . . . . . . . . . . . . . . . . . . . . . . . . . . . . . . . . . . . . . . . . . . . . . . . . . . . . . . . . . . . . . . . . . . . . . . . . . . . . . 20Attachments . . . . . . . . . . . . . . . . . . . . . . . . . . . . . . . . . . . . . . . . . . . . . . . . . . . . . . . . . . . . . . . . . . . . . . . . . . . . . . . . . . . . . . . . . . . . . . . . 23Acknowledgements . . . . . . . . . . . . . . . . . . . . . . . . . . . . . . . . . . . . . . . . . . . . . . . . . . . . . . . . . . . . . . . . . . . . . . . . . . . . . . . . . . . . . . . . . 26Coordination of Benefits . . . . . . . . . . . . . . . . . . . . . . . . . . . . . . . . . . . . . . . . . . . . . . . . . . . . . . . . . . . . . . . . . . . . . . . . . . . . . . . . . . . . . 28Claim Status Inquiry . . . . . . . . . . . . . . . . . . . . . . . . . . . . . . . . . . . . . . . . . . . . . . . . . . . . . . . . . . . . . . . . . . . . . . . . . . . . . . . . . . . . . . . . . 30Claim Payment . . . . . . . . . . . . . . . . . . . . . . . . . . . . . . . . . . . . . . . . . . . . . . . . . . . . . . . . . . . . . . . . . . . . . . . . . . . . . . . . . . . . . . . . . . . . . . 33Remittance Advice . . . . . . . . . . . . . . . . . . . . . . . . . . . . . . . . . . . . . . . . . . . . . . . . . . . . . . . . . . . . . . . . . . . . . . . . . . . . . . . . . . . . . . . . . . 36Overall Key Metrics . . . . . . . . . . . . . . . . . . . . . . . . . . . . . . . . . . . . . . . . . . . . . . . . . . . . . . . . . . . . . . . . . . . . . . . . . . . . . . . . . . . . . . . . . . . . . . 39Cost Savings Opportunity Tables . . . . . . . . . . . . . . . . . . . . . . . . . . . . . . . . . . . . . . . . . . . . . . . . . . . . . . . . . . . . . . . . . . . . . . . . . . . . . . . . . 44Methodology . . . . . . . . . . . . . . . . . . . . . . . . . . . . . . . . . . . . . . . . . . . . . . . . . . . . . . . . . . . . . . . . . . . . . . . . . . . . . . . . . . . . . . . . . . . . . . . . . . . 48Introduction . . . . . . . . . . . . . . . . . . . . . . . . . . . . . . . . . . . . . . . . . . . . . . . . . . . . . . . . . . . . . . . . . . . . . . . . . . . . . . . . . . . . . . . . . . . . . . . . . 48Recruitment . . . . . . . . . . . . . . . . . . . . . . . . . . . . . . . . . . . . . . . . . . . . . . . . . . . . . . . . . . . . . . . . . . . . . . . . . . . . . . . . . . . . . . . . . . . . . . . . . 48Data Collection . . . . . . . . . . . . . . . . . . . . . . . . . . . . . . . . . . . . . . . . . . . . . . . . . . . . . . . . . . . . . . . . . . . . . . . . . . . . . . . . . . . . . . . . . . . . . . 48Data Analyses . . . . . . . . . . . . . . . . . . . . . . . . . . . . . . . . . . . . . . . . . . . . . . . . . . . . . . . . . . . . . . . . . . . . . . . . . . . . . . . . . . . . . . . . . . . . . . . 52Limitations . . . . . . . . . . . . . . . . . . . . . . . . . . . . . . . . . . . . . . . . . . . . . . . . . . . . . . . . . . . . . . . . . . . . . . . . . . . . . . . . . . . . . . . . . . . . . . . . . . 57Acknowledgements . . . . . . . . . . . . . . . . . . . . . . . . . . . . . . . . . . . . . . . . . . . . . . . . . . . . . . . . . . . . . . . . . . . . . . . . . . . . . . . . . . . . . . . . . . . . . 58CAQH, a non-profit alliance, is the leader in creating shared initiatives to streamline the business of healthcare. Through collaborationand innovation, CAQH accelerates the transformation of business processes, delivering value to providers, patients and health plans.Visit www.caqh.org and follow us on Twitter: @caqh. 2022 CAQH All rights reserved2 2021 CAQH Index
OverviewWhile the coronavirus (COVID-19) surged through the U.S. during 2020straining health systems,1,2 health plans and providers worked together toconduct administrative functions related to millions of business transactions,many from home offices. Data from the 2021 CAQH Index found that,of the 391 billion spent on administrative complexity in the UnitedStates healthcare system,3 42 billion, or 11 percent, is spent conductingadministrative transactions tracked by the CAQH Index. Of the 42 billion,the industry can save 20 billion, or 48 percent of existing annual spend, bytransitioning to fully electronic transactions. While the industry has alreadyavoided 166 billion annually by automating administrative transactions, totalspend continues to rise and opportunities to reduce costs exist.This annual report, the ninth produced by CAQH, measures national progressin reducing the costs associated with conducting administrative transactions inthe healthcare industry for medical and dental plans and providers. The CAQHIndex tracks the adoption of Health Insurance Portability and Accountability Act(HIPAA) mandated transactions, as well as other administrative transactionsrelated to verifying insurance coverage, obtaining authorization for care,submitting a claim, attaching supplemental information and sending andreceiving payments. The report this year is unique as it measures adoption,volume and cost savings during a national pandemic — COVID-19 — anunprecedented event that significantly impacted the healthcare industryand its administrative functions.1 “The Impact of the COVID-19 Pandemic on Outpatient Visits: A Rebound Emerges,” The Commonwealth Fund, May 19 2020, /apr/impact-covid-19-outpatient-visits.2 George Miller, Corwin Rhyan, Ani Turner, Katherine Hempstead, “COVID-19 Shocks The US Health Sector: A Review Of Early Economic Impacts,” Health Affairs Blog,December 16, 2020, 1214.543463/full/.3 “Projected,” Health Expenditure Data, Centers for Medicare & Medicaid Services Website, last modified December 1, 2021, ExpendData/NationalHealthAccountsProjected. Healthcare administrative complexities includeall national health expenditures (NHE), less investment (research, structures and equipment) and public health outlays by federal and state governments.1 2021 CAQH Index
TransactionsThe 2021 CAQH Index collected data on the following nine administrative transactions.Eligibility andBenefit VerificationAn inquiry from aprovider to a healthplan or from onehealth plan to anotherto obtain eligibility,coverage or benefitsassociated with theplan and a responsefrom the health plan tothe provider. Does notinclude referrals. HIPAATransaction Standard:ASC X12N 270/271.Prior AuthorizationA request from aprovider to a health planto obtain authorizationfor healthcare servicesor a response froma health plan for anauthorization. Does notinclude referrals. HIPAATransaction Standard:ASC X12N 278.Claim SubmissionA request to obtainpayment or transmissionof encounter informationfor the purpose ofreporting delivery ofhealthcare services.HIPAA TransactionStandard: ASC X12N 837.AttachmentsAdditional informationsubmitted with claimsfor payment, claimappeals or priorauthorization, suchas medical records tosupport a claim or toexplain the need for aprocedure or service.Transaction Standards:ASC X12N 275, HL7CDA.Coordination ofBenefitsClaims that are sentto secondary payerswith explanation ofpayment informationfrom the primarypayer to determineremaining paymentresponsibilities. HIPAATransaction Standard:ASC X12N 837.Claim Status InquiryAn inquiry from aprovider to a healthplan to determine thestatus of a healthcareclaim or a responsefrom the health plan.HIPAA TransactionStandard: ASC X12N276/277.Claim PaymentAn electronic fundstransfer (EFT) froma health plan’s bankto a provider’s bank;including paymentand data specific tothe payment. HIPAATransaction Standard:NACHA CorporateCredit or Deposit Entrywith Addenda Record(CCD ).Remittance AdviceThe transmission ofexplanation of benefitsor remittance advicefrom a health plan toa provider explaininga payment. HIPAATransaction Standard:ASC X12N 835.AcknowledgementsA health plan’sresponse to aprovider or provider’sclearinghouse that theyreceived informationfrom the provider orclearinghouse; or aconfirmation receivedby a provider that theinformation shared witha health plan has beenrejected or accepted.Transaction Standard:ASC X12N 277CA/999.Key Terms and Financial MetricsBelow are the primary metrics reported for each transaction in the 2021 CAQH Index report. Adoption rates arecalculated using only medical and dental plan reported volumes.KEY TERMSAdoptionThe degree to whichmedical and dentalplans and providerscomplete transactionsusing fully electronic,partially electronic ormanual modes.2 2021 CAQH IndexEstimated VolumeThe number of fullyelectronic, partiallyelectronic and manualtransactions reportedby medical and dentalplans and providersweighted to a nationallevel.Fully ElectronicTransactions conductedusing a HIPAAmandated standard,unless otherwisespecified.Partially ElectronicTransactions conductedusing web portalsand interactive voiceresponse (IVR)systems.Fully Manual (Manual)Transactions requiringend-to-end humaninteraction such astelephone, mail, fax andemail.
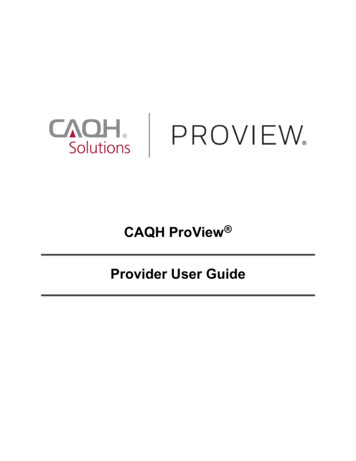
FINANCIAL METRICSCost Per TransactionThe labor costs (e.g., salaries, wages,personnel benefits and related overheadcosts) associated with fully electronic,partially electronic and fully manualtransactions as reported by medicaland dental plans and providers. Costsinclude the labor time required toconduct the transaction, not the timeand cost associated with gatheringinformation for the transaction andfollow-up. Costs do not include systemcosts (e.g., maintaining, building orbuying software or other equipment).Estimated SpendThe amount that medicaland dental plans and providersspend conducting a transactionin total and by modality.Cost Savings OpportunityThe cost savings that couldbe achieved by switching theremaining partially electronic andfully manual transactions to fullyelectronic transactions.Cost AvoidedThe amount that medical anddental plans and providershave saved by not conductingtransactions using partiallyelectronic or fully manual modes.Time Savings OpportunityThe time that providers could saveby switching the remaining partiallyelectronic and fully manual timeto conduct a transaction to a fullyelectronic time.The Administrative WorkflowA medical or dental encounter with a provider encompasses a series of administrative tasks that begins with a patientscheduling a visit and ends with a payment for the healthcare services being provided. The CAQH Index collectsdetailed information from health plans and providers on how specific administrative transactions are conducted(modes studied include fully electronic, partially electronic and manual), how many are conducted (volume) and thecost and time to process each transaction.By tracking automation, the industry can work together to identify inefficiency within the workflow and target areasfor improvement with concerted efforts to reduce the cost and time associated with certain administrative tasks.Specific to this year, the CAQH Index delivers insights into the impact COVID-19 had on administrative ris ScheduledProviderSubmits ClaimHealth PlanAdjudicatesClaimProvideris Paid byHealth PlanClaim Status InquiryRemittance AdviceClaim SubmissionAttachmentsEligibility and BenefitProvider Referral*VerificationCoordination of BenefitsClaim PaymentPrior AuthorizationAcknowledgementsNote: This diagram illustrates the administrative workflow in its simplest form. In practice, some transactions may occur multiple times or in multiple steps and be triggered by other events.*Due to a low volume of data collected, the 2021 CAQH Index was unable to calculate benchmarks.3 2021 CAQH Index
KEY FINDINGSIn 2020, COVID-19 challenged the healthcare industry as the number of infectedpeople increased and health plans and providers worked together to navigatestressed healthcare systems, evolving policies and changing social behaviors. Overallutilization and administrative transaction volume decreased in the early monthsof the pandemic due to social distancing and a temporary halt to non-emergencyservices.4,5,6 These volume losses were somewhat offset by the rise in telemedicineservices which allowed for virtual patient visits and follow-up appointments.As telemedicine services expanded, new policies and requirements were implemented which introduced additionaland varied administrative complexity to health plans and providers, often resulting in costly and time-consumingmanual work that occurred outside the workflow. Dental plans and providers, while not as impacted by telemedicinepolicies and requirements due to the in-person nature of many dental services, struggled with office closures andfinancial losses as a result of lower utilization.7,8,9 For many plans and provider administrative staff, COVID-19 forced theuse of technology and automated transactions as staff began working from home and did not have access to officefaxes, call centers and mail facilities.While the healthcare industry continues to grapple with the impact of COVID-19 on utilization, transaction volumeand workflows, the industry needs to continue to work together to identify gaps and opportunities in processesand systems. Reducing administrative burden while focusing on patient care in a post-COVID-19 era will requirestakeholders to collaborate and together navigate new policies, requirements and norms.4 “Healthcare Utilization During a Pandemic: How COVID-19 Impacted Administrative Transactions,” CAQH, May 2021, e-brief.pdf.5 Cynthia Cox, Rabah Kamal, Daniel McDermott, “How Have Health Care Utilization and Spending Changed So Far During the Coronavirus Pandemic?” Kaiser FamilyFoundation, March 23, 2021, nged-so-far-during-thecoronavirus-pandemic/.6 “Social Distancing,” Centers for Disease Control and Prevention, November 17, 2020, getting-sick/social-distancing.7 Fazal Ghani, “Covid-19 Outbreak — Immediate and long-term impacts on the dental profession,” Pakistan Journal of Medical Sciences, May 2020, 54/.8 “COVID-19: Economic Impact on Dental Practices Week of August 10 Results,” Health Policy Institute and American Dental Association, accessed November 18, WlJWDFFU01IdmNDUlVO.9 Kamyar Nasseh, Marko Vujicic, “Modeling the Impact of COVID-19 on U.S. Dental Spending — June 2020 Update,” Health Policy Institute and American Dental Association, June 2020, ef 0620 1.pdf?rev a898955484c64f34bf48c08df3794f0d&hash 56716D45E46E155CE5D571622F1903CB.4 2021 CAQH Index
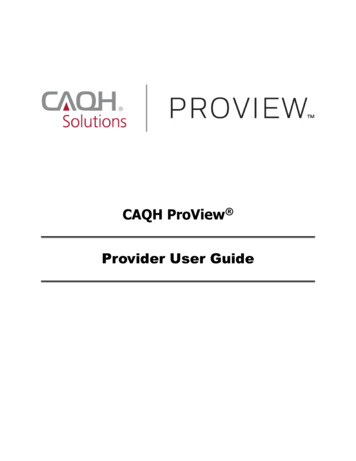
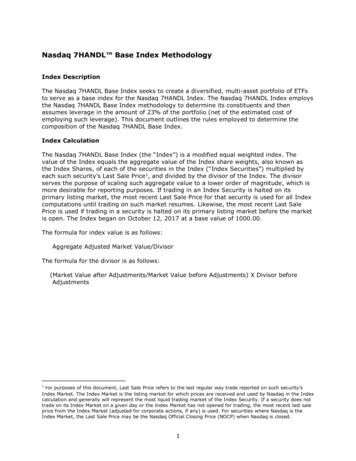
KEY FINDINGSADOPTIONAdoption of electronic transactions improved for mostmedical transactions except attachments, coordinationof benefits and claim status inquiry and improved forall dental transactions. As COVID-19 forced people towork from home and practice social distancing, healthplan and provider staff did not have access to officefax machines and many health plan mail rooms andcall centers were closed temporarily. Because of this,staff relied more on the use of electronic transactionsto conduct administrative transactions.percentage pointsThe average increase inadoption across the medical anddental industries.Medical Plan Adoption of Fully Electronic Administrative Transactions2017-2021 CAQH 202021Claim StatusInquiryClaim f BenefitsCoordinationof /RN/REligibilityand BenefitEligibilityVerificationand BenefitVerificationN/R Not Reported6% 6%N/RN/R20%20%22%22%21%21%8% DICAL ADOPTIONMEDICAL ADOPTIONRemittanceAdviceRemittanceAdviceDental Plan Adoption of Fully Electronic Administrative Transactions2017-2021 CAQH IndexN/R Not Reported5 2021 CAQH %11%17%19%Eligibility andBenefit %84%54%46%51%64%71%DENTAL ADOPTIONClaim StatusInquiryClaimPaymentRemittanceAdvice2021
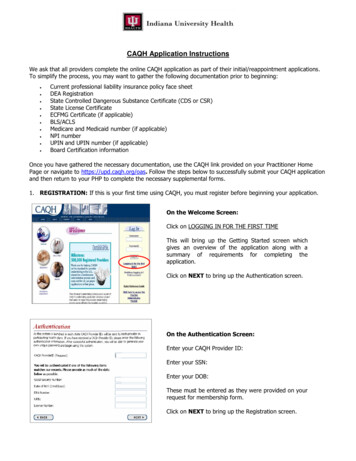
KEY FINDINGSVOLUMEOverall administrative transaction volume decreased during 2020. Both themedical and dental industries experienced drops in utilization as COVID-19impacted healthcare policies, regulations, resources and social behaviors.decrease in overallmedical transaction volumedecrease in overalldental transaction volumeDespite the drop in overall transaction volume, the proportion of electronic volumecontinues to increase and accounts for the highest percentage of total volume for both the medicaland dental industries, at 81 percent and 48 percent respectively.Medical and Dental Industry Estimated National Volume2013-2021 CAQH Index (in billions)DENTAL VOLUMEMEDICAL 2021Index2013IndexNote: From year to year reported transactions may change due to low volume collected.6 2021 CAQH 2019Index
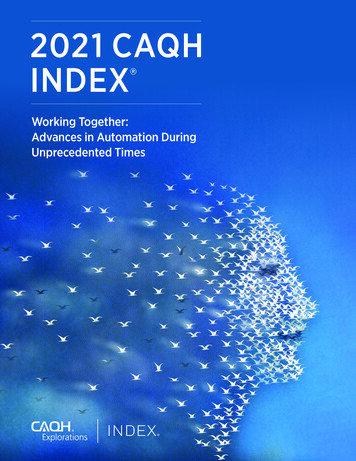
KEY FINDINGSSPENDDespite the decrease in overall medical transaction volume and growth inelectronic adoption, total annual medical spend increased (12%) as manualtransactions required more intensive intervention from providers to ensure thatnewly implemented requirements and codes were executed correctly, and thatpatient medical records were current and accurate. Conversely, dental spendingdecreased due to lower utilization often resulting in office closures. 12% to-23% toThe amount medicalspending increasedThe amount dentalspending decreasedMedical and Dental Industry Estimated National Spend2013-2021 CAQH Index (in billions)DENTAL SPENDMEDICAL SPEND 37.4 6.6 34.1 30.5 5.7 33.4 5.1 24.1 4.4 17.2 14.1 16.7 018Index2019Index2020Index2021Index2013IndexNote: From year to year reported transactions may change due to low volume collected.7 2021 CAQH 2019Index2020Index2021Index
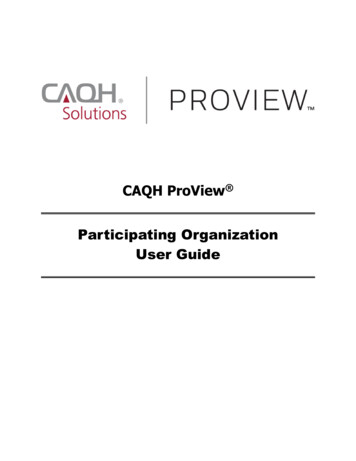
KEY FINDINGSCOST SAVINGSOPPORTUNITIESThe medical industrycost savings opportunityincreased toThe cost savings opportunity for the medical industryincreased (32%) due to higher costs for manualtransactions and lower costs for electronic transactions —the gap between electronic costs and manual costs pertransaction continues to increase. For the second year ina row, the cost savings opportunity declined (13%) for thedental industry as adoption increased.The dental costsavings opportunitydecreased toMedical and Dental Industry Estimated National Cost Savings Opportunity2013-2021 CAQH Index (in billions)DENTAL COST SAVINGS OPPORTUNITYMEDICAL COST SAVINGS OPPORTUNITY 17.6 3.4 2.6 13.3 11.1 8.2 8.3 8.52013Index2014Index2015Index 9.42016Index2017Index 9.8 9.92018Index2019Index2020Index 3.0 2.0 17Index 2.62018Index2019Index2020Index2021IndexMedical Industry Average Cost per Transaction for Electronic and Manual Transactions2013-2021 CAQH IndexElectronicElectronic 6.00 6.00 4.00 4.00 5.3 5.3 3.3 3.3 4.0 4.0 4.0 4.0 3.6 3.6 3.4 3.4 3.4 3.4 0.59 0.59 0.61 0.61 0.49 0.49 0.53 dexIndex20212021IndexIndex 2.9 2.9 3.0 3.0 0.21 0.21 0.25 0.25 0.37 0.37 0.33 0.33 0.39 dexIndex20162016IndexIndex20172017IndexIndexTHE GAP ISINCREASING 2.00 2.00 – –ManualManualNote: From year to year reported transactions may change due to low volume collected.8 2021 CAQH Index
KEY FINDINGSADMINISTRATIVEWORKFLOWWhile COVID-19 touched all healthcare professionals, the pandemic impacted themedical and dental administrative workflows differently.AutomationAs remote work increased, many medical and dental staff became more reliant on the use of electronictransactions to conduct business. Staff no longer had access to resources used to conduct manualtransactions. Because of this, both industries saw an increase in electronic adoption.UtilizationPolicies developed by federal and state entities to curb the spread of COVID-19 resulted in lowerutilization for both industries as people delayed, or went without, medical care.10 In general,lower utilization led to lower transaction volumes. Smaller dental practices were hit particularly hardby lower utilization as many offices were forced to close for several months or close permanently.11TelemedicineFor the medical industry, the loss in volume was counterbalanced by the increase in telemedicine.Telemedicine expanded access to care while reducing exposure to the virus for staff and patients. Healthplans and providers worked together to understand and confirm new requirements and varying codesaround telemedicine which often resulted in costly and timely phone calls and manual work. And whilemanual volume dropped, manual transactions became more expensive, increasing overall spend and thecost savings opportunity.SpendAlthough electronic adoption and volume increased for both industries, the spend associated withconducting administrative transactions varied. While the dental industry saw a drop in spend, themedical industry experienced an increase in spend as it dealt with more complicated factors related toCOVID-19.10 Cynthia Cox, Rabah Kamal, Daniel McDermott, “How Have Health Care Utilization and Spending Changed So Far During the Coronavirus Pandemic?” Kaiser FamilyFoundation, March 23, 2021, nged-so-far-during-thecoronavirus-pandemic/.11 “COVID-19: Economic Impact on Dental Practices Week of August 10 Results,” Health Policy Institute and American Dental Association, accessed November 18, WlJWDFFU01IdmNDUlVO.9 2021 CAQH Index
Industry Call to ActionAs the industry continues to understand how COVID-19 has affected the business of healthcare, support of new andevolving processes and policies is needed to help navigate changes and challenges the industry may face. During2020, health plans and providers relied more on automated processes to conduct administrative transactions asoffices were closed and many administrative staff were working from home. The pandemic also spurred an increasein telemedicine, which benefited patient and provider interactions but resulted in additional manual work for healthplans and providers as they dealt with new, varied and changing codes and requirements.Findings from this report indicate how electronic adoption, transaction volume, spend and cost savings opportunitieswere impacted by COVID-19 for the medical and dental industries. While both industries experienced a drop intransaction volume due to lower utilization, the impact on spend and cost savings opportunities varied by industrydue to costs associated with conducting manual and electronic transactions. In order to expand on progressmade in automation and respond to the current and changing needs and challenges related to telemedicine andinteroperability, CAQH offers the following actions to the industry:Capitalize and Expand on AutomationDuring the pandemic, the healthcare industry automated more administrative tasks as health plans and providersdealt with social distancing regulations, modified office conditions and efforts to reduce administrative burden. Forsome, the cost to conduct electronic transactions decreased as use increased and processes became more efficient.While electronic costs decreased for many transactions, manual costs increased. Medical providers were challengedwith establishing new workflows to address COVID-19 challenges and telemedicine resulting in costly and timeconsuming manual tasks that fell outside of their current workflows.To help reduce administrative burden and costs and expand on automation, use of electronic transactions shouldcontinue to be encouraged and promoted while considering how to integrate new processes into systems andworkflows. Understanding how health plans and providers transitioned to more automated transactions duringCOVID-19, and the challenges and benefits associated with this, is needed to address pain points, update transactionsand keep the momentum moving forward to continually increase the level of automation.Adapt Processes to Support TelemedicineCOVID-19 brought about a rise in telemedicine as providers and patients sought ways to safely access and obtaincare12,13 while minimizing transmission of the virus. Telemedicine, while experiencing challenges,14,15 was viewed byproviders and patients as a benefit during the peak of the pandemic that will likely continue into the future.1612 Lisa M. Koonin, Brooke Hoots, Clarisse A. Tsang, Zanie Leroy, Kevin Farris, Tilman Jollyend, Peter Antall, Bridget McCabe, Cynthia B.R. Zelis, Ian Tong, Aaron M. Harris,“Trends in the Use of Telehealth During the Emergence of the COVID-19 Pandemic — United States, January–March 2020,” Morbidity and Mortality Weekly Report,Centers for Disease Control and Prevention, October 30, 2020, m.13 Eric Wicklund, “AMA Survey Charts Explosive Growth of Telehealth Services in 2020,” Telehealth News, mHealth Intelligence, September 15, 2021, 20.14 “Using Telehealth Services,” COVID-19, Centers for Disease Control and Prevention, June 10, 2020, health.html.15 David Velasquez, Ateev Mehrotra, “Ensuring The Growth Of Telehealth During COVID-19 Does Not Exacerbate Disparities In Care,” Health Affairs, May 8, 2020, 0505.591306/full/.16 Oleg Bestsennyy, Greg Gilbert, Alex Harris, and Jennifer Rost, “Telehealth: A quarter-trillion-dollar post-COVID-19 reality?” Healthcare Systems & Services, McKinsey &Company, July 9, 2021, r-trillion-dollar-post-covid-19-reality.10 2021 CAQH Index
To date, federal and state regulations have been put in place to support and facilitate the use of telehealth.17,18,19In alignment with industry efforts, CAQH CORE participants drafted operating rule requirements for eligibility andbenefit verification (X12 270/271) that support service type codes related to telemedicine coverage and use. Includingthese details will help health plans and providers more readily identify which services or benefits are covered undertelemedicine, helping reduce the time and effort spent on verifying this information.In addition to developing regulations and operating rules around the use of telemedicine, health plans and providersshould examine systems and procedures to ensure that secure infrastructure is in place to support existing andemerging requirements around the exchange of patient information. Staff should be made aware of policies andprotocols for using telehealth services as they may impact patient encounters and administrative work surroundingthe encounter. While the prevalence of telemedicine in future years is currently unknown, it has proven to be a usefuland convenient tool for providers and patients in the delivery of care.Ensure Interoperability Across SystemsTo help support the progress made on electronic adoption and the use of telehealth services, the industry needsto continue to promote interoperability across systems. Many government and industry initiatives are underway toupdate and create standards and operating rules to ensure that industry interoperability needs are met.20,21,22,23,24,25Ove
conduct administrative functions related to millions of business transactions, many from home offices. Data from the 2021 CAQH Index found that, of the 391 billion spent on administrative complexity in the United States healthcare system,3 42 billion, or 11 percent, is spent conducting administrative transactions tracked by the CAQH Index.