Transcription
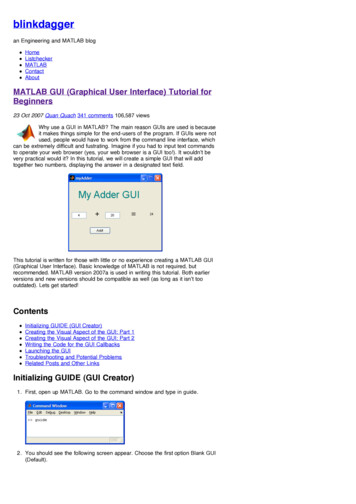
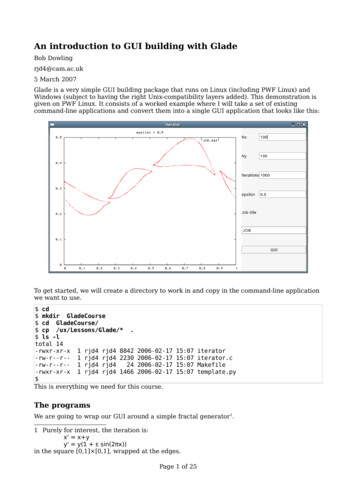
An introduction to GUI building with GladeBob Dowlingrjd4@cam.ac.uk5 March 2007Glade is a very simple GUI building package that runs on Linux (including PWF Linux) andWindows (subject to having the right Unix-compatibility layers added). This demonstration isgiven on PWF Linux. It consists of a worked example where I will take a set of existingcommand-line applications and convert them into a single GUI application that looks like this:To get started, we will create a directory to work in and copy in the command-line applicationwe want to use. cd mkdir GladeCourse cd GladeCourse/ cp /ux/Lessons/Glade/* . ls -ltotal 14-rwxr-xr-x 1 rjd4 rjd4 8842 2006-02-17-rw-r--r-- 1 rjd4 rjd4 2230 2006-02-17-rw-r--r-- 1 rjd4 rjd424 2006-02-17-rwxr-xr-x 1 rjd4 rjd4 1466 2006-02-17 This is everything we need for this iletemplate.pyThe programsWe are going to wrap our GUI around a simple fractal generator1.1 Purely for interest, the iteration is:x' x yy' y(1 ε sin(2πx))in the square [0,1] [0,1], wrapped at the edges.Page 1 of 25
An introduction to GUI building with GladeThis represents the data generation program that you will have written or inherited that doesyour science. It takes a number of arguments on the command line that we want to set via ourGUI. It generates a set of data points that need to be plotted. ./iterator 100 100 1000 0.49 49.dat ls -ltotal 11111rjd4rjd4rjd4rjd4rjd4rjd4 180000 2006-02-17 15:11 49.datrjd48842 2006-02-17 15:07 iteratorrjd42230 2006-02-17 15:07 iterator.crjd424 2006-02-17 15:07 Makefilerjd41466 2006-02-17 15:07 template.py The iterator program takes four arguments. The first two set up how many points we startwith, by defining an X by Y grid where the first two numbers identify X and Y. The thirdargument specifies how many iterations each point gets. The final argument is a parameter,ε, which defines the nature of the iterated function. It's typically this parameter we changemost often. Part of our task in writing the GUI will be to make it easy to enter these fourparameters without having to remember which order they come in and without having toretype values that don't change between runs.The data now needs to be plotted. We will use a simple graphing program called gnuplot forthis. Again, you don't need to know the details of gnuplot's operation. The whole point of whatwe are doing is to hide all this. The details of gnuplot syntax are the sort of thing you getright once and never look at again. gnuplotG N U P L O TVersion 4.0 patchlevel 0 gnuplot set terminal pngTerminal type set to 'png'Options are 'small color picsize 640 480 'gnuplot set style data dotsgnuplot set title "epsilon 0.49"gnuplot set output "49.png"gnuplot plot "49.dat"gnuplot exit ls -ltotal rwxr-xr-x111111rjd4rjd4rjd4rjd4rjd4rjd4rjd4 180000 2006-02-17 15:11 49.datrjd44261 2006-02-17 15:13 49.pngrjd48842 2006-02-17 15:07 iteratorrjd42230 2006-02-17 15:07 iterator.crjd424 2006-02-17 15:07 Makefilerjd41466 2006-02-17 15:07 template.py Again, the details are mostly irrelevant to the task at hand, but what those gnuplotinstructions meant was this:Page 2 of 25
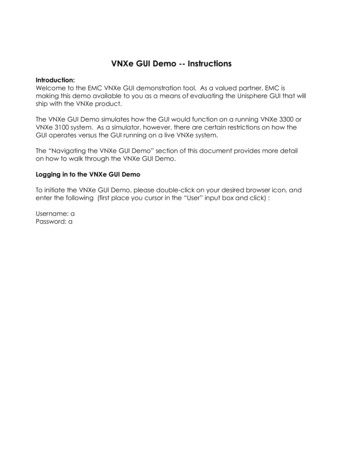
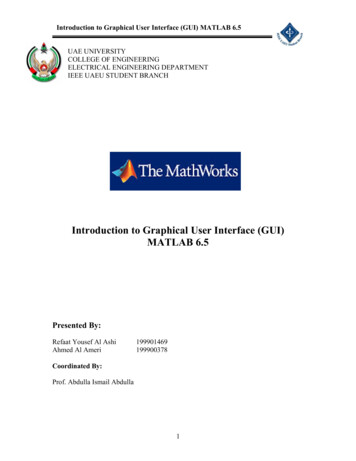
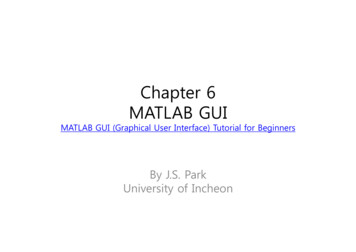
An introduction to GUI building with Gladeset terminal pngset style data dotsDefine the output as being in PNG graphics format.Specify that the individual points should be plotted and notjoined together with lines.Set the legend in the picture created.set title "epsilon 0.49"Specify the graphics file created.set output "49.png"Specify the input file and give the instruction to plot its data.plot "49.dat"exitLeave gnuplot.What matters from our perspective is that we will want to get the user's parameter from theGUI into (at least) the title of the image created.We can see the image created with the eog graphics viewer: eog 49.pngwhich causes it to appear like this:Note that there is no attempt to generate the graphics from the primary calculating program.It's generally bad practice to try to squeeze all the functionality into a single program. It's amuch better idea to write programs to do just one task and then to combine these programseither in a shall script (for command line use) or in a GUI, which is what we will do here.We will want the GUI to let us enter the four parameters and the file names used. We willwork to the convention that if the GUI is given the name “foo” then the data file generated bythe calculation should be “foo.dat” and the graphics file generated should be “foo.png”.Designing the GUIFirst we must design the GUI. It is typically better to use a plain sheet of A4 paper to sketchin than any computerized system. We need to decide on the elements it must have and roughlywhere they should go.We need the following: number of elements in the X direction for the initial points, number of elements in the Y direction for the initial points, number of iterations to put each point through, value of epsilon, somewhere to display the resulting image, andPage 3 of 25
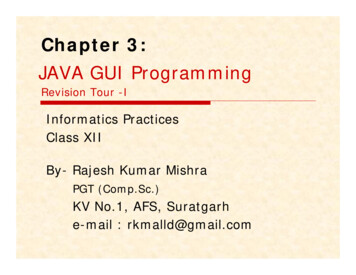
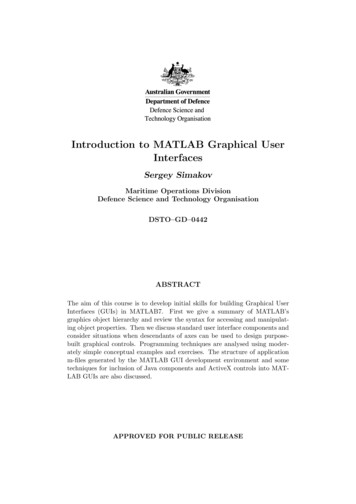
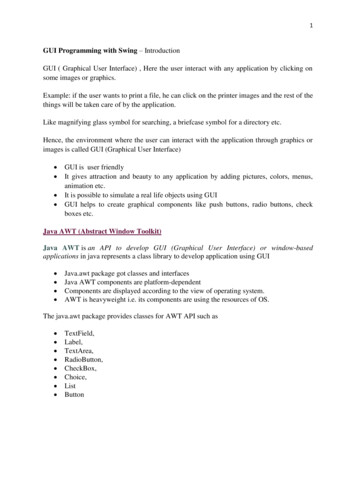
An introduction to GUI building with Glade somewhere to specify a file name or job name for storing the data.My sketched design looks like this:Note that it's hand drawn, with no attempt at beauty, artistry, or even straight lines.The GUI builder works with a set of grids or tables possibly with one table sitting inside asingle element of an outer table. So next I mark up my sketch with some construction lines (inred) to indicate how this table will work. Mine is a simple GUI so a single table suffices. Notethat the rows and columns don't all have to be the same size.Page 4 of 25
An introduction to GUI building with GladeAnd that's the sum total of the design. Next I build it.Building the GUIFirst we must launch the program. The command to do this is glade-2. (There was a version 1of glade which is incompatible with version 2. The command is named this way to make sureyou never get version 1 by mistake. glade-2 & Launching Glade creates three windows: the main Glade window, a “properties” window and a“palette” window. We start with the main window and click “New” to start a new GUI buildingproject. It asks us whether we want to build a “GTK ” project or a “GNOME project”. At thesimple level where we will be working the difference is irrelevant. We will select “GTK ”because it is a little simpler and it doesn't make any real difference to us.Once we make this selection the contents of the palette window stop being greyed out and arenow available for us to use. The palette contains all the bits we build our GUI from.Page 5 of 25
An introduction to GUI building with GladeIf you move the mouse over the various items show in the palette a small pop up will give itsname. These are the names we will be using throughout this course.Main windowWe need a main window to contain our GUI.To do this, simply click on the window icon which is top left in the palette.A number of things will happen.1. A new window with title “window1” will appearPage 6 of 25
An introduction to GUI building with Glade2. The main window will gain a line listing window1.3. The properties window will stop being greyed out and will show the mostly nonexistent properties of window1, with the “Widget” tab active.Page 7 of 25
An introduction to GUI building with GladeWe will only address the properties that we plan to change. At this point, the only property wewant to change is the window's title from the rather bland “window1” to something thatreflects our application: “iterator”. We will change the text in the properties windowcorresponding to the “Title:” entry. There's no need to hit Return, though it won't do anyharm. As you type you should see the title of the window change before your eyes.Splitting the windowNext we need to split the window into the cells that will be occupied with the variouscomponents of the GUI. According to our diagram we need three columns (with the first muchwider than the other two) and eight rows.To get a table first click on the table icon in the palette to say that we want a table.Then click into the window to say where we want it.A dialogue box asking for details of the table will appear. It defaults to having threerows and three columns. Change this to eight rows and three columns. Then click OK.The GUI building window will develop a 8 3 table and the properties window will change toPage 8 of 25
An introduction to GUI building with Gladedescribe the table's properties.Now all we have to do is to add items to the table, remembering that the image has to span alleight rows and the first column will have to be very wide.Saving our workIt's important to remember to save work regularly. This applies as much to GUI developmentas it does to writing dissertations. Click the “Save” icon on the main window.Instead of just a normal “save as ” dialogue this actually launches an “options” window.Don't be worried; the top of the options window sets the names of the files and thedirectories. Change the directory to be GladeCourse. You will find that quite a few other filenames will change in sync. In this example I am giving my project the name “Iterator”.Click “OK” to confirm.Adding the labelsWe will start with the easy ones. In the second column, the top four table cells need to havesimple text entries added to them, “Nx”, “Ny”, “Iters.” and “epsilon”. These are called“labels”.Page 9 of 25
An introduction to GUI building with GladeTo add the “Nx” label, click the label icon in the palette and then the top middle cell ofthe table.Two things happen. The window changes to reflect the addition of a new label and theproperties window shows the properties of the new label.We are going to change one property of this label: the text of the label itself. The propertieswindow is showing a text area labelled “Label:”. We will change that to the text we want inthe label: “Nx”. Again, there is no need to hit Return, and if you do you will just add a line intothe label itself.Next we do the same for “Ny”, “iterations” and “epsilon”.Finally among the labels we have to create one reading “Job name:” for the file saving. Thislabel has to span two columns. We start by adding the label to the left hand cell of the pair. (Ifit was spanning rows as well as columns we would add it to the top left cell of the set.)To change it to span two columns we turn our attention to the properties window and switchtab from “Widget” to “Packing”.Page 10 of 25
An introduction to GUI building with GladeIn the data under the “Packing” tab we see an entry “Col Span:”. This dictates how manycolumns the item span and we will change this to 2. We do have to hit Return for theseentries. The GUI window lurches over a bit as the table's cells resize, but we will deal withthat later. For the time being we have a label spanning columns 2 and 3.And that completes our labels.Text entryFor each of these labels we need an area where the user types in some data. We need integervalues for Nx, Ny and iterations, a floating point number for epsilon, and some text for jobnames.For this we use a “text entry” widget.As usual, we click on the text entry icon in the palette and then in the cell where wewant to place it. We start with the text entry next to the “Nx” label.Page 11 of 25
An introduction to GUI building with GladeThis text entry widget starts with the name “entry1”. Up to now we have not botheredchanging any widgets' names because we won't have to deal with them directly and don'treally care what they're called. These widgets we will interact with because we want to suckdata out of them. So we'll give them sensible names. We'll call this one “nx” by replacing“entry1” with “nx” in the “Name:” field. We also have to give it some initial text which weenter into the “Text:” field. We'll use a default value of 100.We will repeat this process for “ny”, “iters”, “epsilon” and “jobname”. The job name textentry widget can be spanned over two columns in exactly the same way as the label was. Wewill use some default values to help the user:Page 12 of 25
An introduction to GUI building with GladeNx, Nyiterationsepsilonjobname10010000.5JOBButtonsNext we add the “GO!” button.As ever, click on the button icon in the palette and then in the table cell where youwant it to go. It can be made to span two columns by using the “Packing” tab in theproperties window. Again, we will give it a proper name: “go” and change its text to bethe button's “GO!”.There's a lot more we can do to clean it up, but we will do that later when everything is inPage 13 of 25
An introduction to GUI building with Gladeplace.The imageNow we will add the image viewer. This needs to span all eight rows and to occupy the entirefirst column. The gnuplot program is generating 640 480 images so we should size for that.Add an image by clicking on the image icon in the palette and then in the top left cellof the table. Note that we need to select “image” and not “drawing area”. The latter isfor people to create their own drawings not to display existing ones.We will give it the name “image” in the “Widget” tab in the properties window.We specify that it spans eight rows in the “Packing” tab.Finally, we move to the “Common” tab and activate the fields that let us explicitly set thewidth and height of the image. These need to be enabled by the check boxes and then havevalues added. Because most widgets resize these fields are normally deactivated which is whywe need to explicitly activate them.The main window is now quite enormous. Fortunately we are almost done with it for now.Page 14 of 25
An introduction to GUI building with GladeEventsA GUI is an “event-driven” application. When you click a button an “event” is generatedsaying you have done so, for example.To get our application to work we need to do something when the “GO!” button is pressed.The way to do that in Glade is to use the properties window on the button to identify afunction in a script when the button is clicked. Then, separately, we write the script thatimplements that function.The go buttonTo set up the signal handling for the “GO!” button we first click on it in the GUI to select it.The properties window will switch to showing its properties. This time, select the “Signals”tab.Page 15 of 25
An introduction to GUI building with GladeEvery widget generates certain events or signals2. Some are common over all widgets, othersspecific to a specific type of widget, and almost all are irrelevant to us. We are interested inonly one event which is called “clicked”. This is the event generated by the button when weclick it.To identify that event we can either type “clicked” in the “Signal:” field, or select it from thebrowsable list under “ ”.Note that as soon as the “clicked” event is selected, a suggested name for the “handler” isfilled in: “on go clicked”. This is a suggested name for a function that will be called on theevent of the go button being clicked. We do not have to stick with this proposed name but weare taking the path of least resistance in this course so we will. Click “Add” to approve thisassignment of handler function to event. The properties window will update to list thisassignment in the top part of the window.2 This is not a good name for them. They should not be confused with the signals used by theoperating system to stop or start processes etc.Page 16 of 25
An introduction to GUI building with GladeOf course, we still have to write this function.Closing the windowWhen we close the main window from the buttons in the title bar we expect the application toterminate. Surprisingly this is not done by default. We need to set up an event handler tohandle the event sent to the application when its window is closed.To add an event handler we need to select window1 so that its properties are available and sothat we can access its “Signals” tab. There is an interesting twist, though. We have completelycovered window1 with a table. That table is mostly covered by other widgets. There is no partof the main GUI that gets us the underlying window1.There are two ways round this. We could just click on the window1 line in the main GUI builderwindow. But this would not be available to us if we were trying ot get at some otherinaccessible widget.The more general approach is this. If you click on any part of the window representing ourapplication with the right button on your mouse, you get a menu. This menu lists options forwhatever the widget is that you were clicking on. However, beneath that it provides submenusfor all the widgets below the top-most widget. In our case the bottom of the menu is“window1”. Moving across from that we get its menu options, the first of which is “Select”. Ifwe pick this we have selected the concealed window1 widget and can address its properties inthe Properties window.Page 17 of 25
An introduction to GUI building with sgtkgtk.glade# Put the event handlers here.def on window1 delete event(*args):sys.exit(0)def on thing clicked(*args):# Get values out of the data input widgetsfoo value foo widget.get text()# Run the calculation command.calculation command "PROGRAM '%s' '%s.dat'" % (foo value, jobname value)os.system(calculation command)# Generate the gnuplot commandsgnuplot filename "%s.gplt" % jobname valuegnuplot file open(gnuplot filename, "w")gnuplot file.write("""set style data dotsset title "foo %s"set terminal pngset output "%s.png"plot "%s.dat"""" % (foo value, jobname value, jobname value))gnuplot file.close()# Run the gnuplot commandgnuplot command "gnuplot %s.gplt" % jobname valueos.system(gnuplot command)# Take the image file created and stick it in the image widgetimage filename "%s.png" % jobname valueimage widget.set from file(image filename)# Main function.if name " main " :# Put the name of the .glade file here.global applicationapplication gtk.glade.XML('thing.glade')# Create the widgets we need to talk to directly here.global image widgetimage widget application.get widget('image')global foo widgetfoo widget application.get widget('foo')# Launch the applicationapplication.signal autoconnect(globals())gtk.main()Page 18 of 25
An introduction to GUI building with GladeAgain we pick the “Signals” tab and identify the “delete event” from the “Select Signal”browser.Again, we will accept the proposed name “on window1 delete event” for the function.We are now done with the GUI building. Save the interface and then quit. (Go to the mainwindow and select Project Quit from the menus.)Writing the back end scriptThe Glade system can have various languages running behind the GUI, including C, C andAda. It can also interface with the Python scripting language, which is relatively easy to learnand quick to experiment with. Moreover we can use a template script for the task of sticking aGUI on the front of an existing command line application so we only need to make simplechanges rather than writing it from scratch.First we must be in the directory identified in the original “save as ” dialogue. In the case ofthis example the directory is /home/rjd4/Projects/Iterator.We will copy a template Python script that we will then modify. We will call it “iterator.py”.Our editor of choice will be emacs in this set of notes. There is no obligation to use this editor;any plain text editor will do but emacs has nice support for editing Python files. cp template.py iterator.py emacs iterator.py & This course does not have a Python prerequisite. You are not expected to follow all the ins andouts of the Python in the script. You just need to follow the patterns that already appear in thescript and change them and duplicate them as needed.The text that follows is the entire template. The elements you have to change are highlighted.While the script may look overwhelming at first glance, there are just six entries in this scriptthat need to be modified. Each is individually quite straightforward and they will be coveredone by one in the following sections.In the words of the late, great Douglas Adams:Don't Panic!It's easier to understand the changes to the template script if we don't tackle them in thePage 19 of 25
An introduction to GUI building with Gladeorder they appear but in a slightly different order.The name of the Glade fileapplication gtk.glade.XML('thing.glade')We will start with one of the shortest changes. The Python script needs to know where Gladehas put its description of what the GUI should look like. In the current directory, you will finda file ending in “.glade”: ls -ltotal 111rjd4rjd4rjd4rjd4rjd4rjd4 11183 2006-02-16 20:27 iterator.gladerjd4 1285 2006-02-16 20:02 iterator.glade.bakrjd4277 2006-02-16 20:27 iterator.gladeprjd4277 2006-02-16 20:02 iterator.gladep.bakrjd4 1587 2006-02-16 21:00 iterator.py We change “thing.glade” to “iterator.glade”:application gtk.glade.XML('iterator.glade')The widgetsglobal foo widgetfoo widget application.get widget('foo')This part of the script lists the widgets that we have to interact with directly. In our case thisis the set of widgets we will be pulling parameters from (“nx”, “ny”, “iterations”, “epsilon”,and “jobname”) and the image widget. The image widget is always needed so we can justleave the line alone.So we will replace the single “foo” entry in the script with four entries for each of our inputs.We will stick to the naming convention in the template of using “foo widget” as the referenceto the widget that was given name “foo” in the GUI builder.So the “global” line should be altered to read:globalglobalglobalglobalglobalnx widgetny widgetiterations widgetepsilon widgetjobname widgetand we will need five equivalent “foo widget” lines:nx widgetny widgetiterations widgetepsilon widgetjobname widget application.get widget('nx')application.get widget('ny')application.get widget('iterations')application.get widget('epsilon')application.get widget('jobname')Page 20 of 25
An introduction to GUI building with GladeThese set up the variables used in the script and, if you're interested, the “global” keywordsimply means they can be used anywhere in the script.The name of the event handlerdef on thing clicked(*args):You will recall that we used the GUI to name a “handler” function for the “clicked” event onthe “go” button. The GUI offered the proposed function name “on go clicked” which weaccepted. We commented then that we still had to write the function. This is where we do it.The “def” keyword simply means “define a function” and the name that follows it is the nameof the function being defined.So we change this line to readdef on go clicked(*args):matching the function name expected by the button.The “(*args)” bit at the end is simply the language's way of describing how information ispassed to the function and the colon just marks the end of the naming and the start of thedefinition.The event handler function immediately above it (on window1 delete event) is the eventhandler called when the window is closed (“deleted” in X11 jargon).Getting values from the text entry widgets# Get values out of the data input widgetsfoo value foo widget.get text()The foo widget is any of the widgets created in the section at the bottom of the script. Wecan talk about them directly because they were declared to be global. All of the widgets aretext entry widgets and the foo widget.get text() instruction simply gets the text they arecurrently displaying. It always returns text, though. To a computer the text “100” is verydifferent from the number “100” but this won't matter to us because of how we are calling thecommand. Whatever this text is, it is put in a variable foo value for later use.So to start the work for the nx widget we would use the linenx value nx widget.get text()So the linefoo value foo widget.get text()in the template would be replaced with the five linesnx valueny valueiterations valueepsilon valuejobname value nx widget.get text()ny widget.get text()iterations widget.get text()epsilon widget.get text()jobname widget.get text()in the real script.Page 21 of 25
An introduction to GUI building with GladeRunning the calculationcalculation command "PROGRAM '%s' '%s.dat'" % (foo value, jobname value)This is the line where we specify the command line we want run behind the scenes to createthe data that we are then going to display in a graph.We need to define the program to be run (“PROGRAM” in our template) and its command linearguments which we populate from the data we have pulled from the GUIs. In our case wehave to replace “PROGRAM” with “./iterator” because that's the program we want to run. It's“./” at the start to mean “run the iterator program out of this directory”. Normally thecurrent directory wouldn't be looked in for programs.We also need to define its command line arguments. All the business with % characters isPython's way of doing substitution of text. If foo value was “100” and jobname value was“fred” then Python turns"PROGRAM '%s' '%s.dat'" % (foo value, jobname value)into"PROGRAM '100' 'fred.dat'"before setting this converted form to be the value of calculation command. The %sexpressions get converted into the values of the variables appearing in the brackets at the endin the order they appear.Our ./iterator command takes four variables: Nx, Ny, iterations and epsilon. So we needfour %s expressions for the arguments and a fifth for the stem of the file name. So for ourscript we need the linecalculation command "./iterator '%s' '%s' '%s' '%s' '%s.dat'" %(nx value, ny value, iterations value, epsilon value, jobname value)in place of the template's line. This must all be on a single line. So, if nx value was “100”,ny value was “200”, iterations value was “1000”, epsilon value was “0.49” andjobname value was “run49” then this line would be converted tocalculation command "./iterator '100' '200' '1000' '0.49' 'run49.dat'"before being run.Converting the graphicsWe use the gnuplot application to convert our data points into a graph. Now gnuplot is ahuge application in and of itself and this is not a course on it. This section will lead youthrough the gnuplot instructions and offer a few alternatives that you might need for differentforms of graph plotting.The gnuplot instructions in the template include these that you might want to change:set style data dotsset title "foo %s"We will explain them both, but note that we are using the %s mechanism explained in thesection above so we will have to change the variable names in the brackets at the end.set style data dotsThis command specifies that the data consists of individual data points that should not bejoined together with lines. The alternative, if you want the points joined by straight lines is“set style data lines”.set title "foo %s"Page 22 of 25
An introduction to GUI building with GladeThis sets a title for the graph which appears at the top of the image by default. If you don'twant it then just drop the line altogether and remove the foo value variable from thebrackets. We want to quote the value of epsilon in our title so we would change this line toset title "epsilon %s"and change the “foo value” in brackets at the end to “epsilon value”:""" % (epsilon value, jobname value, jobname value)And that's it. We have modified our template script to process our specific data. Save theedited Python file (Ctrl X Ctrl S) and we are ready to run our GUI.Page 23 of 25
An introduction to GUI building with GladeRunning the GUITo launch the GUI, simply run the Python script. ./iterator.pyAny error messages will appear in the terminal you launched the program from. The GUIshould appear in front of you. Click “GO!” to see how the defaults play out.You can close down the Glade GUI builder if you haven't already. Go to the main window andselect Project Quit from the menus.Page 24 of 25
An introduction to GUI building with GladeExercisesResetting default valuesRelaunch Glade in the GladeCourse directory. Double click on window1 in the main window tobring up the window you use for building the GUI.Now add a button spanning the two remaining cells on the bottom row. This button shouldcarry the text “Defaults” and should set the values of the text entry widgets to the values westarted them out with.You have everything you need to do this with the exception of the small tit-bit of informationthat as well as foo widget.get text() to get the text from the widget we can usefoo widget.set text("text") to set the text in the widget.Prettifying the GUIAccess the properties of the table and increase its number of rows by one. Increase theimage's row span to occupy this extra row. Then add a blank label spanning the second andthird columns on this new row. Access the packing properties of the label and switch the“Y Expand” property from false to true. Observe how the rows are no longer stretched sobadly.Same ideas, different programThe lissajou program takes three arguments: m, n and delta. It generates 1,001 lines ofoutput representing the coordinates of pointsx sin(2π mk/N)y sin(2π nk/N 2πδ)N 1000k 0 1000Write the GUI and adapt the template to create a program that inputs the three values and ajob name and displays the image of the corresponding Lissajou figure.The gnuplot instructions you will need can be adapted from this set for m 3, n 4, delta ¼:set title "Lissajou: m 3 n 4 delta 0.25"set terminal pngset output "test.png"plot "test.dat"Page 25 of 25
An introduction to GUI building with Glade set terminal png Define the output as being in PNG graphics format. set style data dots Specify that the individual points should be plotted and not joined together with lines. set title "epsilon 0.49" Set the legend in the picture created. set output "49.png" Specify the graphics file created. plot "49.dat" Specify the input file and give the .