Transcription
Introduction to MATLAB Graphical UserInterfacesSergey SimakovMaritime Operations DivisionDefence Science and Technology OrganisationDSTO–GD–0442ABSTRACTThe aim of this course is to develop initial skills for building Graphical UserInterfaces (GUIs) in MATLAB7. First we give a summary of MATLAB’sgraphics object hierarchy and review the syntax for accessing and manipulating object properties. Then we discuss standard user interface components andconsider situations when descendants of axes can be used to design purposebuilt graphical controls. Programming techniques are analysed using moderately simple conceptual examples and exercises. The structure of applicationm-files generated by the MATLAB GUI development environment and sometechniques for inclusion of Java components and ActiveX controls into MATLAB GUIs are also discussed.APPROVED FOR PUBLIC RELEASE
DSTO–GD–0442Published byMaritime Operations DivisionDSTO Defence Science and Technology OrganisationPO Box 1500Edinburgh, South Australia, Australia 5111Telephone:Facsimile:(08) 8259 5555(08) 8259 6567c Commonwealth of Australia 2005AR No. 013-447October, 2005APPROVED FOR PUBLIC RELEASEii
DSTO–GD–0442Introduction to MATLAB Graphical User InterfacesEXECUTIVE SUMMARYMATLAB is viewed by many users not only as a high-performance language for technicalcomputing but also as a convenient environment for building graphical user interfaces(GUI). Data visualisation and GUI design in MATLAB are based on the Handle GraphicsSystem in which the objects organised in a Graphics Object Hierarchy can be manipulatedby various high and low level commands.These notes were prepared for a short course on GUI building in MATLAB7. The aimof the course is not to cover all aspects of GUI building, but rather to give a conciseexposition of some possible viable GUI design techniques. The MATLAB code discussedin the course examples can also be used as a starting template for developing more complexGUIs.Each new release of MATLAB brings new objects and categories in the Handle GraphicsSystem. MATLAB7, in which the introduction of many new objects has considerably reshaped the Graphics Object Hierarchy, is also characterised by a significant strengtheningof capabilities for using Java and ActiveX.Though all such changes make the GUI design more flexible and versatile, they also increasethe complexity of the Handle Graphics System and require some effort to adapt to.This course is also an attempt to facilitate such an adaptation through the analysis ofmoderately simple conceptual examples and applications.iii
DSTO–GD–0442iv
DSTO–GD–0442Contents1MATLAB Graphics Objects12Graphics Object Hierarchy43User Interface Objects3.1UI controls . . . . . . . . . . . . . . . . . . . . . . . . . . . . . . . . . . . 113.2Menus, push/toggle tools, and toolbars . . . . . . . . . . . . . . . . . . . 143.2.13.344.2Container objects: uipanel and uibuttongroup . . . . . . . . . . . . . . . . 1618Some useful constructs and concepts . . . . . . . . . . . . . . . . . . . . . 194.1.1Function feval . . . . . . . . . . . . . . . . . . . . . . . . . . . . 194.1.2Constructs varargin and varargout . . . . . . . . . . . . . . . . 194.1.3Replacing Lists of Variables with Cell Arrays . . . . . . . . . . . 20Data storage and exchange using application data . . . . . . . . . . . . . 214.2.16UI menus and context-menus . . . . . . . . . . . . . . . . . . . . 14Programming MATLAB GUI4.1511Functions guidata and guihandles. . . . . . . . . . . . . . . . . 224.3Callbacks in GUIDE-generated application m-files . . . . . . . . . . . . . 234.4More on callback organisation . . . . . . . . . . . . . . . . . . . . . . . . . 254.5Predefined dialog boxes . . . . . . . . . . . . . . . . . . . . . . . . . . . . 32Inclusion of ActiveX and Java Components355.1ActiveX controls . . . . . . . . . . . . . . . . . . . . . . . . . . . . . . . . 355.2Java components . . . . . . . . . . . . . . . . . . . . . . . . . . . . . . . . 40Concluding Remarks42References43AppendicesAComments on the course exercises45v
DSTO–GD–0442Figures1Graphics Object Hierarchy for Exercise 8 . . . . . . . . . . . . . . . . . . . .52Objects of Exercise 9 . . . . . . . . . . . . . . . . . . . . . . . . . . . . . . . .63Graphics Object Hierarchy for Exercise 9 . . . . . . . . . . . . . . . . . . . .74Hgtransform object of Exercise 12 . . . . . . . . . . . . . . . . . . . . . . . .95Exercise 18: uipanel objects as parents of axes6A control associated with the plot . . . . . . . . . . . . . . . . . . . . . . . . 317Controls similar to plotslider . . . . . . . . . . . . . . . . . . . . . . . . . . 338A crop tool . . . . . . . . . . . . . . . . . . . . . . . . . . . . . . . . . . . . . 349An ActiveX slider . . . . . . . . . . . . . . . . . . . . . . . . . . . . . . . . . . 3910Slider Java cmponent . . . . . . . . . . . . . . . . . . . . . . . . . . . . . . . . 4111MATLAB axes and a uitable object . . . . . . . . . . . . . . . . . . . . . . . 42. . . . . . . . . . . . . . . . . 17Tablesvi1Application data fields used in Exercise 29 . . . . . . . . . . . . . . . . . . . . 352Summary of the event structure . . . . . . . . . . . . . . . . . . . . . . . . . . 37
DSTO–GD–04421MATLAB Graphics ObjectsExecution of certain commands in MATLAB is accompanied by the creation of graphicalobjects. Most of such objects, but not all, can be displayed on the computer screen.Exercise 1. Consider the results of entering the following commands (the code for Example 1 and the other examples of this section can be found in the folder Section11 ):hf figure;ha axes;x [-10:0.1:10];h line(x,exp(-x. 2));We can observe that at least 3 graphical objects (of type figure, axes and line) are beingcreated. There is also a graphical object, called root which corresponds to the computerscreen.When a graphical object is created, it is assigned a unique number called a handle. Thehandle of the root object is always 0. Graphics handles can be used as input argumentsin the commands get and set to access and manipulate properties of objects.Exercise 2. Continue the above code by successively enteringget(hf,’Type’)get(ha,’Parent’) hfP get(ha,’Position’);set(ha,’Position’,[P(1) P(2) P(4)/4 P(3) P(4)/2]);set(hf,’Color’,[0 0 0]);set(h,’Color’,[1 0 0],’Linewidth’,5);hf1 figure; ha1 erve what happens when each of the above lines is executed and comment on theoutcome.Properties of objects are used not only to control their appearance but also their behaviourand functionality.Exercise 3. Enter the lines:hf (hf,’HandleVisibility’)gcf hfrootCh get(0,’Children’);find(rootCh ,’HandleVisibility’)gcf hfrootCh get(0,’Children’);find(rootCh hf)1These files are provided on a companion CD.1
DSTO–GD–0442Explain the outcome of the above code. Use MATLAB’s help or helpdesk to review thecommands gcf, gca and gco. Examine the code of these functions.Note that if the HandleVisibility property of a figure is set to ’off’, its handle isnot a value of the root’s CurrentFigure property. Similarly, axes with hidden handlesdo not appear in their parent figure’s CurrentAxes property, and all figure’s childrenwith hidden handles do not appear in its CurrentObject property. These “bookkeeping”rules have a direct effect on the results of commands gcf, gca and gco2 . Objects whoseHandleVisibility property is set to ’off’ or ’Callback’ are not listed in the Childrenproperty of their parent. However, an object’s Parent property is not affected by thevisibility of its handle.Exercise 4. Enter the commands one by one:hf figure;hL plot(rand(10,1),’Tag’,’MyLine’);Click on the resulting line object and verify (by checking the tag and comparing thehandles) that this makes the line hL the figure’s current object:h hL);Now hide the line’s handle (set(h,’HandleVisibility’,’off’)), click on it again andcheck what the figure’s current object now is (using gco).The following exercise examines the root’s CallbackObject property.Exercise 5. Enter:hf figure(’NumberTitle’,’off’);f @(h,eD) set(gcbf,’Name’,[’CallbackObject: ’ get(gcbo,’Type’)]);ha axes(’Position’,[0.1 0.3 0.8 0.6]);hL line([1:10],rand(1,10));hb uicontrol(’Style’,’Pushbutton’);hum uimenu(’Label’,’Test’);set([hf ha hL],’ButtonDownFcn’,f);set([hb hum],’Callback’,f);First a few comments on the above code: Object creation commands in MATLAB can be invoked with additional argumentsspecifying the object’s Property-Value pairs; In this example we use a construct which is described in the helpdesk entry “Anonymous Functions”; The reason why we used this particular form of input arguments will be discussedlater; Note that vectors of handles can be used in set and get commands provided eachof the objects listed have the corresponding property and accepts the input valueused.22Also: findobj, newplot, cla, clf and close.
DSTO–GD–0442Now click on any object created (figure, axes, line, push button, or the menu labelled“Test”) and observe what happens with the name of the figure.Exercise 6. Consider Exercise 5 with variable f defined as follows:f @(h,eD) set(gcbf,’Name’,[’CallbackObject: ’ get(h,’Type’)]);Some properties of MATLAB’s objects use for their values references to functions or programs to be executed. In Example 5 those were Callback and ButtonDownFcn. If thedata type used as a value for such properties is a function handle, then the first argumentof the associated function must be treated by its code as a callback object handle and thesecond argument as an event data. Many of the events in MATLAB do not have theirevent data implemented yet, so an empty array is passed instead. The following exampleuses an event type (KeyPressFcn) for which the event data is non-empty.Exercise 7. The function used in this exercise can be found in the folder Section1 ofexamples. The code for this function (file eDtest.m) is provided below.function eDtestF.Units ’characters’;F.Position [40 20 60 28];F.MenuBar ’none’;A.Units ’normalized’;A.Position [0 0 1 1];A.Color [0 0 0];T.HorizontalAlignment ’center’;T.Color [0 1 0];T.Interpreter ’none’;S char(’c’*ones(20,20));hf figure(F);ha axes(A);hT ressFcn’,@eDtestF);function eDtestF(h,eD)hT get(h,’UserData’);if length(eD.Character) 0S char(ones(20,20)*eD.Character);elseS ’’;endset(hT,’String’,S); Property/value pairs can be specified using structures; Note the use of the figure’s UserData property for storing the handle of the textobject; In this example we use the field Character of the KeyPressFcn event data structure.3
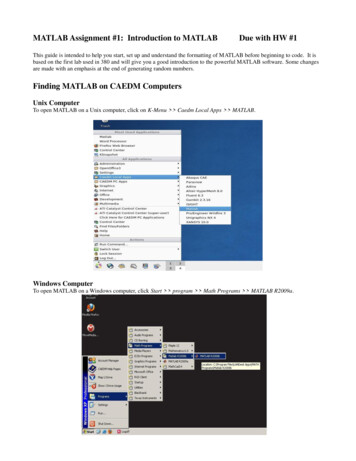
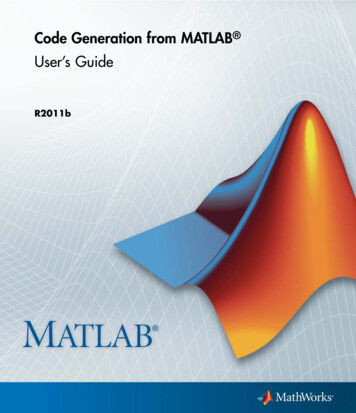
DSTO–GD–04422Graphics Object HierarchyGraphical Objects in MATLAB are arranged in a structure called the Graphics ObjectHierarchy which can be viewed as a rooted tree with the nodes representing the objectsand the root vertex corresponding to the root object. The form of such a tree depends onthe particular set of objects initialised and the precedence relationship between its nodesis reflected in the object’s properties Parent and Children. If for example, the handle hof object A is the value of the property Parent of object B, then A is the parent of B,and, accordingly, B is a child of A.Exercise 8. Consider the following code (see file exerc8.m).hf figure(’MenuBar’,’none’);hTb uitoolbar;hPT uipushtool(hTb,’CData’,zeros(8,8,3));hTT tor’,’on’);hM uimenu(hf,’Label’,’Test’);ha axes(’Position’,[0.45 0.1 0.5 0.8]);hL(1) plot([0:10],rand(11,1));hL(2) line([0:10],sin(pi*[0:10]/10),’Color’,[0 1 0]);hL(3) annotation(’line’,[0.75 0.75],[0 1],’Color’,[1 0 0]);ha1 get(hL(3),’Parent’);hGO(1) r’,[0 0.5 0]);hGO(2) line([4 5],[1.5 1.7],’Color’,[1 0 0]);hG ��,hG);PanProp.Parent hf;PanProp.Position [0.05 0.1 0.3 0.8];PanProp.Title ’UI panel example’;PanProp.BackgroundColor get(hf,’Color’);hPan uipanel(PanProp);UIPr.Units ’normalized’;UIPr.Parent hPan;UIPr.Position [0.1 0.05 0.8 0.07];UIPr.Style ’pushbutton’;hUI(1) uicontrol(UIPr,’String’,’Test Button’);UIPr.Style ’listbox’;UIPr.Backgroundcolor [1 1 1];UIPr.Position [0.1 0.17 0.8 0.75];hUI(2) fter we have run the script the following objects are created: figure hf;– UI objects: UI toolbar hTb and UI push/toggle tools (hPT and hTT, childrenof hTb), UI menu hM, UI panel hPan, UI controls hUI(1) and hUI(2) (stylespushbutton and listbox respectively);4
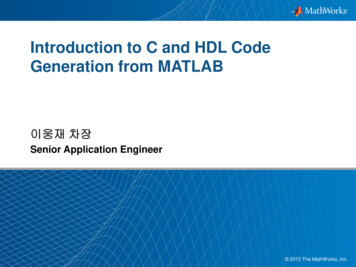
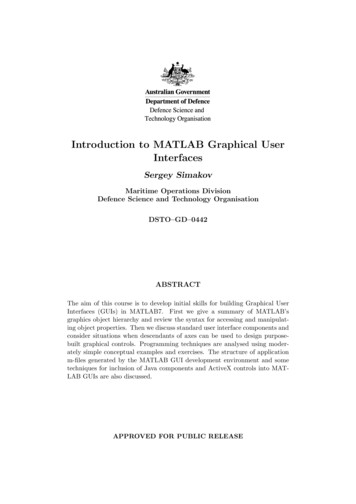
DSTO–GD–0442– Axes ha and its children: A core object line hL(1); A plot object lineseries hL(2); A group object hG parenting the core objects hGO(1) and hGO(2) (typerectangle and line respectively);– Hidden annotation axes ha1 and its child: annotation type line hL(3).A general form of the resulting hierarchy is shown in Figure 1.RootFigureUI ObjectsAxesHidden Annotation AxesAnnotation ObjectsCore ObjectsPlot ObjectsGroup ObjectsFigure 1: Graphics Object Hierarchy for Exercise 8A different set of objects can result in a different containment hierarchy.Exercise 9. The function in this exercise (see file exerc9.m) creates a set of objects (seeFigure 2) which are organized in a graphics hierarchy somewhat different from the oneshown in Figure 1.function exerc9C [0.9 0.9 0.8];hf umberTitle’,’off’);hp1 uipanel(’Position’,[0.1 0.1 0.8 0.8],.’Title’,’UI Panel 1’,’BackgroundColor’,C);ha axes(’Parent’,hp1,’Position’,[0.4 0.1 0.5 0.8]);hT enter’,.’FontWeight’,’bold’);hp2 uipanel(’Parent’,hp1,’Position’,[0.1 0.1 0.2 0.8],.’Title’,’UI Panel 2’,’BackgroundColor’,C);H 1/13;for k 1:6Prop.Parent hp2;5
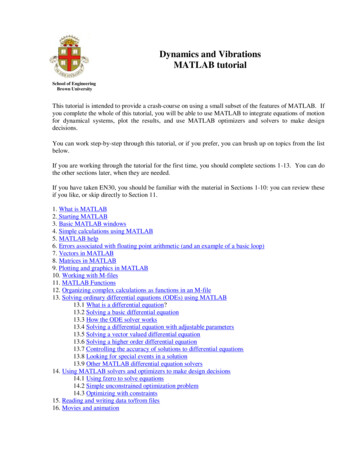
DSTO–GD–0442Figure 2: Objects of Exercise 9Prop.Style ’pushbutton’;Prop.Position [0.1 H*(2*k-1) 0.8 H];Prop.String [’Button ’ num2str(7-k)];strTxt [Prop.String ’ pressed’];Prop.Callback {@bcbF hT p);endfunction t(hT,’Color’,0.2 0.8*rand(1,3));The function creates the following objects: figure hf and its children:– UI object hp1 of type “UIpanel” and its children: UI object hp2 of type “UIpanel” and its children: Six UI controls of style “pushbutton”;– axes ha and its child of type “text”.A graphical representation of the resulting hierarchy is given in Figure 3.The possibility to have one or another form of hierarchy depends on the admissible valuesof objects’ properties Parent and/or Children.One also has to be aware of some specific rules which apply to the use of particular objects.For example, it is recommended that we do not parent any objects to the annotation axes,and we do not change explicitly annotation axes’ properties (e.g. search the Help Deskusing the entry “Annotation Layer”). Similarly, parenting annotation objects to standardaxes may cause errors: enter the code6
DSTO–GD–0442RootFigureUI PanelUI PanelAxesUI ControlsTextFigure 3: Graphics Object Hierarchy for Exercise 9ha axes;h annotation(’line’,[0 1],[0 1]);set(h,’Parent’,ha);and see what happens when the figure is resized.Exercise 10. Show that in MATLAB 7 the annotation axes and standard axes have differentset of properties, though the value of their property Type is the same string ’axes’.This can be done using the following script (file exerc10.m):ha axes;h annotation(’arrow’,[0 1],[0 1]);haA get(h,’Parent’);disp([’Type for Standard:’ get(ha,’Type’)]);disp([’Type for Annotation: ’ get(haA,’Type’)]);A fieldnames(get(ha));B fieldnames(get(haA));[AnB,BnA,inAB] comp sc(A,B);disp(’In standard axes, but not in annotation axes:’);disp(A{AnB});disp(’In annotation axes, but not in standard axes:’);disp(B{BnA});Running this code gives the result:Type for Standard:axesType for Annotation: axesIn standard axes, but not in annotation axes:CurrentPointIn annotation axes, but not in standard axes:ObserveFigChildAdded7
DSTO–GD–0442The code of the function comp sc which compares two cells of strings is given below (filecomp sc.m).function [AnB,BnA,inAB] comp sc(A,B)[C,inAB.Aind,inAB.Bind] intersect(A,B);AnB setdiff([1:length(A(:))],inAB.Aind);BnA setdiff([1:length(B(:))],inAB.Bind);A similar exercise in earlier releases of MATLAB3 , e.g. in Version 6.5.1, would yield adifferent result. We can also see that the annotation and standard axes have differentunderlying classes if we continue the script in exerc10.m by entering:disp([’Standard: ’ class(handle(ha))]);disp([’Annotation: ’ class(handle(haA))]);The following result will be displayed:Standard: axesAnnotation: scribe.scribeaxesThe result in MATLAB 6.5.1 would beStandard: axesAnnotation: graph2d.annotationlayerWe now consider two more examples of objects which have the same value for their propertyType.Exercise 11. The lines which can be created by running the script below (file exerc11.m)are different kinds of lines, but the value of the property Type is the string ’line’ foreach of them.hL1 line([0:1],[0.5 0.5],’Color’,[1 0 0]);hold on;hL2 plot([0:0.1:1],[0:0.1:1]. 2);%%%%disp([’Type Value of hL1: ’ get(hL1,’Type’)]);disp([’Type Value of hL2: ’ get(hL2,’Type’)]);disp([’hL1: ’ class(handle(hL1))]);disp([’hL2: ’ class(handle(hL2))]);%A fieldnames(get(hL1));B fieldnames(get(hL2));[AnB,BnA,inAB] comp sc(A,B);A(AnB)B(BnA)3Note that annotation is not a standard command in MATLAB 6.5 and the annotation objects inMATLAB 6.5 have to be created via the figure’s UI toolbar.8
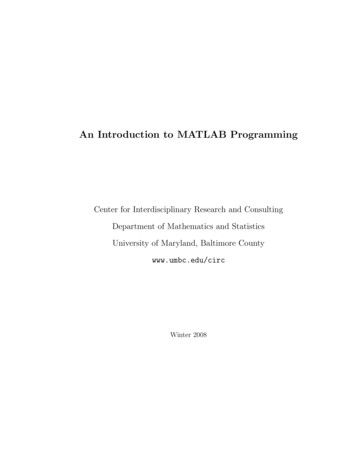
DSTO–GD–0442The following answer will be displayed:Type Value of hL1: lineType Value of hL2: linehL1: linehL2: graph2d.lineseriesans Empty cell array: 0-by-1ans ��YDataSource’’ZDataSource’Note that the data source properties of plot objects are used by the function refreshdata.Figure 4: Hgtransform object of Exercise 12Exercise 12. The code below (file exerc12.m) defines a function which creates an hgtransformobject (see Figure 4) and returns a handle to it. This function exploits the Matrix propertyof hgtransform objects.function hT exerc12hf ,’Hgtransform Example’);ha spectRatio’,[1 1 1],.’NextPlot’,’add’);set([hf, ha],’Color’,[0 0 0])r(1:2:17) ones(1,9);r(2:2:16) 0.5*ones(1,8);9
DSTO–GD–0442phi [0:1:16]*(2*pi)/16;x r.*cos(phi);y r.*sin(phi);hP patch(x,y,[1 0.9 0.4]);hL line(x,y,’Color’,[0 0 1]);hLP1 line([3*x;4*x]/2,[3*y;4*y]/2,’Color’,[1 0 0]);hLP2 line([3*x;4*x],[3*y;4*y],’Color’,[1 0 0]);hT hgtransform;set([hP; hL; hLP1; (hT,’ButtondownFcn’,@spinStar);function spinStar(h,eD)hT gcbo;for k ��zrotate’,pi*k/15));endNow run the scripthT1 exerc12;hT2 annotation(’line’,[0.1 0.1],[0 1],’Color’,[1 0 0]);disp([’Type Value of hT1: ’ get(hT1,’Type’)]);disp([’Type Value of hT2: ’ get(hT2,’Type’)]);disp([’hT1: ’ class(handle(hT1))]);disp([’hT2: ’ class(handle(hT2))]);%A fieldnames(get(hT1));B fieldnames(get(hT2));[AnB,BnA,inAB] comp cells(A,B);A(AnB)B(BnA)The following answer will be displayed:Type Value of hT1: hgtransformType Value of hT2: hgtransformhT1: hgtransformhT2: scribe.lineans ’Selected’ans �Y’10
DSTO–GD–0442The general aim of Exercises 8 to 12 was to provide some simple examples illustratingthe use of objects associated with the Axes and Hidden Annotation Axes (see Figure 1),as well as to explore how they are related. Since the group objects and the annotationobjects became standard user-level concepts only in Release 14 we dwelled on them longer.Helpdesk search entires Core Objects, Plot Objects, Group Objects and AnnotationObjects can be used to access the full specification of all objects in these categories.UI Objects were also present in some of the considered examples. We will discuss them inmore detail in the next section.3User Interface ObjectsThe following objects are grouped under the category of MATLAB User Interface Objects: UI controls: check boxes, editable text fields, list boxes, pop-up menus, push buttons,radio buttons, sliders, static text boxes, toggle buttons. UI toolbar (uitoolbar), which can parent objects of type uipushtool and uitoggletool; UI context menus and UI menus (objects of type uicontextmenu and uimenu); Container objects uipanel and uibuttongroup.3.1UI controlsUI control objects have the same value (string uicontrol) for their Type property. Theirparent can be a figure, a UI panel, or a UI button group. By specifying the Style property,we decide whether the resulting object is a check box, a push button, or any other memberof the available set of UI controls. The Style property can be set to one of the followingstrings: checkbox radiobutton edit slider listbox text popupmenu toggle pushbutton frameExercise 13. Run the following script and inspect UI controls and their properties in eachof the created figures.StyleStr {’checkbox’ ’edit’ ’listbox’ ’popupmenu’ .’pushbutton’ ’radiobutton’ ’slider’ ’text’ .’toggle’ ’frame’};fcbF @(h,eD) inspect(findobj(h,’Type’,’uicontrol’));11
DSTO–GD–0442for k 1:length(StyleStr)P.Style StyleStr{k};P.Units ’pixels’;switch P.Stylecase {’listbox’ ’popupmenu’ ’edit’}P.String {’Opt. 1’ ’Opt. 2’ ’Opt. 3’ ’Opt. 4’.’Opt. 5’ ’Opt. 6’ ’Opt. 7’};P.Position [50 20 150 60];P.Max 2;P.HorizontalAlignment ’left’;case ’slider’P.String ’’;P.Position [50 50 150 20];otherwiseP.String ’Option 1’;P.Position [50 50 150 20];endhf ’off’,.’Color’,[0.6 0.7 ls’,’Position’,[200 300 250 110]);P.Parent hf;P.BackgroundColor [1 1 1];set(hf,’Name’,[’UI control style: ’ P.Style]);uicontrol(P);clear P;endThe property inspector for each UI control of this example can be invoked by clicking on thecorresponding figure window, each of which has its ButtonDownFcn set to the anonymousfunction fcbF defined at the beginning of the script. To set the Callback property of eachUI control to some permissible value, we will use the string ’get(gcbo,’’Value’’)’. Wecan set the callback either via the property inspector by typing get(gcbo,’Value’) intothe Callback field for every UI control, or we can do it for all UI controls by entering thecommands:h ack’,’get(gcbo,’’Value’’)’);Once the callback has been set perform some manipulations with the associated UI control.By observing the result displayed in the command window try to find out what actions trigger the execution of the callback; how the displayed value is connected with the state of the UI control and with itsMin and Max properties.Note that the callbacks specified as strings are executed in the base workspace. How canwe use callbacks and events associated with them? Take for example a slider. If the12
DSTO–GD–0442callback function has access to the handle of the slider, we can obtain its Value property,and then use the result to reset some other parameter. How can the handle of the controlbe passed to the callback? If the callback is specified as a string we use the function gcbo,which returns the object that was the source of the event. If we specify the callback as afunction handle, we just have to keep in mind that in this case the first argument of thecallback function is the handle to the source object of the event and the second argumentis the event data, and their values are passed to the callback function automatically (also,see our comments on Exercise 6).Exercise 14. Examine how the callback property of the slider in the code below (filetestSlider.m) is defined. Here the parameter changed by the associated callback functionis the colour of axes.function testSliderFP.Units ’pixels’;FP.Position [200 200 200 300];FP.Color [0.9 0.9 0.7];FP.Numbertitle ’off’;FP.Menubar ’none’;hf figure(FP);AP.Units ’pixels’;AP.Position [40 100 120 180];AP.Color [0 0 0]; AP.Box ’on’;AP.XTick [];AP.YTick [];AP.XLim [0 1];AP.YLim [0 1];ha axes(AP);UiP.Style ’slider’;UiP.Units ’pixels’;UiP.Position [40 42 120 15];UiP.Callback {@sliderCBF ha};UiP.Max 100;hS alAlignment’,’center’);set([hf ha Visibility’,’off’);function sliderCBF(h,eD,ha)V get(h,’Value’);MaxSV get(h,’Max’);set(ha,’Color’,[1 1 1]*V/100);We will use the simple functionality of this examplemore than once. In Section 4.3 it will illustrate howthe GUI interacts with the application m-file and thecallback subfunctions. We will also use it to show howJava and ActiveX components can be included in ourMATLAB GUI applications.13
DSTO–GD–04423.2Menus, push/toggle tools, and toolbarsThe default value of figure’s property MenuBar is ’figure’. If we create an empty figure(e.g. by entering hf figure;) with default settings we can see that there are two rows ofuser interface objects in the upper part of the figure. These objects are of type uimenu(located in the upper row), and of type uipushtool and uitoggletool (in lower row).These uipushtool and uitoggletool objects are contained within and parented by abar-like object whose type is uitoolbar.The following exercise illustrates the usage of uipushtools and uitoggletools.Exercise 15. Create a standard empty figure and suggest how we could access and extractthe CData information of its uipushtools and uitoggletools.One possible solution is given by the the following code (file exerc15.m).hf figure;hT findall(hf,’Type’,’uitoolbar’);h findall(hT,’Parent’,hT);hT1 uitoolbar(hf);hPT uipushtool(hT1);f @(hObj,eD) ��ClickedCallback’,f,’Enable’,’on’);A few comments on this code. Here we used the command findall to obtain the handles of the uitoolbar andUI-push/toggle-tools. Alternatively, we could have usedhT findobj(hf,’Type’,’uitoolbar’);h get(hT,’Children’);after setting the root’s property ShowHiddenHandles to ’on’. Note that the callbacks for the uipushtool and uitoggletool are specified in thefield ClickedCallback. As we did in a number of previous examples, an anonymousfunction was used in order to make the code more compact. The last line in the script resets the ClickedCallback property of the UI-push/toggletools in the uitoolbar hT, so that pushing any of them results in appropriately resetting the CData property of the uipushtool parented by the uitoolbar hT1.3.2.1UI menus and context-menusUI menus can be parented by figure objects, other UI menus and the objects of typecontextmenu. The following example illustrates these options.Exercise 16. Examine the following script (file exerc16.m) and run it.hf ’off’,’Name’,’UI-menus’);14
DSTO–GD–0442N 3; NN 3; NNN 3;for k 1:Nh(k) uimenu(hf,’Label’,[’menu-’ num2str(k)]);for m 1:NNL [’menu-’ num2str(k) ’.’ num2str(m)];hh(k,m) uimenu(h(k),’Label’,L);if m 1set(hh(k,m),’Separator’,’on’);endfor q 1:NNNL [’menu-’ num2str(k) ’.’ num2str(m) ’.’ num2str(q)];hhh(k,m,q) uimenu(hh(k,m),’Label’,L);if q lor’’,rand(1,3))’);%%t [1:100]*4*pi/100;hL plot(t,sin(t),’Color’,[0 0 0],’Linewidth’,4);f @(h,eD,hP,C) set(hP,’Color’,C);hCm uicontextmenu;hR uimenu(hCm,’Label’,’Red’,’Callback’,{f hL [1 0 0]});hG {f hL [0 1 0]});hB f hL [0 0 1]});set([hG enu’,hCm);Comments on this script: UI-menus h(k) labelled as menu-k are children of the figure hf, ui-menus hh(k,m)labelled as menu-k.m are childern of the ui-menu h(k), and ui-menus hhh(k,m,q)labelled as menu-k.m.q are parented by the ui-menu hh(k,m). The callback function of ui-menus hhh(k,m,q) resets the color of the figure hf tosome randomly chosen color. UI-menus hR, hG and hB, labelled as Red, Green and Blue are parented by the uicontextmenu hCm, these ui-menus can be seen if we right-click on the plot line hL.The callback functions of these ui-menus reset the color of the line hL to red, greenand blue respectively. The ui-contextmenu hCm is associated with the object hL by setting the UIContextMenuproperty of hL to hCm.15
DSTO–GD–04423.3Container objects: uipanel and uibuttongroupBoth uipanel and uibuttongroup have the same value of their type property, the string’uipanel’. They also have the same set of properties which control their appearance. Wecan use the function comp cells defined in Section 2 to find that uibuttongroup objectshave additional properties SelectionChangeFcn and SelectedObject.Exercise 17. Run the function exerc17 (file exerc17.m) whose code is shown below.function exerc17P [20 20 100 15]; P1 [0 20 0 0];hf figure;h1(1) n’,P);h1(2) on’,P P1);h1(3) n’,P 2*P1);hBG uibuttongroup(’Position’,[0.5 0.1 0.4 0.5]);h2(1) ton’,’Position’,P);h2(2) tton’,’Position’,P P1);h2(3) ton’,’Position’,P r’,[0.4 0.4 BG,’SelectionChangeFcn’,@bgCbck);function bgCbck(h,eD)hUi get(h,’SelectedObject’);disp([’Selected control: ’ num2str(hUi) ’, ’ get(hUi,’String’)]);disp(’Event-data structure’);disp(eD); We have two groups of ui-controls (radio- and toggle-buttons) here. Note that thegroup parented by the figure does not possess the exclusive behaviour, i.e. all combinations of ui-controls in this group can be selected simultaneously, whereas only asingle selection is possible for the group parented by the uibuttongroup. The callback function for the SelectionChangeFcn property was designed to showthe handle and the string property of
These notes were prepared for a short course on GUI building in MATLAB7. The aim of the course is not to cover all aspects of GUI building, but rather to give a concise exposition of some possible viable GUI design techniques. The MATLAB code discussed in the course examples can also be used as a starting template for developing more complex GUIs.