Transcription
Pinnacle West Capital CorporationMaintaining Focus in aChanging ClimateBank of AmericaEnergy & Power ConferenceNovember 17, 2003
Forward-Looking StatementsThis presentation contains forward-looking statements based on current expectations and weassume no obligation to update these statements or make any further statements on any of theseissues, except as required by applicable law. These forward-looking statements are oftenidentified by words such as "hope," "may," "believe," "anticipate," "plan," "expect," "require,""intend," "assume" and similar words. Because actual results may differ materially fromexpectations, we caution readers not to place undue reliance on these statements. A number offactors could cause future results to differ materially from historical results, or from results oroutcomes currently expected or sought by us. These factors include, but are not limited to, theongoing restructuring of the electric industry, including the introduction of retail electriccompetition in Arizona and decisions impacting wholesale competition; the outcome ofregulatory and legislative proceedings relating to the restructuring; state and federal regulatoryand legislative decisions and actions, including the outcome of the rate case we filed with theACC on June 27, 2003 and the wholesale electric price mitigation plan adopted by the FERC;regional economic and market conditions, including the results of litigation and otherproceedings resulting from the California energy situation, volatile purchased power and fuelcosts and the completion of generation and transmission construction in the region, which couldaffect customer growth and the cost of power supplies; the cost of debt and equity capital andaccess to capital markets; energy usage; weather variations affecting local and regionalcustomer energy usage; conservation programs; power plant performance; the successfulcompletion of our generation construction program; regulatory issues associated withgeneration construction, such as permitting and licensing; changes in accounting principles; ourability to compete successfully outside traditional regulated markets (including the wholesalemarket); our ability to manage our marketing and trading activities and the use of derivativecontracts in our business (including interpretation of the subjective and complex accountingrules related to these contracts); technological developments in the electric industry; theperformance of the stock market, which affects the amount of our required contributions to ourpension plan and nuclear decommissioning trust funds; the strength of the real estate market inSunCor’s market areas, which include Arizona, New Mexico and Utah; and other uncertainties, allof which are difficult to predict and many of which are beyond our control.
Pinnacle West Capital Corporation Largest electricutility in Arizona Headquartered inPhoenix, Arizona,6th largest U.S. city Consolidated assetsof 9 billion
Maintaining Focus in a Changing Climate A vertically integrated utility in ahigh-growth market area Focusing on strong operational andfinancial performance Pursuing constructive regulatory outcomes Managing risks in changing energy markets Creating long-term value for shareholders
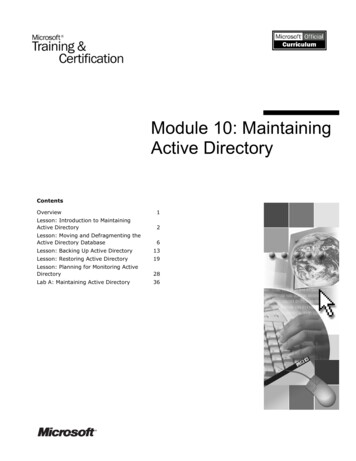
Exceptional Customer GrowthLeading 2002 Population Growth States10817962543
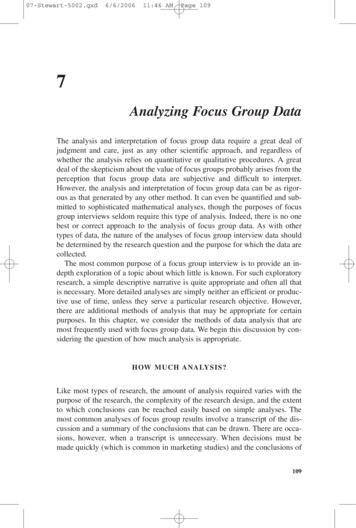
Superior Annual Customer GrowthAPS - More Than Three Times National 999200020012002YT D 2003
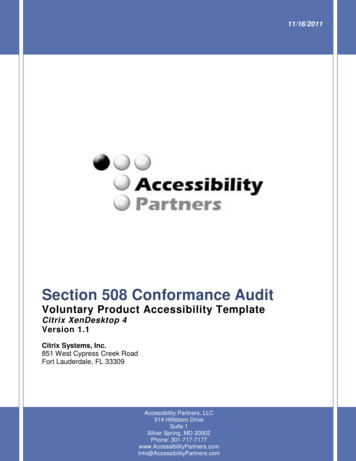
APS’ Growing Peak Load1999 - 2003 Annual Growth of 20012002200320042005Projected
Focusing on Strong Operational PerformanceGeneration Palo Verde – top U.S. power producer Top-tier baseload performance Silverhawk construction on targetDelivery High customer growth and satisfaction Superior reliability Transmission and distribution expansionto meet growth and sustain reliability
Top-Tier Generation Performance1998 – 2002 Baseload AveragesStrong OperatingPerformance100%FavorableProduction Costs /MWh1875%1750%1625%150%EquivalentNetEquivalent EquivalentNetEquivalentCapacityAvailability ForcedCapacity tageRateRateAPS14Industry
Sustaining Outstanding Customer Satisfaction120APS 3rd best among56 electric utilities11010090807060Source: J.D. Power & Associates2003 Electric Utility Residential Customer Satisfaction Survey (56 Companies)
Focusing on Operational EfficiencyAverage Customers per Employee11% Efficiency Improvement15014514013513019981999200020012002
Strong Transmission and Distribution Efficiency2002 Top QuartileO&M/Customer 400 300APS* 200AverageAverage 100 0* Excluding 2002 severance charges
APS Regulatory Strategy Relationships built on consistency,accountability, performance and trust Strong presentation of APS position Focus on reliability issue Settlement opportunities
General Rate CaseKey Provisions 9.8% ( 175 million) annual rate increase Rate base treatment of 1,800 MWof PWEC Arizona assets Recovery of previous 234 million write-off Recovery of fuel and purchased power costs 11.5% return on equity
APS Prices Low Relative toConsumer Price 91'92'93'94'95'96'97'98'99'00'01'02'03'04
Planning for Growth and ReliabilityAPS System Load and ResourcesMW12,00010,000Peak System Requirement 15% Reserves8,000Resource Deficit6,000PWEC Assets & Track B4,000Existing APS 20122013
ACC Procurement ProcessDemonstrates Need for PWEC AssetsMW3,0002,5002,0001,5001,00050002003ACC Bid Amount20042005Deliverable Non-PWEC Bids2006Undeliverable Non-PWEC Bids
General Rate Case MilestonesFilingJune 2003DiscoveryAugust 2003 – April 2004TestimonyJanuary - March 2004HearingBegins April 7, 2004BriefingProposed OrderFinal Order
Financial Objectives Achieve strong long-term financialperformance Maintain financial strength and flexibility Preserve investment-grade credit ratings Manage strong cash flow to support growth Continue focus on cost management andoperational efficiencies
2003 Earnings OutlookOutlook: Lower half of 2.55 - 2.85per share rangeMajor factors: Unplanned outages (0.19) Lower trading contributions (0.14) Tax credits 0.15 AFUDC accounting 0.12 Hot weather 0.02 to 0.05
2004 Earnings OutlookBase level earnings 2.50 per shareKey assumptions: Rate increase not reflected No trading contributions Combined SunCor and APS Energy Servicesearnings of 0.44 per shareSensitivities: Rate increase Weather variations KWH sales variation Gas price risk Efficiency gains / / / 0.00 - 0.76 0.11 0.11 0.11 - (0.07) 0.00 - 0.08
Earnings OutlookBeyond 2004 and Rate Case ResolutionAt least 3.40 per share, assuming: ACC grants APS’ rate request Trading contributions of 0.07 per share Combined SunCor and APS Energy Servicesearnings of 0.33 per share in 2005 and 0.11 per share after 2005
Strong EBITDA Interest CoverageTimes86420199819992000Pinnacle W est* Pinnacle West excluding non-recurring items20012002*S&P Electrics
Balancing Growth & Financial StrengthConsolidated Debt Ratio*Capital ExpendituresExcludingExcluding SunCorSunCor MillionsPercent1,2002005 Target of 50%6090050600300400302001 2002 2003 2004 2005ProjectedOtherPW EC GenerationAPS GenerationDeliv ery200120022005* Includes Palo Verde sale/leaseback
Consistent Historical Dividend Growth 0.10 Per Share AnnuallyPer Share 2.00Mostrecentincrease10/22/03 1.80 1.60 1.40 1.20 1.00 0.80 0.601993 1994 1995 1996 1997 1998 1999 2000 2001 2002 2003
Superior EPS and Dividend Growth**1998-2002Earnings Per ShareDividends Per Share10%10%5%5%PNW**0%S&PElectrics(5)%* 5-year compound annual growth rates** Excluding non-recurring items0%(5)%PNWS&PElectrics
Maintaining Focus in a Changing Climate A vertically integrated utility in ahigh-growth market area Focusing on strong operational andfinancial performance Pursuing constructive regulatory outcomes Managing risks in changing energy markets Creating long-term value for shareholders
Appendix
Top Dividend Growth 1998 - 2002Percent100(10)(20)(30)PNW
Strong Consolidated Cash Flow Outlook*2003SourcesCash ately 1.2 Billion* Projected
Strong Consolidated Cash Flow Outlook*2004SourcesCash lExpendituresCommonDividendsApproximately 1.1 Billion* Projected – assuming rate increase granted as requestedDebtRepayments
Pinnacle West EBITDA Interest Coverage*Reconciliation( millions)19981999200020012002Income from continuing operationsIncome taxesInterest expense, net of capitalized interestDepreciation and amortizationTotal EBITDA2002 non-recurring itemsTotal EBITDA – adjusted 243139145413940 940 270142145420977 977 3021941454311,072 1,072 3272141284281,097 1,097 21513814442592287 1,009Interest expense before capitalized interest 164 157 166 176 188EBITDA interest coverage5.7x6.2x6.4x6.2x4.9xEBITDA interest coverage – adjusted5.7x6.2x6.4x6.2x5.4x* Management believes EBITDA interest coverage provides useful information on the Company’s cashflow and ability to meet its interest obligations
Liquidity ResourcesAPS: 250 million commercial paper facility Unused long-term debt shelf capabilityof 500 millionPinnacle West (parent): 250 million commercial paper facility Unused long-term debt shelf capabilityof 230 million
Current Credit RatingsS&PMoody’sFirst Mortgage Bonds/Senior Secured DebtSenior Unsecured DebtABBBA3Baa1Secured Lease Obligation BondsBBBBaa2A2P2BBBA2Baa2P2Arizona Public Service Co.Commercial PaperPinnacle West Capital Corp.Senior Unsecured DebtCommercial Paper
Improving APS Customer erage Customers20012002Employees
APS Capacity FactorsCoal AveragePalo Verde Site lo 02
Pinnacle West Energy PlantsCommercialOperationNew FacilitiesMWsJune 2001West Phoenix 4120Phoenix, AZJuly 2002Saguaro CT 380Red Rock, AZJuly 2002Redhawk 1 and 21,060Arlington, AZJuly 2003West Phoenix 5530Phoenix, AZArizona TotalJune 2004 *SilverhawkTotalsLocation1,790570 **2,360* Target** Including 25% Southern Nevada Water Authority purchase optionLas Vegas, NV
Arizona Transmission MEAD/MRKTPLACE/LAS VEGASSAN FORNIACORONADOSPRINGERVILLEBOUSEPINNACLE PEAKCALIFORNIAPALOVERDEWEST ALIFORNIASAGUARO(TEP)KEY:500 kV345 kV to 360 kVN GILAAPACHESOUTHVAILBICKNELL230 kV to 287 kV
Reliability Remains EssentialWECC Available Transmission Capability*3,0074,1192,3681,6723,913* Summer 2006 estimate340301
Arizona Corporation ner Current TermSinceExpiresMarc Spitzer, ChairmanRepublicanJan. 2001Jan. 2007Michael GleasonRepublicanJan. 2003Jan. 2005Jeff Hatch-MillerRepublicanJan. 2003Jan. 2005Kristin MayesRepublicanOct. 2003Jan. 2005William MundellRepublicanJune 1999Jan. 2005
APS Track B Procurement ContractsAwarded May 2003MW2,0001,5001,00050002003PW EC20042005PPL EnergyPlus, LLC2006Panda Gila River, LP
Average Residential Retail Price Ranking*Southwestern U.S. /kWh16141210AverageAverage86420PPWSRPPNMAPS* As of December 31, 2002T EPNPCEEPG&ESCESDG&E
Average Commercial Retail Price Ranking*Southwestern U.S. /kWh16141210AverageAverage86420PPWSRPAPSPNM* As of December 31, 2002EENPCT EPSCEPG&E SDG&E
Average Industrial Retail Price Ranking*Southwestern U.S. /kWh1412108AverageAverage6420PPWSRPPNMAPS* As of December 31, 2002EET EPNPCSCEPG&E SDG&E
APS Energy ServicesOverview Pretax EarningsYTD Sept 200320022001 20 M 28 M (10) M Future Drivers– Seize opportunities to grow existing business atreasonable margin levels– Renew existing contracts in California(estimated at declining margins)– Realize steady growth of ESCO anddistrict cooling business– Favorably influence competitive rules andCalifornia expand market– Explore Texas opportunities
Non-Energy Subsidiaries OverviewAssets 496 Million Objectives Cash flow and profit potentialto parent 31MEl Dorado Current activities SunCor accelerated 465MSunCor asset sales programHarvesting venture capitalportfolio as it matures Growth opportunitiesSeptember 30, 2003 Select real estate opportunities Future investmentscomplementing energy business
SunCor Financial Outlook2003 - 2005 Expect annual earnings to be about double2002 level of 19 million Expect cash distributions to the parentof 80 - 100 million annually
First Mortgage Bonds/ Senior Secured Debt A- A3 Senior Unsecured Debt BBB Baa1 Secured Lease Obligation Bonds BBB Baa2 Commercial Paper A2 P2 Pinnacle West Capital Corp. Senior Unsecured Debt BBB- Baa2 Commercial Paper A2 P2. Improving APS Customer EfficiencyImproving APS Customer Efficiency 0% 3% 6% 9% 12% 15%