Transcription
EPA/600/R-13/295 December 2013 www.epa.gov/gedNeighborhood Scale Quantificationof Ecosystem Goods and ServicesOffice of Research and DevelopmentGulf Ecology Division
EPA/600/R-13/295December 2013Neighborhood scale quantification of ecosystem goods andservices.Marc Russell, Aarin Teague, Federico Alvarez, Darrin Dantin, Michael Osland, Jim Harvey,Janet Nestlerode, John Rogers, Laura Jackson, Drew Pilant, Fred Genthner, Michael Lewis,Amanda Spivak, Matthew Harwell, and Anne NealeThis report was prepared by the U. S. Environmental Protection Agency, Office of Research andDevelopment, National Health and Environmental Effects Research Laboratory, Gulf EcologyDivision. This document has been reviewed in accordance with U.S. Environmental ProtectionAgency policy and approved for publication. Mention of trade names, products, or services doesnot convey, and should not be interpreted as conveying, official EPA approval, endorsement orrecommendation.This report should be cited as:Russell, M., A. Teague, F. Alvarez, D. Dantin, M. Osland, J. Harvey, J. Nestlerode, J. Rogers, L.Jackson, D. Pilant, F. Genthner, M. Lewis, A. Spivak, M. Harwell, and A. Neale. 2013.Neighborhood scale quantification of ecosystem goods and services. U.S. EnvironmentalProtection Agency, Office of Research and Development, Gulf Ecology Division, Gulf Breeze,Florida. EPA/600/R-13/295. November 2013i
TABLE OF CONTENTSIntroduction . 1Methods and Results . 2Section 1. Ecosystem Services . 6Air Pollution Removal . 6Shading . 9Carbon Sequestration . 14Nitrogen Removal . 16Section 2. Ecosystem Goods . 20Walkability and Access to Green space . 20Aesthetic Value of Residential Trees . 26Water Feature Viewscapes . 27Section 3. Neighborhood Scale Value of Ecosystem Goods and Services . 30Biodiversity and Ecosystem Goods and Services Resilience. 32People as Part of the Ecosystem. 34Discussion . 36Conclusions . 40References . 43ii
INTRODUCTIONHumans both alter and benefit from ecosystems in many ways. In many places human presencedominates the landscape, especially in urban and agricultural settings. Every place on Earth isdirectly or indirectly affected in some way by humans. As a result, many now feel that humansshould be included in the definition of ecosystems, while others still think of human activity asan extrinsic source of stress on ecosystems. Human actions often feed back through multiple andoften complex interacting pathways to change the ecosystem goods and services that benefithumans. This feedback becomes part of natural, highly complex, cyclic processes. The conceptof ecosystem goods and services (EGS) provides a view of ecosystems that is human-centric; andthus, makes it easier to consider human stress on ecosystems as intrinsic. Ecosystem goods andservices close the feedback loops that link human actions to human costs and benefits fromecosystems. Mapping of ecosystem goods and services is useful for making this informationavailable to the general public, their representatives, and scientists. Here, we present mappedinventories of ecosystem goods and services production at a neighborhood scale within theTampa Bay, FL region. Comparisons of the inventory between two alternative neighborhooddesigns are presented as an example of how one might apply EGS concepts to land use decisionsat this scale.Ecosystem goods and services for an area of land/seascape are dependent on ecosystem type, thepresence of human made complementary resources, such as a means of transportation or thepresence of residential buildings, and the impact of human and natural stressors on that area.Changes in EGS can be estimated using a strictly supply side view or can take into accounthuman demand functions. The supply side method can estimate changes in ecological structureand function due to replacement of an ecosystem by another ecosystem type at the landscapescale; e.g., forest change to agricultural land causes a net change in the landscape's ecologicalfunctions that then may change the supply of EGS and derived benefits. These EGS suppliesonly become realized and valuable when one accounts for the connections between source areasand human beneficiaries. These landscape replacement related changes in EGS supply tend totrack linearly with the amount of ecosystem replacement; the rate of change being whollydependent on the specific types of ecosystem replacement and not on their interaction withbeneficiaries. A more complete and meaningful assessment needs to account for changes in thespatial arrangement of complementary factors, such as location of human residences, water flowpaths, and transportation networks that are paramount to turning these potential EGS intorealized EGS with actual benefits to identifiable human beneficiaries.Ecosystem goods and services are those ecological structures and functions that humans candirectly relate to their state of well-being. Ecosystem goods and services include, but are notlimited to, a sufficient fresh water supply, fertile lands to produce agricultural products, shading,1
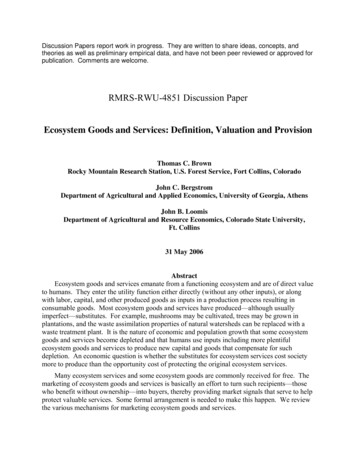
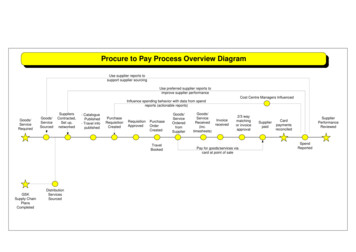
air and water of sufficient quality for designated uses, flood water retention, and places torecreate. The US Environmental Protection Agency (USEPA) Office of Research andDevelopment’s Tampa Bay Ecosystem Services Demonstration Project (TBESDP) modelingefforts organized existing literature values for biophysical attributes and processes related toEGS. The goal was to develop a database for informing mapped-based EGS assessments forcurrent and future land cover/use scenarios at multiple scales. This report serves as ademonstration of applying an EGS assessment approach at the large neighborhood scale ( 1,000acres of residential parcels plus common areas).Land cover/land use replacement based assessment of EGS has to be linked to specific spatiallyexplicit landscape units that are monitored or modeled through time. The National Land CoverDataset (NLCD) is a good national scale example of the type of required geospatial dataavailable for use in EGS production assessments but it limits temporal assessments due to itsdecadal update schedule and spatial assessments due to its restricted number of resolved landcover types (Homer et al. 2007). A dataset that alleviates these two problems, at least forassessments in Florida, is the Florida Land Use/Cover Classification System (FLUCCS)(SWFWMD 2012) dataset that is updated much more often and classifies almost twice as manyspecific land use/cover types as the NLCD (Figure 1). Combinations of the FLUCCS datasetwith supplementary information housed in the NLCD’s percent canopy cover database, countyresidential parcel boundaries, state transportation networks, and digital elevation models allowedus to identify where most of the ecosystems responsible for the production of EGS are located onthe landscape at a neighborhood scale.METHODS AND RESULTSWe estimated EGS production for two alternative neighborhood scale development scenarios.Scenario A was based on the FishHawk Ranch development in the Alafia River basin of TampaBay (Figure 2). Scenario A represents an example of a relatively extensive “green” developmentthat occurred over a period of almost 20 years. Ranched scrub-shrub land was converted to areasof light, medium, and dense residential housing with associated roads, schools, parks, and otherinfrastructure. Scenario B uses the exact spatial boundary as Scenario A, but relocated over anarea in East Tampa that we use as a proxy for a traditional blocked neighborhood layout. Ourcomparison between scenarios is only meant to illustrate how one can complete a neighborhoodscale assessment of EGS differences and should in no way be considered as an endorsement ofeither development approach by USEPA. These types of comparisons could be consideredalongside other benefit cost analysis factors during neighborhood planning.2
Figure 1. Simplified Florida Land Use/Cover Classification System map for the Tampa Bayregion, 2006.3
Figure 2. Location and aerial photograph of Scenario A and B developments.We applied ecosystem service process rates and ecosystem goods stock estimates obtained froman extensive literature review to biophysical features on the landscape using various spatialdatasets. Biophysical attributes, considered here as direct measurements or secondary indicatorsof final ecosystem goods and services, include carbon sequestration for mitigation of climatechange, nitrogen removal for maintaining downstream water quality, atmospheric pollutionremoval for maintaining higher quality air, shading for maintaining lower heating and coolingenergy costs, and water viewscapes and presence of accessible green spaces for maintainingphysical and mental well-being. It should be noted that while ecosystem goods and services seemto overlap, the majority of ecosystem services (ES) are valued on a per year basis since theycontinue to function or produce as long as they are not significantly disturbed while ecosystemgoods (EG) are valued as a stock at a specific point in time and are generally a result of4
ecological processes in the past. For ES that generate regional-scale benefits (e.g., nitrogenremoval and carbon sequestration) we present potential value, while those that are more locallyenjoyed (shading and air pollution removal) are weighted by estimated use and are closer to arealized value of benefits. Realized valuation of ES most often requires a further assessment ofhow they deliver benefits to specific beneficiaries through time so the calculation of realizedvalue for regional and global scale ES requires connecting sources of production to beneficiariesin spatial and temporal scales that are beyond the scope of this report. Ecosystem goods do notgenerate further value unless human demand increases, and or stocks are increased by continuedecological production.Final ecosystem goods and services (FEGS) are biophysical features that human beneficiariescan directly relate to and would, theoretically, be willing to pay to maintain even in the absenceof any other biophysical change (Johnston and Russell 2011; Landers and Nahlik 2013).Biophysical attributes, and the processes producing them, relevant for assessing final ecosystemgoods and services at the neighborhood scale are summarized in Table 1. These FEGS are thentranslated into derived human benefits using various valuation methods (Table 1). In most casesthe beneficiaries are local residents, however for the larger-scale processes of nitrogen removaland carbon sequestration the beneficiary groups, such as downstream water users or thoseaffected by climate change, are associated with both local, but also watershed and global scaleboundaries. We also present the spatial arrangement of biodiversity at the neighborhood scalesince it is difficult to fully translate this biophysical measure into an EGS that directly benefitshuman well-being using a common currency such as US dollars.Table 1. Summary of neighborhood scale metrics used to estimate ecosystem goods and servicesand valuation method used to estimate global, regional, and locally derived benefits.MetricEcosystem ServiceBenefitValuation Method(FEGS)Tree canopy coverageTree canopy coverage(South side of residentialproperty)Rate of carbonsequestrationRate of denitrificationWalking distance to opengreen spaces, trails, andparksNumber of viewablemature treesNumber of viewable waterfeaturesAtmospheric pollution removal(Clean air)Shading (Shade)Increased respiratoryhealthDecreased energy useAvoided medical costsAtmospheric regulation(Stabilized climate)Nutrient removal (Clean water)More predictableclimatic patternsWater of sufficientquality is available tomeet designated usesIncreased opportunityto recreateAvoided social costsIncreased mentalhealth and well-beingIncreased mentalhealth and well-beingHedonic pricing(Accessible green spaces)(Viewable, aestheticallypleasing trees)(Viewable water)Avoided energy costsReplacement costsHedonic pricingHedonic pricing5
Biophysical and value maps were produced for two alternative development scenarios, one basedon the 2009 FishHawk Ranch development and the other using an identically shaped and sizedarea from East Tampa as an example of what this area could have been developed into if a moretraditional block neighborhood layout had been used.The following sections present spatial estimates of biophysical attributes and resulting benefitvaluation estimates for EGS in 2009 for Scenario A (Figure 3) and an alternative developmentpattern Scenario B (Figure 4) taken from East Tampa and representative of a more traditionalblocked development pattern. These two neighborhoods were chosen to represent maximaldifferences between traditional and “green” oriented development patterns. Comparisonsbetween scenario EGS production and values serve to illuminate the tradeoffs society canconsider as areas are developed or redeveloped to meet growing housing needs. Differences inEGS can be positive or negative depending on how the landscape is modified duringdevelopment and how humans interact with remaining or newly constructed neighborhoodbiophysical features.SECTION 1. ECOSYSTEM SERVICESAIR POLLUTION REMOVALAir pollutants are removed when tree canopy intercepts pollutants in the atmosphere. Airpollution removal service through time yields cleaner air, which is important for maintaininghuman respiratory health. The rates of pollutant removal are a function of the downward flux ofthe pollutant and the resistance of the canopy vegetation (Nowak et al. 2006). The canopycoverage of our scenarios were determined by spectral analysis of remotely sensed images,which identified pixels that reflect light in a pattern indicative of tree canopy vegetation. The1 m2 resolution coverage of tree canopy was combined with established pollutant attenuationrates for carbon monoxide, ozone, particles, sulfur dioxide, and nitrous oxide to calculate thetotal air pollutant removal (Nowak et al. 2006).6
Figure 3. Aerial photo (a) and simplified Florida Land Use Cover Classification System (b) mapfor Scenario A in 2009.7
Figure 4. Aerial photo (a) and simplified Florida Land Use Cover Classification System (b) mapfor Scenario B in 2009.8
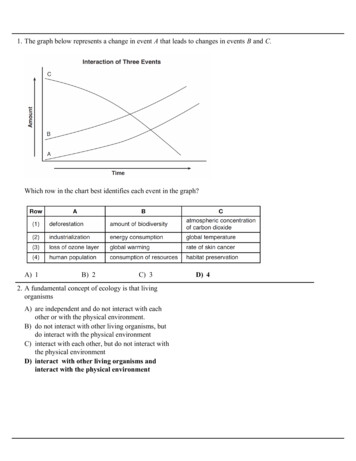
The rate of air pollutants removal (Figure 5) is the sum of the various pollutants attenuated bytree canopy. The rate of downward pollutant flux for each of the species of interest wascalculated by iTree model algorithms (Nowak et al. 2008), and the relative air pollutant costs tohuman health was used to translate the various pollutant attenuation rates to decreases in humanhealth impact costs (Murray et al. 1994). The estimated value for attenuation of the selectedpollutants in 1994 US dollars was 959/ton carbon monoxide, 6,752/ton ozone, 1,653/tonsulfur dioxide, 4,508/ton particulate matter (PM10), and 6,752/ton nitrogen dioxide (Murrayet al. 1994). We applied this 1994 estimate to our 2009 scenarios without year-specificcorrections for inflation.The total air pollutant removal was calculated as:𝐴𝑖𝑟 𝑃𝑜𝑙𝑙𝑢𝑡𝑖𝑜𝑛 𝑅𝑒𝑚𝑜𝑣𝑒𝑑 𝑖 𝑉𝑎𝑙𝑢𝑒𝑖 𝐹𝑙𝑢𝑥𝑅𝑎𝑡𝑒𝑖 %𝐶𝑎𝑛 𝐶𝑒𝑙𝑙𝑆𝑖𝑧𝑒where i represents the individual pollutants, Value is the decrease in costs associated with adecrease in pollutant species, FluxRate is the removal rate of each pollutant by specific species,%Can is the percent canopy cover in each section of the landscape, and CellSize is the area ofeach section in square meters. One meter resolution percent canopy coverage maps were used tocalculate the total air pollution removed in 1994 US dollars ( ) per year using the rastercalculator function in ArcGIS 9.3 (Figure 5). Our Scenario A neighborhood was estimated tohave an air pollution removal service of 7,997 kg of pollutants per year while Scenario B had8,849 kg of pollutants per year. This service is estimated to be worth 0.39 and 0.43 million USper year for Scenario A and B, respectively.SHADINGThe shading service enjoyed by each residential parcel was calculated from the percent canopycover situated to shade buildings (Figure 6). The production of shade is considered an ecosystemservice that continues to provide humans with lower energy needs for cooling. To quantify theamount of shade provided by trees, the center of each parcel was determined and a 25 meterradius semi-circle was drawn on the southern side, representing the area most relevant forshading the south facing section of buildings in the Northern Hemisphere. Then, using aremotely sensed image, the number of 1 m2 canopy pixels was determined in this shadeproviding semi-circle. The number of pixels was then translated into large shade tree equivalentsby dividing by the canopy area of a representative large tree within this community (80 m2). It isimportant to note that shading service is only provided by the ecosystem when houses or otherstructures are present, therefore, before development of this area no shading service could beprovided even though plenty of shade may have been present.9
Figure 5. Development scenarios A and B for air pollution attenuation (A1 and B1)corresponding Ecosystem Service Value (A2 and B2).10
Figure 6. Example of shade tree coverage estimation from satellite imagery (top panel)summarized for the southern side of a parcel (bottom panel).The amount of canopy in a semi-circle from southwest to southeast and corresponding costsavings from shading decreasing energy use were estimated (Figure 7). Shading by trees on thesoutheast and southwest side of a residential house is estimated to reduce energy use by upwardsof 350 kWh per year per 80 m2 of canopy (Simpson and McPherson 1996). Much of this savingstakes place in hotter summer months when energy reductions can get as high as 80 kWh permonth per 80 m2 of south side tree canopy cover (Donovan and Butry 2009; Huang et al. 1987).These values, however, were calculated from residential parcels using almost three times asmany kWh of energy as the average Tampa Bay region resident's use. Thus, energy savings for11
Tampa Bay local residents would be approximately one third of the published value or116.7 kWh a year per 80 m2 of south side tree canopy cover. Tampa Electric’s 2012 electricityrate was estimated at 9.718 cents per kWh based on an average residential customer using 1,200kWh per month on a two-tiered fuel and energy cost rate from Tampa Electric (2012). Costsavings per 80 m2 of tree canopy, assuming a decrease of 26.3 kWh per summer month(Donovan and Butry 2009; Huang et al. 1987) or 116.7 kWh per year (Simpson and McPherson1996) for the average resident in the Tampa Bay region, would equate to close to 3 per monthin summer months and 12 a year. We applied this 2012 estimate to our 2009 scenarios withoutyear specific corrections for inflation. Cost savings will not scale linearly for residents usingmore than the 1,200 kWh average since per kWh energy costs are higher after the first 1,000kWh of use. Tampa Electric customers using 1,200 kWh per month with the equivalent of threelarge 80 m2 trees to the west-southwest of their residence would be estimated to save up to 80kWh per month during summer months from afternoon and evening shading (Simpson andMcPherson 1996). This is equivalent to 7% of summertime energy costs. Our Scenario Aneighborhood was estimated to have a total shading service of 14,724 shade trees while ScenarioB had 16,843 shade trees. This service is estimated to be worth 0.18 and 0.20 million US peryear for Scenario A and B, respectively.12
Figure 7. Development scenarios A and B for number of shade trees per parcel (A1 and B1) andcorresponding Ecosystem Service value (A2 and B2).13
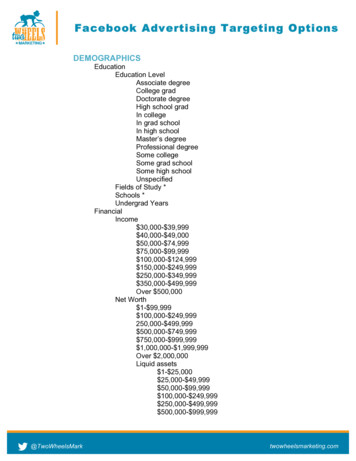
CARBON SEQUESTRATIONCarbon sequestration was estimated by assigning the average rate published in peer-reviewedliterature to specific land use types (Table 2). Literature values were used from studies conductedin similar climates and landscapes. However, there is a scarcity of literature reporting carbonsequestration rates for developed areas, including residential, institutional, commercial,transportation, utility, and communication areas. Therefore, the rate of carbon sequestration forthe urban land use classes was estimated in the canopy and lawn areas for these land use areas bythe following equation:𝑈𝑟𝑏𝑎𝑛 𝐶𝑎𝑟𝑏𝑜𝑛 �� (1 %𝐼𝑚𝑝) 𝐿𝑎𝑤𝑛𝑅𝑎𝑡𝑒 %𝐶𝑎𝑛𝑜𝑝𝑦 �� where %Imp is the average percent impervious surface and %Canopy is the average percentcanopy coverage for the land use category, LawnRate is the average published rate of carbonsequestration for lawns in g C m-2 yr-1 (Bandaranayake et al. 2003; Gebhart et al. 1994; Qian andFollett 2002), and UrbanTreeRate is the published rate for typical Florida urban trees in g C m-2yr-1 (Nowak and Greenfield 2009). Each scenario was reclassified into the carbon sequestrationflux rates in ArcGIS 9.3, and then multiplied by the grid cell area using the spatial analystextension's raster calculator. The result was the rate of carbon sequestration in grams carbonremoved per year per cell (Figure 8). Thus, rates represent averages from several differentstudies with various degrees of accuracy. It should be noted that the carbon sequestration ratesare carbon incorporated into biomass or net primary production and do not reflect long-termcarbon storage or burial rates as this carbon becomes incorporated into soil or wood products.The value of carbon sequestration was estimated using the social cost of carbon. The social costof carbon is an estimate of the monetized damages associated with an incremental increase incarbon emissions for a given year. It is intended to include, but is not limited to, changes in netagricultural productivity, human health, property damages from increased flood risk, and thevalue of ES. The dollar value of carbon reductions in the form of the greenhouse gas carbondioxide was estimated as 20 per ton ( 0.01 per lb) of carbon dioxide in 2010 (US Government2010). We applied this 2010 estimate to our 2009 scenarios without year-specific corrections forinflation. Even without year-specific cost adjustments, the 20 per ton of carbon dioxiderepresents a conservative estimate that has been recalculated as 12 times larger using a lesssevere discount rate more appropriate for intergenerational cost-benefit analysis (Johnson andHope 2012). Carbon sequestration rates were multiplied by the social cost of carbon estimate toarrive at the total value of this ecosystem service that benefits humans by moderating climatechange (Figure 8). Our Scenario A neighborhood was estimated to have a carbon sequestrationservice of 3,807 million kg C per year while Scenario B had 1,115 million kg C per year. This14
service is estimated to be worth 0.76 and 0.22 million US per year for Scenario A and B,respectively.Table 2. Land Use Specific Carbon Sequestration.CarbonFixed intoBiomassMap Value[g C/m2/yr]DescriptionFLUCCSResidential Low Density1100148See MethodsResidential Med Density1200139See MethodsResidential High Density130091See MethodsCommercial And Services140057See MethodsInstitutional170073See MethodsRecreational1800128See MethodsOpen Land1900133See MethodsCropland And Pastureland2100423(Ajtay et al. 1979)Other Open Lands2600673(Ajtay et al. 1979; Milesi et al. 2005)Herbaceous3100743(Ajtay et al. 1979)Shrub And Brushland3200945(Ajtay et al. 1979)Upland Coniferous Forest4100698(Ajtay et al. 1979; Kroeger 2008)Pine Flatwoods4110698(Ajtay et al. 1979; Clark et al. 1999)Hardwood Conifer Mixed4340660(Ajtay et al. 1979; Kroeger 2008)Streams And Waterways5100180(Ajtay et al. 1979)Lakes5200397(Carpenter et al. 1998; Carrick et al. 1993)Reservoirs5300368(Carpenter et al. 1998; Carrick et al. 1993)Stream And Lake Swamps6150808(Lugo et al. 1988)Freshwater Marshes6410618(Smith and De Laune 1983)Wet Prairies6430142(Kroeger 2008)Emergent Aquatic Vegetation6440142(Kroeger 2008)Intermittent Ponds6530142(Kroeger 2008)Transportation810096See MethodsCommunicationsUtilities82008300106133See MethodsSee MethodsReference15
Figure 8. Development scenarios A and B for carbon sequestration (A1and B1) andcorresponding Ecosystem Service value (A2 and B2).NITROGEN REMOVALExcess reactive nitrogen in water results in eutrophication and ground water contamination(Vitousek et al. 1997). Nitrogen removal helps maintain downstream waters at a sufficientquality for the designated use of the water body. Appreciable amounts of nitrogen can beremoved from the landscape through enzymatic denitrification. Scientific literature has reportedestimates of this landscape process for land use types, based on case studies in settings in theFlorida area or in similar landscapes. Similar to carbon, the rate of denitrification was estimatedusing literature rates assigned to undeveloped areas and calculated rates for urbanized areas(Table 3). As denitrification occurs in the soil, the mass of nitrogen denitrified in the previousarea was calculated by:16
𝑈𝑟𝑏𝑎𝑛 ��𝑜𝑛 (1 %𝐼𝑚𝑝) 𝐷𝑒𝑛𝐿𝑎𝑤𝑛 𝐶𝑒𝑙𝑙𝑆𝑖𝑧𝑒where DenLawn is the denitrification rate published for urban lawns (Raciti et al. 2011). The%Imp, percent impervious surface, was derived from a 1 m2 resolution land cover map. Similarto the method used for estimating carbon sequestration, each land use area was reclassified usingthe denitrification flux rates (Table 3) multiplied by area. The result was the rate of nitrogenremoved via denitrification in grams nitrogen removed per year (Figure 9).Costs for removing a pound of nitrogen in water coming from various sources range from lessthan 10 to as high as 855. Costs increase as the nitrogen becomes harder to route towardstreatment areas and as simpler, more cost efficient mechanisms for removing nitrogen need to bereplaced by more centralized advanced waste water treatment facilities. Compton et al. (2011)reviewed the cost of removing nitrogen from a wide range of sources and concluded that costsranged from 1.22 - 43.54 per pound of nitrogen ( 2.71 - 96 kg-1). Abatement costs ofreducing nitrogen from point sources are estimated as 8.16 per pound ( 18 kg-1) of nitrogen(Birch et al. 2011). We use 8.16 per pound as our conservative estimate of what it would cost toreplace the ecosystem service of removing nitrogen for the purpose of maintaining usable waterbased on using traditional waste water treatment to remove nitrogen from upstream point sources(Figure 9). We applied this 2011 estimate to our 2009 scenarios without year-specific correctionsfor inflation. Our Scenario A neighborhood was estimated to have a carbon sequestration serviceof 5.143 million kg N per year while Scenario B had 1.321 million kg N per year. This service isestimated to be worth 0.93 and 0.24 million US per year for Scenario A and B, respectively.Several lifecycle estimates, however, including upgrading and maintaining existing or buildingadditional advanced wastewater treatment facilities and drainage structures to remove nitrogen,put the cost as high as 855 per pound ( 388 kg-1) of nitrogen removed (Roeder 2007). Thishigher ecosystem replacement value may be more appropriate than our more conservativenumber if one wants to illustrate the potential future value of bay habitats under a scenario ofincreasing demand for nitrogen removal.17
Table 3. Land Use Specific Denitrification Rates.DescriptionFLUCCSDenitrificationMap ValueReference[g N/m2/yr]Residential Low Density11001.3See MethodsResidential Med Density12001.13See MethodsResidential High Density13000.85See MethodsCommercial And Services14000.62See MethodsInstitutional17000.87See MethodsRecreational18001.4See MethodsOpen Land19001.4Cropland And Pastureland21000.72See Methods(Barton et al. 1999; Espinoza 1997; Robertson etal. 1987; Tsai 1989)Other Open Lands26000.82(Barton et al. 1999; Tsai 1989)Herbaceous31000.06(Tsai 1989)Shrub And Brushland32000.06(Tsai 1989)Upland Coniferous Forest41000.12(Barton et al. 1999; Robertson et al. 1987)Pine Flatwoods41100.12(Barton et al. 1999; Robertson et al. 1987)Hardwood Conifer Mixed43400.19Streams And Waterways510020.73Lakes520012.29(Barton et al. 1999)(Piña-Ochoa and Álvarez-Cobelas 2006;Seitzinger et al. 2006)(James et al. 2011; Piña-Ochoa and ÁlvarezCobelas 2006; Seitzinger 1988)Reservoirs53007.5Stream And Lake
removal for maintaining higher quality air, shading for maintaining lower heating and cooling energy costs, and water viewscapes and presence of accessible green spaces for maintaining . Johnston and Russell 2011; Landers and Nahlik 2013). Biophysical attributes, and the processes producing them, relevant for assessing final ecosystem