Transcription
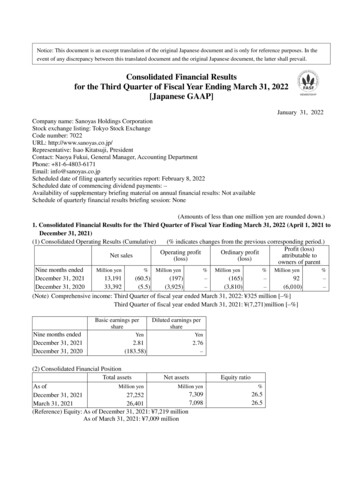
Notice: This document is an excerpt translation of the original Japanese document and is only for reference purposes. In theevent of any discrepancy between this translated document and the original Japanese document, the latter shall prevail.Consolidated Financial Resultsfor the Third Quarter of Fiscal Year Ending March 31, 2022[Japanese GAAP]January 31, 2022Company name: Sanoyas Holdings CorporationStock exchange listing: Tokyo Stock ExchangeCode number: 7022URL: http://www.sanoyas.co.jp/Representative: Isao Kitatsuji, PresidentContact: Naoya Fukui, General Manager, Accounting DepartmentPhone: 81-6-4803-6171Email: info@sanoyas.co.jpScheduled date of filing quarterly securities report: February 8, 2022Scheduled date of commencing dividend payments: –Availability of supplementary briefing material on annual financial results: Not availableSchedule of quarterly financial results briefing session: None(Amounts of less than one million yen are rounded down.)1. Consolidated Financial Results for the Third Quarter of Fiscal Year Ending March 31, 2022 (April 1, 2021 toDecember 31, 2021)(1) Consolidated Operating Results (Cumulative)(% indicates changes from the previous corresponding period.)Profit (loss)Operating profitOrdinary profitNet salesattributable to(loss)(loss)owners of parentNine months endedMillion yen% Million yen% Million yen% Million yen%December 31, 202113,191(60.5)(197)–(165)–92–December 31, ) Comprehensive income: Third Quarter of fiscal year ended March 31, 2022: 325 million [–%]Third Quarter of fiscal year ended March 31, 2021: (7,271)million [–%]Basic earnings pershareNine months endedDecember 31, 2021December 31, 2020Yen2.81(183.58)Diluted earnings pershareYen2.76–(2) Consolidated Financial PositionTotal assetsNet assetsMillion yenMillion yenAs of7,309December 31, 202127,2527,098March 31, 202126,401(Reference) Equity: As of December 31, 2021: 7,219 millionAs of March 31, 2021: 7,009 millionEquity ratio%26.526.5
2. DividendsAnnual dividends1st2nd3rdYear-endquarter-end quarter-end quarter-endYenYenYenTotalYenFiscal year ended–0.00–5.00March 31, 2021Fiscal year ending–0.00–March 31, 2022Fiscal year endingMarch 31, 20225.00(Forecast)(Note) Revision to recently disclosed projected cash dividends: NoneYen5.005.003. Consolidated Financial Results Forecast for the Fiscal Year Ending March 31, 2022 (April 1, 2021 to March31, 2022)(% indicates changes from the previous corresponding period.)Net salesMillion yen%Operating profitOrdinary profit(loss)(loss)Million yen%Million yenProfit (loss)attributable toowners of parent%Basic earningsper shareMillion yen%YenFull year20,000 (55.2)600–500–300(Note) Revision to recently disclosed projected consolidated financial results: None–9.16* Notes:(1) Changes in significant subsidiaries during the period under review (changes in specified subsidiaries resulting inchanges in scope of consolidation): None(2) Adoption of special accounting methods for preparing quarterly consolidated financial statements: None(3) Changes in accounting policies, changes in accounting estimates and retrospective restatement1) Changes in accounting policies due to the revision of accounting standards: Yes2) Changes in accounting policies other than 1) above: None3) Changes in accounting estimates: None4) Retrospective restatement: None(4) Total number of issued shares (common shares)1) Total number of issued shares at the end of the period (including treasury shares):December 31, 2021: 33,122,120 sharesMarch 31, 2021: 32,890,166 shares2) Total number of treasury shares at the end of the period:December 31, 2021: 47,214 sharesMarch 31, 2021: 45,742 shares3) Average number of shares during the period:Nine months ended December 31, 2021: 32,982,271 sharesNine months ended December 31, 2020: 32,743,124 shares* These consolidated financial results are outside the scope of audit* Explanation of the proper use of financial results forecast and other notesThe earnings forecasts and other forward-looking statements herein are based on information currently availableand certain assumptions deemed reasonable. Actual results may differ significantly from these forecasts due to awide range of factors.
2. Quarterly Consolidated Financial Statements [Japanese GAAP](1) Quarterly Consolidated Balance Sheets [Japanese GAAP](Million yen)As of March 31, 2021AssetsCurrent assetsCash and depositsNotes and accounts receivable - tradeContract assetsElectronically recorded monetary claims - operatingMerchandise and finished goodsWork in processRaw materials and suppliesOtherAllowance for doubtful accountsTotal current assetsNon-current assetsProperty, plant and equipmentBuildings and structures, netMachinery and equipment, netLandOther, netTotal property, plant and equipmentIntangible assetsSoftwareGoodwillOtherTotal intangible assetsInvestments and other assetsInvestment securitiesDeferred tax assetsNet defined benefit assetOtherAllowance for doubtful accountsTotal investments and other assetsTotal non-current assetsTotal 71,0603,72886306339(9)4,45112,76226,4011As of December 31, 20214,15383322310(8)4,86113,66927,252
(Million yen)As of March 31, 2021LiabilitiesCurrent liabilitiesNotes and accounts payable - tradeShort-term loans payableCurrent portion of long-term loans payableIncome taxes payableAdvances receivedContract liabilitiesProvision for bonusesProvision for construction warrantiesProvision for removal cost of property andequipmentLease obligationsOtherTotal current liabilitiesNon-current liabilitiesLong-term loans payableLease obligationsDeferred tax liabilitiesNet defined benefit liabilityAsset retirement obligationsOtherTotal non-current liabilitiesTotal liabilitiesNet assetsShareholders’ equityCapital stockCapital surplusRetained earningsTreasury sharesTotal shareholders’ equityAccumulated other comprehensive incomeValuation difference on available-for-sale securitiesDeferred gain (loss) on hedgesForeign currency translation adjustmentRemeasurements of defined benefit plansTotal accumulated other comprehensive incomeShare acquisition rightTotal net assetsTotal liabilities and net assets2As of December 31, 897,30927,252
(2) Quarterly Consolidated Statements of Income and Consolidated Statements of Comprehensive Income[Japanese GAAP]Quarterly Consolidated Statements of Income [Japanese GAAP](Million yen)Nine Months ended December Nine Months ended December31, 202031, 2021Net salesCost of salesGross profitSelling, general and administrative expensesOperating lossNon-operating incomeInterest incomeDividend incomeForeign exchange gainsShare of profit of entities accounted for using equitymethodOtherTotal non-operating incomeNon-operating expensesInterest expensesOtherTotal non-operating expensesOrdinary lossExtraordinary incomeGain on sales of investment securitiesOtherTotal extraordinary incomeExtraordinary lossProvision of allowance for loss on sales of shares ofsubsidiaries and associatesLoss on valuation of investment securitiesTotal extraordinary lossLoss before income taxesIncome taxes – currentIncome taxes – deferredTotal income taxesProfit (loss)Profit (loss) attributable to owners of )9292
Quarterly Consolidated Statements of Comprehensive Income [Japanese GAAP](Million yen)Nine Months ended December31, 2020LossOther comprehensive income loss (loss)Valuation difference on available-for-sale securitiesDeferred gain (loss) on hedgesForeign currency translation adjustmentRemeasurements of defined benefit plans, net of taxComprehensive loss (income) of affiliates accounted forby the equity method attributable to the companyTotal other comprehensive income (loss)Comprehensive incomeComprehensive income (loss) attributable toOwners of the parentNon-controlling interests(6,010)92(1,371)(13)7842194128834NIne Months ended December31, 2021-(1,260)(7,271)233325(7,271)-325-
(Segment Information)Ⅰ Nine months Ended December 31, 2020 (April 1, 2020 to December 31, 2020)Information concerning Net sales and Operating profit or loss by Reportable business segment(Million yen)Adjustments( Note 1)Amountrecorded inquarterlyconsolidatedstatements ofincome( Note 2)-33,392Reportable segmentMachinery /Shipbuilding & Equipment &Engineering Services forBusinessManufacturingIndustryMachinery /Equipment &Services forConstructionIndustryLeisurebusinessTotalNet salesExternal ent profit (loss)(3,034)21824(3,156)(769)(3,925)Internal sales ortransfers(363)(Note 1) Details of “Adjustments” are as follows:Adjustments for the segment profit or loss of (769) million include corporate cost of (791) million not allocated to eachreportable segment, allowance for doubtful accounts of 2 million and elimination of inter-segment transaction of 19million.Corporate cost consists of general and administrative expenses which do not belong to the reporting segment.(Note 2) Segment profit or loss is adjusted with operating loss recorded in the quarterly consolidated statements of income.Ⅱ Nine months Ended December 31, 2021 (April 1, 2021 to December 31, 2021)Information concerning Net sales and Operating profit or loss by Reportable business segment(Million yen)Reportable segmentMachinery /Equipment &Services forManufacturingIndustryMachinery /Equipment &Services for Leisure businessConstructionIndustryAdjustments( Note 1)TotalAmountrecorded inquarterlyconsolidatedstatements ofincome( Note 2)Net salesGoods transferred at apoint in timeGoods transferred overtimeRevenue from contactswith customersExternal salesInternal sales or transfersTotalSegment profit 4213,191-13,19154958151760(958)(197)(Note 1) Details of “Adjustments” are as follows:Adjustments for the segment loss of (958) million include corporate cost of (969) million not allocated to each reportablesegment, allowance for doubtful accounts of (0) million and elimination of inter-segment transaction of 11 million.Corporate cost consists of general and administrative expenses which do not belong to the reporting segment.(Note 2) Segment loss is adjusted with operating loss recorded in the quarterly consolidated statements of income.5
(Note 3) We have changed our business segmentation from "M&T business" to "Machinery / Equipment & Services forManufacturing Industry", "Machinery / Equipment & Services for Construction Industry", and "Leisure business” since thebeginning of the first quarter of the current consolidated fiscal year due to the transfer of shares of Sanoyas ShipbuildingCorporation to SHIN KURUSHIMA DOCKYARD CO., LTD. The segment information for the previous period is restatedto current period presentation.6
3. Supplementary informationStatus of sales and ordersSegmental salesNine months ended December 31, 2020(April 1, 2020 to December 31, 2020)SegmentComposition ratio(Million yen)(%)Shipbuilding &21,36964.0EngineeringMachinery / Equipment& Services forManufacturing IndustryMachinery / Equipment& Services forConstruction IndustryLeisure BusinessTotalLeisure 136.31,3854.11,74213.233,392100.013,191100.0Order status and backlog of ordersNine months ended December 31, 2020(April 1, 2020 to December 31, 2020)SegmentOrdersBacklog of orders(Million yen)(Million yen)Shipbuilding &EngineeringMachinery / Equipment& Services forManufacturing IndustryMachinery / Equipment& Services forConstruction IndustryNine months ended December 31, 2021(April 1, 2021 to December 31, 2021)Composition ratio(Million yen)(%)Nine months ended December 31, 2021(April 1, 2021 to December 31, 2021)Orders(Million yen)Backlog of orders(Million 55(Note) The amount of orders received and order backlogs for rental of temporary construction-use elevators are included inMachinery / Equipment & Services for Construction Industry Segment since the beginning of the first quarter of thecurrent consolidated fiscal year. Following the change, the amounts for the previous period have been changed to includethe amount of orders received and order backlogs for rental of temporary construction-use elevators.7
2. Quarterly Consolidated Financial Statements [Japanese GAAP] (1) Quarterly Consolidated Balance Sheets [Japanese GAAP] (Million yen) March 31As of , 2021 As of December 31, 2021 Assets Current assets Cash and deposits 5,612 6,302 Notes and accounts receivable - trade 4,155 3,029 Contract assets - 309