Transcription
Report BuilderUser's Guide
IReport Designer HelpTable of ContentsForeword0Part I Report Builder41 Overview. 42 How To. 7Template Files. 7Add Fields. 8Receive Filters. 10Adjust Search. 11More Help . 123 Workspaces . 13About the Report.Designer13Data Workspace. 13Design Workspace. 14Preview Workspace. 154 Data-Specific.Tools16Database. 16DataView. 17Data pipeline . 18SQL. 18Query Wizard. 18Query Designer. 225 Report-Building.Tools26About report-building.tools26Report Wizard. 27Label Template.Wizard33CrossTab Wizard. 346 Toolbars. 35About toolbars. 35Advanced Component.Palette35Align or Space.Toolbar36Data Component.Palette36Data Tree. 36Draw Toolbar. 37Standard Toolbar. 37Edit Toolbar . 38Format Toolbar. 39Nudge Toolbar. 39Report Tree . 39Standard Component.Palette407 Bands. 40About Bands . 40Header. 41Group. 42Group Header. 42Detail. 43Footer. 44Copyright
ContentsIIGroup Footer. 44Summary. 45Title. 468 Components. 46Advanced. 46CrossTab. 46Region . 46SubReport. 47Standard. 47BarCode . 47Checkbox. 47Image . 47Label. 47Line. 47Memo . 48RichText . 48System Variable. 48Shape . 48Variable . 48Data-aware . 48DBBarCode. 48DBCalc . 49DBCheckBox. 49DBImage . 49DBMemo . 49DBRichText. 49DBText . 49Speed Menu Options. 50AutoSize . 50Bring to Front. 50Configure. 50DisplayFormat. 50Edit. 50Lines. 50MailMerge. 50MaintainAspectRatio. 51Pagination. 51ParentHeight. 51ParentWidth. 51Position . 51ReprintOnOverFlow. 51Send to Back. 51ShiftRelativeTo. 52StretchWithParent. 52ShiftWithParent. 52Stretch . 52Style. 52SuppressRepeatedValues. 52Visible . 52Static VS. Stretchable. 53Stretchable. 53Static. 539 ReferenceCopyright . 54
IIIReport Designer HelpGlossaryIndex. 5460Copyright
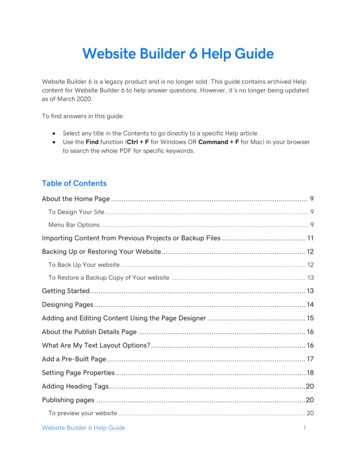
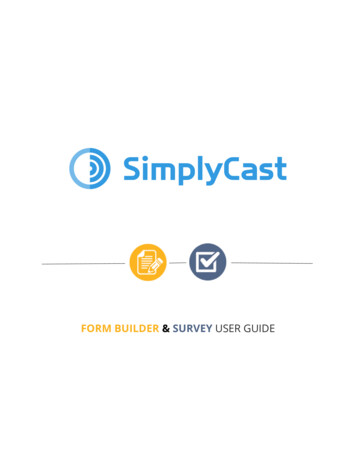
Report Builder14Report BuilderINTRODUCTION- REPORT BUILDERExpressMaintenance includes an extremely powerful built-in Report Builder. Report Builder unleashesyour data to be reported and exported virtually any way you can imagine.Report Builder is developed by Digital Metaphors Corporation and offers ExpressMaintenance usersthe maximum in data reporting flexibility. This help section was designed by Digital MetaphorsCorporation and is made available through the ExpressMaintenance help system.Designing custom reports does require some familiarity with database concepts. Using the reportbuilder is an easy process but may take a little practice. We recommend you start with simple listreports and then work up to more complicated reports.You will find this help to covers the Report Builder features and tools. However, it does not addressthe concepts of data structures. Most of the data will be self explanatory since it is your maintenancedata. Additional help is available.For additional help:· Do not contact Digital Metaphors directly as they do not provide end user tech support.· Visit the Report Builder site to learn more about Report Builder at: http://digital-metaphors.com/· Consult this help file completely and practice with simple reports.· Download, install the Report Builder Learning System provided by Digital Metaphors and availablefrom our website at: · Contact Express Technology tech support via email for specific help WIn an overview to ReportBuilder, the reporting equation is described. The reporting equationdivides reporting into four main activities:With ReportBuilder Pro, you get a complete set of components that enable end-users toperform the data access, report layout, and report output activities of the reporting equation.This goal is achieved by delivering visual, easy-to-use solutions. This screen shot of theReportBuilder Pro Report Designer shows the ergonomic design of the user-interface.DataWithin the work environment of the Data tab, end users can quickly create dataviews, whichcan then be used to supply data to reports. Dataviews are usually created via the Query Wizardor Query Designer. Both of these tools are visual; they also allow the end-user to select thetables, fields, search criteria, and sort order necessary for the report. Behind the scenes, anSQL statement is generated and used to retrieve the data from the database. A screen shot of aCopyright
5Report Designer Helpcompleted dataview is shown below.The solution described above is the standard behavior within the data workspace. However,the developer can customize this user-interface by doing one of three tasks:· Register a replacement query wizard or query designer.· Remove the query wizard or query designer.· Create new dataview template classes that can simplify the data selection process evenfurther by establishing the relationship between the tables in the database andpresenting an alternative user-interface (such as a single form that allows search/sortcriteria to be entered).The bottom-line is that the Data area contains a turnkey solution that can be used out-of-thebox, but if customizations are needed, an architecture has been provided so that thosecustomizations are possible.DesignThe Design workspace contains the actual layout of the report. The user-interface is identicalto the one presented to developers using ReportBuilder at Delphi design-time; in other words,it is full-featured and professional. The Office97 interface-style makes the Design workspaceespecially easy to learn for end users. A Report Wizard is available for creating reportsquickly. You can customize this interface by replacing any of the dialogs it uses and byregistering your own report wizards.Copyright
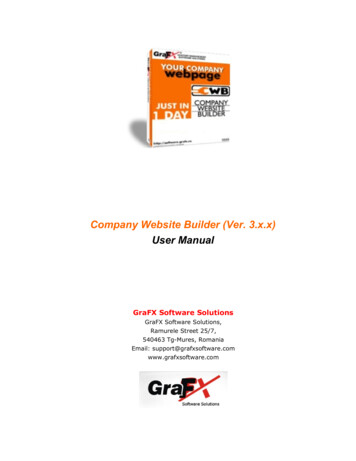
Report Builder6PreviewThe Preview workspace contains the rendered report. The report can be printed to the printeror to various file formats from this workspace.Copyright
71.2Report Designer HelpHow ToHOW TO .Below are common questions presented by users concerning the use of the Report Builder:····How do I import / export report templates into the application?How do I add fields or adjust the layout of a report?How can I make my report receive filters from ExpressMaintenance?How to make a report include all of the data records I expect?· How can I get comprehensive help or a tutorial on Report Builder?You can download original report definitions for all reports - click here for list.1.2.1Template FilesHow do I import / export report templates into the applications?All Express Technology applications have a feature that allows users to import and export reportformats to report template files. Exporting a report to file is very helpful if you want to save a reportCopyright
Report Builder8template to a text (.rtm, .rdf*, .ini or .txt) file before making alterations. Or, you might want to export areport template to a text file and email it to our support staff.Occasionally, our support staff may make a custom alteration to a report and email it to you forimporting. Or, you may want to import one of the original report formats.The text file produced by exporting reports contains the report template / layout. It does not containdata but rather the report setup. The following is a brief description of how to import and export reportsformats. Do not confuse this with exporting data resulting from a report.Caution: If you have customized the standard reports in ExpressMaintenance, importing a reporttemplate file will overwrite your existing reports. You should save any customized reports to a newname before importing report template files.Exporting Report Template (Formats)1. Run the application such as ExpressMaintenance.2. Open the applicable report screen. Example: Maintenance / Reports.3. Locate the desired report in the list of reports in the right panel.4. Right click on the report and the popup menu will appear.5. Left click on the "Export Select Report to File" option.6. Select the desired destination folder where the report will be exported using the report name withthe .rtm (or .rdf*) extension.7. Email the .rtm file as an attachment or keep it as a backup.Importing Report Template Files (Formats)1. Locate the desired report template file and download - click here for list. Note: Some browsersrequire that you right click on the desired file in order to download.2. Or, if emailed, save the report (.rtm) file to disk, noting the folder where the file is saved.3. Run the application such as ExpressMaintenance.4. Open any report screen. Example: Maintenance / Reports.5. Right click on any report and the popup menu will appear.6. Left click on the "Import Report(s) from File" option.7. Use the windows dialog box to locate the report template (.rtm) file.8. Click the Open button to open the file.9. The report will be imported and a dialog will reflect the completion.*Note: The file types for some applications which use the Shazam Report Designer is *.rdf (reportdefinition file). Applications are being converted to the Report Builder which use *.rtm files.You can download original report definitions for all reports - click here for list.1.2.2Add FieldsHow do I add fields or adjust the layout of a report?ExpressMaintenance includes a very powerful built-in report builder. All of the standard reportsincluded with ExpressMaintenance are built using the report builder. It is often desirable to adjustreports to include or exclude certain fields. While you can develop new reports from scratch, it isusually easiest to edit an existing report that is close to the desired results.This example will show how to alter a simple report. It provides some introductory concepts of usingthe report builder. More advance uses of the report builder are certainly possible. However, it is best tohave some knowledge of database and report design concepts.You should make sure your toolbars are Turned-On in the Report Builder. You can do this under View /Toolbars. We recommend turning everything but Data Tree and Data Tree. You can also arrange theCopyright
9Report Designer Helptool bars by dragging them around in the window.The report used in this example is the Units List By Location report. We will add the Unit number fieldto the report. Adding a field to a report involves two primary steps. All reports are made up of twobuilding blocks which produce the report that is previewed and printed. These include:1.2.Query to extract the desired dataLayout / design presentation of the dataFirst, the field must be included in the query (search) and be included as part of the returned results.Secondly, the data field must be included in the report design to appear on the report.Add Data Field To The Query1. Run the Unit List By Location report to preview on the screen.2. Click on the Data tab of the report builder.3. The Units table will appear as a box in the upper left portion of the screen.4. The Units window includes several buttons that make up the Query Designer.5. Click on the Fields button to open the Query Designer to the Fields tab.6. The upper section reflects the available fields and lower section reflects selected fields.7. Add the "Unit" (for example) field to the report query by locating the "Unit" field in the uppersection and double click on it. This adds the Unit field to the bottom portion of the screen.8. Edit the query filter criteria using the operator and value desired. When using Between,sperate values with a comma.9. Check AutoSearch to make the query dynamic, meaning it can be changed each time thereport is executed. Check mandatory to require the filter each time.10. Click the Ok button to save the changes in the Query Designer.12. You can view the raw query results by clicking on the Preview button in the Units window.13. To learn more about the Query Designer, review the help under Report Builder.Add Field To The Layout1. Click on the Design tab of the report designer.2. Locate the Data Components toolbar which is on the top row by default. The first buttonappears to have an "A" in front of a table. When pointing at the button, the popup hint reads"DBText". This component is for displaying standard data fields. If adding a memo field, youwill want to use the DBRichText component follow these steps plus notes below.3. Click the DBText button and then click in the Detail band of the report layout. A DBTextcomponent will be place in that location.4. Click the Place tab in the Page Designer dialog.5. Size and adjust the DBText component as desired.6. Left click on the DBText component and then look in the upper section to locate the tableData Pipeline and Data Field drop down selection fields.7. Select the Units Data Pipeline if not already selected.8. For the Data Field, drop down the list and select the desired field such as Unit. Thisassociates the DBText component with the Unit number field.9. Click the Preview to view the results.10. To add a label for the Unit field, click on the Label component and place it in the header band.In the upper section, edit the caption of the label to read "Unit Number" or other desired value.11. Click the Preview tab to view the results.12. On exit of the report, save your changes.Other Notes1. If you are placing a notes field in the report, use a DBRichText component rather than aDBText component. You will also need to set the band to dynamic height and the componentto stretch.2. If you are placing a graphic field in the report, use a DBImage component rather than aDBText component. You will also need to set the band to dynamic height and the componentto stretch.Copyright
Report Builder3.10For more comprehensive help on the report builder, view the help or other Tech Bulletins.You can download original report definitions for all reports - click here for list.1.2.3Receive FiltersHow can I make my report receive filters from ExpressMaintenance?When a report is run in ExpressMaintenance, it first clears all filters in the report unless they aremarked as mandatory. Next, the program checks the filters selected in the report filters panel(example: Type or Category). For each filter that contains a value other than " All ", the programattempts to pass the filter to the report. If filtering is successful, ExpressMaintenance also populatesthe "Params" text field in the report if it exist.You should make sure your toolbars are Turned-On in the Report Builder. You can do this under View /Toolbars. We recommend turning everything but Data Tree and Data Tree. You can also arrange thetool bars by dragging them around in the window.The program can only pass filters to fields that exist in the tables being used in the Data tab of thereport. The field does not have to be in the query result set but it does have to be part of the table. Inorder for the filter to be applied, the corresponding field name must exist in the table(s) that are in thequery but does not have to be used in the Layout.To view the available field in a query, follow these steps:1. Run the Unit List By Location report to preview on the screen.2. Click on the Data tab of the report builder.3. The Units table will appear as a box in the upper left portion of the screen.4. The Units window includes several buttons that make up the Query Designer.5. Click on the Fields button to open the Query Designer to the Fields tab.6. The upper section reflects the available fields and lower section reflects selected fields.
the report builder. More advance uses of the report builder are certainly possible. However, it is best to have some knowledge of database and report design concepts. You should make sure your toolbars are Turned-On in the Report Builder. You can do this under View / Toolbars. We recommend turning everything but Data Tree and Data Tree.