Transcription
FINANCIAL SERVICESEuropeanAsset Management StudyTHE DISCOMFORT ZONE –DEFINING A DISTINCTIVE STRATEGY FOR EUROPEAN ASSET MANAGERS2019DATA PROVIDED BY MORNINGSTAR
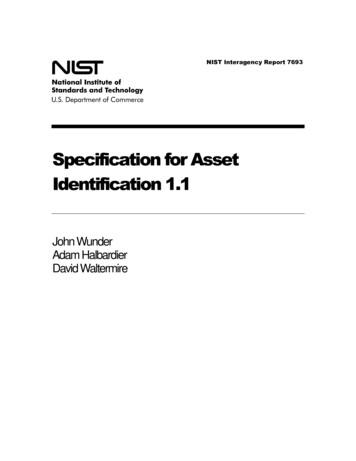
2MANAGEMENT SUMMARYTime to leave the comfort zoneThe asset management industry has been growing rapidly for years with 2017 being an exceptional year in termsof net new money flows. However, its growth in terms ofassets under management is on average three-quartersdependent on market performance. Also, the strong increase of bond and equity markets has so far hiddenthe fact that revenues are falling and costs are still toohigh for sustainable profitability. As 2018 was the firstyear with falling markets after a long bullish phase, theindustry now finds itself in the discomfort zone. Weakgrowth and increasing pressure on revenues are causingespecially the middle ground to collapse, and companies urgently need to carve out a distinctive position forthemselves. One option is to tap into economies of scaleand reshape the business model accordingly. The otheris to specialise and focus on the quality of products andservices as well as innovation.To get a picture of the current state of the market andthe outlook for the years ahead, we carried out a major survey of asset managers with a strong Europeanfootprint. The results prove revealing. Not only do theyprovide many unique insights, they also explode somecommon industry beliefs, such as the idea that simplyhaving a large share in retail1 business or non-traditionalstrategies in and of itself increases the chances of beingprofitable. To look ahead, we present three possible scenarios for future market developments and discuss theimpact of each scenario on the profitability and growthof different types of players and business models.Using the survey’s findings, we formulate recommendations for asset managers in five key areas:Dr. Carsten WittrockPartnerNorman J. KarrerPartnerThe authors would like to thank our colleagues RasmusMumme, Anna Katharina Tsitsirikos, Sarina Neumann,Kathrin Nadenau and Nicolas Seiler for their help insetting up the study and improving previous versions.1. Define a clear strategic position since asset managers who cannot win through economies of scalemust focus on areas where they can generate competitive advantages2. Professionalise distribution and sales managementand adapt distribution channels to digital customerneeds not only in retail but also in institutional assetmanagement3. Review pricing and revenue sources as pricingshould be more strongly correlated to the value generated for the client which does not only include thepure investment performance but also other servicesprovided to the client4. Reduce cost levels and digitalise operations inorder to exploit the potential of new technologies –asset managers must either develop digital solutions themselves or build on existing solutions fromother asset managers and technology providers5. Leverage digitalisation opportunities and takedata management to the next level because aclear data strategy from storage to analytics canboost asset managers’ performance along the value chain from portfolio and risk management todistributionThese recommendations are not new. In fact the industry has been talking about them for several years. Butnow is the time to start acting.Following these recommendations will be uncomfortable for many asset managers. But our message isclear: If asset managers hope to survive on the market,it is time for them to leave their comfort zone.Maria Katharina HeidenManagerAdditionally, they would like to thank Axel Sarnitz, Wolfgang Schlaffer, Bertrand Lavayssière, Arnd Heßeler andDaniel Crow for their valuable comments and fruitfuldiscussions on the topic.1 Within this survey, retail business refers to the end client segment irrespective of the distribution channel which can target private clients (be it in theretail, private banking or wealth management segment) directly (e.g. via robo advisors) or indirectly (often referred investments (e.g. real estate,infrastructure), all with higher fee levels than thoseenforceable for traditional assets and plain vanillastrategies. A larger proportion of such investmentstrategies in a company’s portfolio obviously haspositive effects on the overall revenue margin butdoes in fact not necessarily boost its profit margins.A third, equally prevalent myth is that asset management firms with products that perform below thebenchmark inevitably suffer from weak profit margins. Over a period of five years, only 9 percent ofthe actively-managed multi-asset funds managedby firms in the survey outperformed a mixed globalexchange-traded fund (ETF) benchmark and just 7percent of the actively-managed global equity fundsoutperformed the global ETF benchmark (MSCI ACWorld) whereas 43 percent of the actively-managedEuropean equity funds outperformed the EuropeanETF benchmark (Euro Stoxx 50). Yet, for none of thesethree strategies product performance is significantlycorrelated to firms’ profit margins. Having said that,we cannot generalise our findings in this respect asthey are based on a limited range of strategies eventhough these are considered as the basic disciplinesin asset management. Nevertheless, as transparencyincreases, driven by regulation, we would indeed expect to see some correlation here in the future, supported by another trend that increasingly sees money directed to “winners” reflected by outperformingstrategies, and/or (very) good product ratings and/or innovations.Myth versus reality: high shares of retail business or non-traditional strategies are not significant indicators of a successfulbusiness model and individual company performance40Profit margin 2017 (in bps)Profit margin 2017 (in bps)4030No significantcorrelation2010002040608010030No significantcorrelation201000Share of assets under management in retail business (in %)Shrinking companiesNeutral companiesSource: zeb.research, based on sample; MorningstarFigure 7: K ey drivers of profit marginsProfitably growing companies10203040Share of non-traditional strategies (in %)50
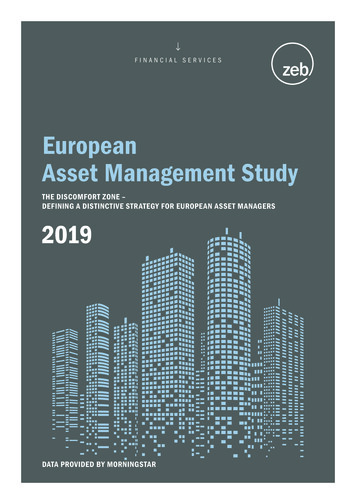
13Bertrand Lavayssière, Partner, London“Our study shows that merely having a large share in a high revenue margin business likeretail or alternative investments does not guarantee good profitability. More than ever aclear and focused business model with a visible USP shows the right way for a sound businessto build a sustainable winning position”ETF mixed European2)Multi asset fundsETF mixed global2)ETF MSCI AC WorldGlobal equity fundsETF MCSI World4040Underperformance30Profit margin (in bps)Profit margin (in bps)UnderperformanceNo significantcorrelation20100–2048121630No significantcorrelation20100–2048125Y performance in % p.a.5Y performance in % p.a.Only 3 funds (10%) in sample above mixedglobal ETF benchmarkOnly 2 funds (7%) in sample above global ETFbenchmark (MSCI AC-World)1)161)European equity fundsETF MSCI Europe40ETF Euro Stoxx 50Profit margin (in bps)Underperformance30 Shrinking companiesNo significantcorrelation10TER Total expense ratioSource: Reuters, zeb.research–20 Profitably growingcompanies1) Net return p.a. over 5 years (01/01/2013–31/12/2017), for 8 funds sinceinception due to shorter life time; retail tranche; avg. TER 1.7% p.a.2) E TF mixed European 50% EuroStoxx 50 50% Euro Government Bonds,ETF mixed global 50% MSCI World Global Government Bonds;avg. ETF TER 0.15% p.a.; unhedged in ;200Neutral companies4812165Y performance in % p.a.1)15 funds (44%) above European ETF benchmark(Euro Stoxx 50)Figure 8: Performance of funds actively managed by sample asset managers and respective profit margins
14Maria Katharina Heiden, Manager, Hamburg“Performance is key: it is not everything but without it everything else is nothing. Asachieving sustainable outperformance by active management proves difficult, performanceof asset managers needs to be re-defined. In addition to investment performance clientaccess, convenience and specific services serve as factors that contribute to clients’ satisfactionand allow for new pricing models that are less correlated to market movements.”It pays to be passiveWhich business model is the most promising for assetmanagers going forward? It is widely recognised that passive strategies show significant growth potential. Withinour analysis period a significant shift from active to passive business has already been seen, reflected by ETFsexpanding in terms of AuM by 18 percent a year in Europeand 20 percent a year globally. The strong growth of ETFsindicates how attractive passive investing has become.Yet, the overall share of passive strategies is still smallwith an estimated share of total assets under management of just seven percent in Europe and ten percentworldwide – knowing, however, that the actual share ishigher since publicly available data does not includeall passively managed accounts (e.g. segregated accounts managed for institutional clients). In our survey,just over half of asset management firms offered ETFsas part of their portfolio, and these companies likelyalso offer passive management via other vehicles, suchas index funds and segregated accounts. However, theshare of ETF business compared to their overall assetsis in most cases negligible.Despite its small scale at present, passive businessrepresents one of the biggest ongoing challenges foractive asset management revenues. The reason forthe popularity of passive products is clear: They offeralmost unbeatable market performance for next to noPassive strategies increasingly serve as an alternative to active strategies with significant growth potential in the next yearseven though absolute volumes are still relatively smallAreaMarket share of passive strategies – AuM 2017Growth PATH of ETFs – AuM 2017in trnin bn 40GlobalTotalAuM 20%1) 10% of total AuM 83 39720132014201520164,6612017 18% 7% of total AuMEuropeTotalAuM 13 2InvestmentfundsPassivestrategies2020(E)1.2421) AGR1) AuM in passive strategies (index funds ETFs); without institutional mandates, e.g. special funds and segregated accounts) compared to total AuM;higher share of passive strategies in institutional mandates estimatedAuM Assets under managementSource: BIS; Moody’s; EFAMA; EY; Morningstar; zeb.researchFigure 9: Shift from active to passive business
15fees. Active strategies, by contrast, have high productfees and often also underperform. This gives passivestrategies a competitive advantage and puts enormouspressure on fees for active products.Investment consultants play an important role in thistrend towards lower prices. Their work leads to investorsmaking better-informed choices – and often selecting a“cheaper” product over a more expensive one.Margins are under pressureOngoing pressure on prices is also increasingly drivenby regulatory and financial conduct bodies. The introduction of the European Union’s MiFID II in January2018 has led to greater transparency about the feescharged by funds and commissions paid to financialadvisors. It also introduced obligatory benchmarking,making it easier for clients to assess value for money. Inaddition, various official bodies are increasingly awareof the issue of the value for money offered by assetmanagers. For example, from September 2019 firms inthe United Kingdom will be required to conduct annualassessments of value for money, preventing them frommarketing funds as active that merely mirror their underlying indices.Revenue margins have already been under pressure fora while. Particularly noticeable is the fact that priceshave declined across all asset classes. This development is largely due to the low yield environment, theunderperformance of active management and competition from passive products, all of which has putpressure on margins. The same trend affects both institutional and retail segments: Institutional clients sawtheir average total expense ratio (TER) for investmentfunds (excluding ETFs) fall from 0.7 percent in 2013 to0.6 percent in 2017, while retail clients saw a drop inTER from 1.6 percent to 1.4 percent.Passive business is the strongest ongoing challenge for active asset management revenues – almost unbeatable marketperformance for next to no feesMulti-asset retail tranche – sample comparisonPrice comparisonin % p.a.Avg. TER in % p.a.3Expensive andnon-performing–53%1.7TER2ØCheap and wellperforming–81%ETF 3) europ0–91%0.81–2024ØETF 3) global68100.212RetailInsititutional2)ETF 3)Net 5Y return1)Study’s asset management sampleETF1) Net return p.a. over 5 years (01/01/2013–31/12/2017), for 8 funds since inception due to shorter life time, unhedged in 2) Institutional share classes of retail funds3) E TF mixed European 50% EuroStoxx 50 50% Euro Government Bonds, ETF mixed global 50% MSCI World Global Government Bonds;Avg. EFT TER 0.15% p.a.; unhedged in TER Total expense ratioSource: Reuters, zeb.researchFigure 10: Price comparison
164 SIMULATING MARKET DEVELOPMENTSThree scenarios for the future of the market show assetmanagers’ vulnerabilitiesserved in Asia, Big Tech companies are expected to redirect asset flows, particularly if these new players startto launch more comprehensive offerings through theirplatforms which have strong retail client access. Alibabaspinoff Yu’e Bao has created the largest money marketfund accruing 370 million account holders and USD 211billion in assets in just 4 years, leveraging its strong platform and retail client access. At the same time, globalmegatrends will boost
2) IPE Top 400 asset managers 2017; for comparison: around 4,200 asset management companies operate in Europe 3) IPE Top 400 asset managers 2013-2017 CGAR p.a. AuM Assets under management; CAGR Compound Annual Growth Rate Source: zeb.research Europe has smallest market growth 3) 2013-2017 in % 28 13 12 18 US Europe Asia Rest of world