Transcription
INDIAREAL ESTATER E S I D E N T I A L A N D O F F I C E M A R K E T - J U LY - D E C E M B E R 2 0 2 1
2 I N DI A REAL ESTATEMumbai HOKnight Frank (India) Pvt. Ltd.Paville House, Near Twin Towers,Off. Veer Savarkar Marg, Prabhadevi,Mumbai 400 025, IndiaTel: 022 6745 0101 / 4928 0101;BengaluruKnight Frank (India) Pvt. Ltd.204 & 205, 2nd Floor, Embassy Square,#148 Infantry Road,Bengaluru 560001, IndiaTel: 080 40732600 / 22385515PuneKnight Frank (India) Pvt. Ltd.Unit No.701, Level 7, Pentagon Towers P4,Magarpatta City, Hadapsar,Pune 411 013, IndiaTel: 020 67491500 / 30188500;ChennaiKnight Frank (India) Pvt. Ltd.1st Floor, Centre block, Sunny Side,8/ 17, Shafee Mohammed Road,Nungambakkam, Chennai 600 006, IndiaTel: 04 4 4296 9000GurgaonKnight Frank (India) Pvt. Ltd.Office Address: 1505-1508, 15th Floor, Tower B,Signature Towers South City 1,Gurgaon 122 001, IndiaTel: 0124 4782700;HyderabadWestern Dallas Centre, 5th floor, Office #3,Hyderabad Knowledge City,Survey No. 83/ 1, Raidurg, Serilingampally Mandal,Ranga Reddy District, TelanganaHyderabad - 500 032, IndiaTel: 040 4 455 4141KolkataKnight Frank (India) Pvt. Ltd.PS Srijan Corporate ParkUnit Number – 1202A, 12th Floor,Block – EP & GP, Plot Number - GP 2,Sector – V, Salt Lake, Kolkata 700 091, IndiaTel: 033 66521000AhmedabadKnight Frank (India) Pvt. Ltd.Unit Nos. 407 & 408, Block ‘C’, The First,B/H Keshav Baugh Party Plot,Vastrapur, Ahmedabad – 380015Tel: 079 48940259/ 40380259www.knightfrank.co.in/research
3 I NDI A REAL ESTATEWARLI PAINTING THE HISTORY OF A TRIBAL ART FORMIndia has a rich tradition of folk arts the custodians of which are the many tribes that live in theinteriors of various states. Warli art is a beautiful folk art of Maharashtra, traditionally createdby the tribal womens. Tribals are the Warli and Malkhar koli tribes found on the northernoutskirts of Mumbai, in Western India. This art was first explored in the early seventies &from then it was named as “Warli art”. Tribal people express themselves in vivid stylesthrough paintings which they execute on the walls of their house. This was the only meansof transmitting folklore to a populace not acquainted with the written word. Warli paintingswere mainly done by the women folk. The most important aspect of the painting is that it doesnot depicts mythological characters or images of deities, but depict social life. Pictures ofhuman beings and animals, along with scenes from daily life are created in a loose rhythmicpattern. Warli paintings are painted white on mud walls. The paintings are beautifully executedand resembles pre-historic cave paintings in execution and usually depict scenes of humanfigures engaged in activities like hunting, dancing, sowing and harvesting.
4 I N DI A REAL ESTATECONTENTALL INDIAAHMEDABADBENGALURUPAGE NO. 08PAGE NO. 20PAGE NO. 30CHENNAIHYDERABADKOLKATAPAGE NO. 40PAGE NO. 50PAGE NO. 60MUMBAIPAGE NO. 70NCRPUNEPAGE NO. 80PAGE NO. 92Your partners in property.www.k n igh tf ran k .co.in /res earch
5 I NDI A REAL ESTATEFOREWORDS H I S H I R B A I JA LC H A I R M A N A N D M A N AG I N G D I R E CTO RK N I G H T F R A N K ( I N D I A ) P V T. LT D.This time last year, India had just started to come out of the firstHaving said that, the IT sector has been actively hiring in thebeginning to revive. However, even before this revival couldfor additional office space in the new year. The incrementalwave of COVID-19, and sections of the Indian business weresettle, India was hit by the far deadlier Delta variant. The secondwave set back the growth momentum yet again with a greaternumber of casualties being recorded. From an economicperspective, this weakened the sentiments.Interestingly however, the real estate sector witnessed anunexpected fallout of the pandemic, a paradigm shift in theattitude of end users for residential properties. The residentialsector saw growth after consistent slowdowns over 7 years.Sales volumes grew substantially over the last 5 quarters, mostlybecause of the change in viewpoint of the end users, whoperhaps due to the uncertainty caused by the pandemic, startedgravitating towards the security of home ownership.Ownership of home does provide a strong sense of stability.The growth in sales was of course, aided by the decadal lowhome loan interest regime, falling house prices, as well asdemand stimulant measures undertaken by some of the StateGovernments. The resurgence started with Mumbai and Punesoon after the rebate on stamp duty was introduced in Q3 2020.However, after the demand started to pick up, the momentumcontinued even without the sops. And this phenomenon has nowspread across all our major markets.Whilst the residential segment witnessed strong growth, theoffice sector was a mixed bag. The challenge to office spacecame mostly from the Information Technology and Servicessectors where the complete return to office has still not beenachieved.past year. And we are certain that this will create a requirementoffice space take up expected from the hiring by just the top 5 ITcompanies in India is estimated to be at around 12 mn sq ft.To conclude, I would like to add that before the pandemic, wehad noticed a divergent trend in office leasing and residentialsales over the last decade or so. Whilst office leasing had grownyear after year, residential sales had declined over time.After a long time, we feel that both these important sectors willstart showing simultaneous growth in the coming year. The onlything that casts a shadow of doubt on this revival is a possiblethird wave.With warm wishes for a bright 2022, I present to you the 16thedition of Knight Frank India’s flagship half yearly report –‘India Real Estate 2021’. This report attempts to capture thedevelopments in office and residential through the last year andI hope that this endeavor enriches your engagement with theIndia property market.Stay safe and stay healthy.
6 I N DI A REAL ESTATEHAS THEREAL ESTATECYCLE TURNED?RA JA N I S I N HACHIEF ECONOMIST &N AT I O N A L D I R E C T O RRESEARCHIndia’s real estate sector, specifically the residential segment, has shown quick recovery from the pandemicinduced crisis. A number of factors like low interest rates, fall in house prices and state governments’ stimulus, havesupported the housing market revival in 2021. The key question now is whether the housing market bounce back willsustain in 2022. It is critical to assess if, after almost a decade of slowdown, the real estate cycle has indeed turned.
7 I NDI A REAL ESTATEWhile initially, the pandemic posed a severe setback for the real estateThe speculators and investors have been missing from the Indian realpandemic turned into a strong factor supporting housing demand.years. As far as the interest rate is concerned, it is expected to startsector, the quick bounce-back took everyone by surprise. In fact, theNot just in India, there has been a worldwide surge in housing demandduring the pandemic. The surge in housing demand was supportedby low interest rates everywhere. During the pandemic, people felt theneed for bigger and better houses. As a result, in spite of uncertaintimes, households chose to channelize their savings to create a realestate asset. Globally, the housing boom has been accompanied bya sharp rise in housing prices, resulting in fears of the forming of ahousing bubble. In India, however, the housing sales surge has notbeen accompanied by rising prices so far. Housing prices in India,having fallen in the last few years, stabilized in the last few months.So, while there is the fear of a house price bubble burst globally, suchconcerns are not visible in India as yet.In many countries, like China for example, the housing sector isstruggling with the high leverage taken by many of the players. Therecent default by Chinese real estate behemoths like Evergrande andKaisa has highlighted this concern. In India on the contrary, there hasbeen a cleanup of balance sheets of the real estate players in the pastfew years, with many of them deleveraging. For the top 10 real estatedevelopers, the debt to equity ratio has fallen from 1.40 in 2016 to 1.17in 2021. The slowdown in the sector in the last few years has resultedin only players with better financial health surviving. Structural reformslike RERA and GST in recent years, have led to consolidation andformalization of the sector.Funding remains a challenge for the real estate sector, especially forthe smaller players. Banks have become cautious in the pandemicperiod resulting in the falling of outstanding bank credit to thecommercial real estate sector by 0.3% in the current year compared tothe previous year. In FY 2020, bank credit to the commercial real estatesector grew by a strong 29% before petering down in subsequentmonths. The other critical issue in the sector was that of large unsoldinventory. While it fell from a peak of 7 lakh units (for Top 8 cities) in2014, unsold inventory still remains high at around 4.4 lakh units. Thegovernment has set up the SWAMIH fund to help in funding stuckprojects in the affordable housing segment. While the fund has helped,it is a time-consuming process with its own set of challenges.Now, the critical questions are whether housing prices and interestrates will start rising in the next year, and if that will result in the fadingout of the housing growth momentum. With raw material prices, landand labour costs increasing, housing prices are expected to increasegoing forward. The strong demand will enable the developers to passon the increase in construction cost. However, the price increase islikely to be gradual and not as sharp as that being witnessed in manyof the other countries. The housing sales boom in India has so far beenled by end-user demand, hence the price rise is likely to be marginal.estate market as this asset class has shown poor returns in the last fewinching up given the inflationary concerns. This would have an impacton overall housing affordability. The interest rate hike too is likely tobe gradual given the growth uncertainties of the economy. Hence, agradual increase in prices and interest rates in the next few monthsmay not destabilize the housing growth momentum.A fairly critical aspect in this turnaround story will be the householdincome, which in turn will depend not just on overall economic growthbut also on the quality of growth. While India’s economy is projectedto grow by around 8% in FY 2023, there could be lot of hiccups withfurther waves of COVID remaining a concern. A strong hiring trendhas been seen in India’s IT sector and that should support householdincome. The unorganized sector and the MSME segment, on the otherhand, have been hit hard by the pandemic and need to bounce back. Alarge part of India’s housing story is led by affordable housing and forthis category to do well, it is critical for the income at the bottom of thepyramid to grow.Will India’s real estate sector rise like a phoenix from the ashes? Itmay be early to pronounce a final verdict on this given that pandemicrelated risks for the sector as well as the economy still persist. Theimportant aspect is that stakeholders of the sector like buyers, sellersand financial institutions have learnt their lessons from excesses ofthe past. Hopefully, they will be cautious this time around and thatshould help sustain the turnaround, provided overall economic growthmomentum is maintained.
8 I NDI A REAL ESTATE A LL I ND I AALLINDIARESIDENTIAL AND OFFICE MARKET
9 I NDI A REAL ESTATE A LL I ND I AR ES I D E NTI A L M A RK ETA L L IN D I A M ARKE T SUM M ARYPAR A MET E R2021Launch es(hous i n g u n i ts )Sales( hous i n g u n i ts )2 02 1CH ANGE ( YOY)H 2 2 02 1H 2 2 02 1CH ANGE ( YOY)Q 4 2 02 1(housing units)Change (YoY)437,237 0%CHANGE (QOQ)2 3 2 ,3 8 258%1 29,1 4 450%70 ,1 7719 %2 3 2 ,9 0 351 %1 3 3 ,48741 %6 9,4779%Note : 1 s q uare metre (sq m) 10 .76 4 squ a re fe et ( s q f t )S o u rce: Knight Frank R esearchUnsold inventory 2021Q4 2021Quarters to sell 202110.0(in quarters)Age of unsoldinventory 202116.4(in quarters)
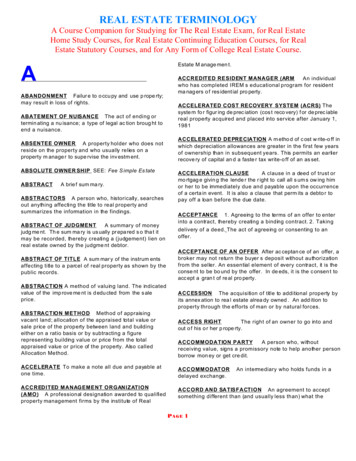
1 0 I NDI A REAL ESTATE A LL I ND I AL AUNC H ES A N D SAL ES 68,70280,0001,33,48786,13989,50991,739No. of 5,0161,41,3411,60,00040,83260,00040,00020,0000H1 2015S o u rc e : Kn i g h t Frank R esearchH2 2015H1 2016H2 2016H1 2017H2 2017H1 2018H2 2018H1 2019H2 2019H1 2020H2 2020H1 2021H2 2021
11 I NDI A REAL ESTATE A LL I ND I A The COVID-19 pandemic has dictated market movements sincethe beginning of 2020. The first wave of infections that struck thecountry in Q2 2020 caused a near shutdown in business activityand a consequent crash in residential market volumes during theperiod. The gradual resumption of economic activity and increasingavailability of the vaccine sparked market traction in the secondhalf of 2020 and this momentum carried over to 2021. The secondwave of infections in Q2 2021 again curtailed homebuyer anddevelopment activity alike as was seen during the first wave. However, the pandemic’s ultimate impact on the real estate markethas been quite paradoxical as it has reignited the need for personalspace and housing in the homebuyer’s mind. With the secondwave having run its course by the end of Q2 2021, an improvingeconomic/business environment, increased understanding ofthe pandemic and focus on vaccinations had already helped theresidential market stage a smart recovery in Q3 2021 and the fourthquarter held the promise of a sustained recovery. Market traction did not disappoint in Q4 2021 despite concernsof the Omicron variant which ultimately had very little impact onthe residential market, if at all. In terms of half-yearly sales, H22021 posted the highest sales volume since H1 2016. Low interestrates, improving affordability, high savings rate during 2020 and aresurging interest in home ownership due to the space constraintsimposed by the pandemic, have been the primary drivers of thisrevival in demand. Developers were quick to realise this seismic shift in sentimentand launched almost 0.13 mn units in H2 2021, a six year high inthe annual volume of units launched and 50% higher than H22020. It is noteworthy that these higher launch volumes occurreddespite a significant rise in the cost of input material such ascement and steel. The labour scarcity prevailing in H1 2021 was alsoalleviated to a large extent with developers committing to facilitateaccommodation on-site. Mumbai and Pune accounted for 41% of the sales during H2 2021even as the Maharashtra stamp duty cut window, credited forboosting sales volumes in these two markets, closed in March2021. Sales in Bengaluru and Hyderabad rose the most during H22021 at 104% and 135% YoY respectively. Homebuyers in theseInformation Technology sector dominated markets were relativelyless impacted by pandemic induced disruptions and were wellpoised to take the plunge in H2 2021. Incidentally, Hyderabad alsosaw high growth in launches at 126%. Annual sales in the INR 5 mn ticket size price segment reducedfrom 45% in 2020 to 42% in 2021. Conversely, the share of annualsales in the INR 5-10 mn and 10 mn ticket-size categories grewfrom 35% to 37% and 20% to 21% respectively, during the samereference period. The significant increase in sales activity also stemmed the fallin residential prices seen in 2020. Price levels in seven of theeight markets under review were observed to remain at the samelevel or record marginal growth in H2 2021 on a YoY basis. Whiledevelopers offered flexible payment schemes to push sales acrossmarkets, the incidence of direct discounts reduced dramaticallyduring H2 2021. With increased launches in line with the pick-up in sales, theunsold inventory level by the end of 2021 remained steady at 0.44mn units, at around the same level as seen at the end of 2020.The quarters-to-sell (QTS) level was also similarly steady at 10.0quarters in H2 2021, as compared to 10.1 quarters in H2 2020.QTS shows the number of quarters required to exhaust the unsoldinventory and is calculated by dividing the existing unsold inventoryby average sales of the eight trailing quarters from the analysisperiod to avoid seasonal volatility. The residential market turned a corner in 2021 with salesmomentum consistently improving over the year. Homebuyersentiments were not dented by concerns over the Omicron variantarising late in Q4 2021. The industry continues to consolidatewith residential developments steadily shifting into the hands ofstronger developers who have been able to weather the economicstorm created by the pandemic. While ready inventory remains astrong preference for homebuyers, established developers with arobust execution record are increasingly finding a market for theirunder-construction inventory.
12 I NDI A REAL ESTATE A LL I ND I AK N IGH T FRA N K AFFORDABILITY INDE XAffordability has improved over the years across all markets with income growing and housing prices correcting. The Knight Frank AffordabilityIndex, that tracks the EMI (Equated Monthly Instalment) to income ratio for households, improved further in 2021 across all cities. In fact,affordability has improved dramatically since 2015 as the combined impact of slowing price growth and falling interest rates was much greater inthis period. The home loan interest rate is at a decadal low, aiding housing affordability. For instance, in Ahmedabad, the affordability index hasimproved to 20% in 2020 from 46% in 2010. This implies that on an average a household in Ahmedabad needs to spend 20% of its income topay EMI for housing loan. Mumbai remains the most expensive market, but even in Mumbai the affordability has improved significantly, with theaffordability index reducing from 93% in 2010 to 53% in 2021. Mumbai is the only market with an EMI to income ratio above 50%, a level beyondwhich banks rarely underwrite a mortgage. Ahmedabad is India’s most affordable market today followed by Pune and Chennai, with affordability ratioat 24% and 25% respectively for both the cities. For NCR, the affordability index has fallen from 53% in 2010 to 28% in 2021, while for Bengaluru,the affordability index has fallen from 48% in 2010 to 26% in 2021.A F F O RDA BI L I T Y M AT RIXCITY201020202021MUMBAI93%60%53%NCR53%38%28 %BENGALURU48%28%26 %PUNE39%26%24 %CHENNAI51 %26%25 %HYDE RABAD47 %31%29%KOLKATA45%29%25 %AHMEDABAD46%23%20 % N ote : Ci ty-wi d e ave ra ge afford a b i l i ty stati sti cs ca n n ot h i gh l i gh t d i sp a r i ti es i n h o u s i n g c osts w i t h i nsu b - m a r kets or a cross th e i n com e sp e ctr u m . S ou rce : MOS P I , Kn i gh t Fra n k Rese a rchME TH O D O LO GYThe Knight Frank Affordability Index indicates the proportion of income that a household requires, to fund the monthly instalment (EMI) of a housingunit in a particular city. So, a Knight Frank Affordability index level of 40% for a city implies that on an average, households in that city need to spend40% of their income to fund the EMI of housing loan for that unit. An EMI/ Income ratio over 50% is considered unaffordable as it is the limit beyondwhich banks rarely underwrite a mortgageAS S U M P T I O N S EMI, housing unit size and price/ sq ft represent city-level averages. EMI:Loan Tenure – 20 yearsLoan to Value – 80%Home loan interest rate - Average home loan rates of the State Bank of India (SBI) Area of housing unit: House size is fixed for each city across the years, but varies within different cities taking into account the average sizepreference for each city. Housing Price: Median housing price for that city
1 3 I NDI A REAL ESTATE A LL I ND I AA L L I N D I A T I C KE T S I ZE SPLIT COM PARISON OF SA LESDUR IN G H 2 2 0 2 0 AND H2 2 02 1H2 2020I NDI A AFFORDABLE MARKET ACT I VI T Y( UP TO I NR 5 MI LLI ON SEGMENT )H2 202121%36%INR 10mn INR 5-10mn2335%INR 10mn 70,00060,00050,000%40,000INR 5-10mn30,00020,00043% INR 5mn42% INR 5mn10,0000S o u rc e : Kn ight Frank R esearchH1 2018H2 2018H1 2019H2 2019H1 2020H2 2020H1 2021H2 2021S ou rce: Kn i gh t Fra n k Rese a rchR ESID E N T I A L L AU N CHES AND SALESLAUNCHESSALESCITYH2 2021 (YOY CHANGE)2021 (YOY CHANGE)H2 2021 (YOY CHANGE)2021 (YOY CHANGE)MUMBAI3 4,1 51 (27 % )70 ,0 23 (3 9%)3 4,3 8 2 (1 4%)6 2 , 9 89 (29 % )NCR1 7,6 4 2 (1 1 0 % )20 ,5 8 5 (1 1 0 %)23 ,5 99 (49%)3 5, 073 (65% )BENGALURU1 7,2 1 8 (8 9 % )3 0 ,6 0 7 (5 4%)23 ,21 8 (1 0 4%)3 8, 030 (61% )PUNE2 0,0 1 2 (-7 % )40 ,48 9 (1 6 %)1 9,74 4 (1 7%)3 7, 218 (38% )CHENNAI7,3 6 0 (9 8 % )1 2,78 3 (77%)6 ,20 6 (9%)1 1, 9 58 (38% )HYDERABAD1 9 ,0 24 (1 2 6 % )3 5 ,73 6 (1 79%)1 2,3 4 4 (1 3 5 %)24, 318 (142% )KO L KATA5 ,3 1 5 (6 2 % )7,51 0 (8 1 %)9,290 (5 5 %)1 4,405 (62% )AHMEDABAD8 ,4 22 (7 7 % )1 4,6 48 (99%)4,70 3 (1 8 %)8, 9 11 (37% )ALL INDIA1 2 9 ,1 4 4 (5 0% )23 2,3 8 2 (5 8 %)1 3 3 ,487 (41 %)232, 9 03 (51% )S o u rc e : Kn ight Frank R esearch
14 I NDI A REAL ESTATE A LL I ND I AR ES I D E N T I A L M ARKET HEALTH IN H2 2 02 1CITYUNSOLD INVENTORY (YOYCHANGE)QTSMUMBAI1 5 3 ,9 5 0 (5 % )1 1 .0NCR9 6 ,1 8 6 (-1 3 % )1 3 .7BENGALURU6 7,3 41 (-1 0% )8 .7PUNE5 0,8 1 2 (7 % )6 .3CHENNAI1 2 ,8 5 4 (5 % )5 .0HYDERABAD1 8 ,5 9 8 (1 5 9 % )4.3KO L KATA2 1 ,2 6 5 (-24 % )7.3AHMEDABAD1 6 ,2 3 1 (5 5 % )8 .4ALL INDIA4 3 7,2 3 7 (0% )1 0 .0S o u rc e : Knight Frank R esearchR ES I D E N T I A L P RI C E M OVE M E NTCITYH2 2021 IN INR/SQ M (INR/SQ FT)12 MONTH CHANGE6 MONTH CHANGEMUMBAI74,1 1 0 (6 ,8 8 5 )1%2%NCR45 ,241 (4,20 3 )-1%1%BENGALURU5 5 ,43 5 (5 ,1 5 0 )4%4%PUNE43 ,0 5 6 (4,0 0 0 )0%0%CHENNAI43 ,5 94 (4,0 5 0 )7%0%HYDERABAD5 0 ,8 0 6 (4,720 )5%0%KO L KATA3 4,6 0 6 (3 ,21 5 )0%0%AHMEDABAD3 0 ,1 3 9 (2,8 0 0 )0%0%S o u rc e : Knight Frank R esearch
15 I NDI A REAL ESTATE A LL I ND I AOFF I C E M A RK ETIN DIA M A RKE T S U M M ARYPAR A M ET E R2021Compl et i o n sm n sq m ( mn s q f t )Transa ct i o n sm n sq m ( mn s q f t )2 02 1CH ANGE ( YOY)mn sq m (mn sq ft)Change (YoY)77.10 5%(830.1)H 2 2 02 1CH ANGE ( YOY)Q 4 2 02 1Q4 2021CHANGE (QOQ)3 .6 0 (3 8 .7)9%2.20 (23 .7)38%1 .1 0 (1 1 .8 )0%3 .5 4 (3 8 .1 )-3 %2.40 (25 .9)1 7%1 .24 (1 3 .3 )6%Note : 1 s q uare metre (sq m) 10 .76 4 squa re fe et ( s q f t )S o u rce: Knight Frank R esearchStock 2021H 2 2 02 1Vacancy % 202117.2%177 basis points increase
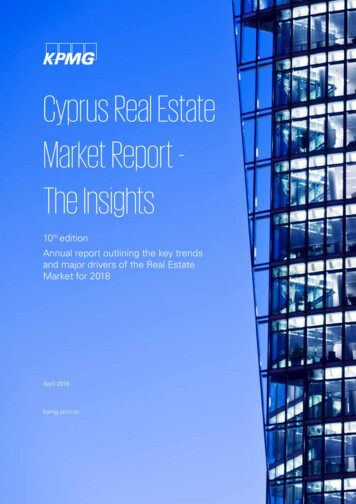
1 6 I NDI A REAL ESTATE A LL I ND I AIN DIA O FFI C E M ARKET 1.711.751.812.01.901.871.941.992.022.09Mn sq m2.232.51.041.141.281.51.00.50.0H1 2015H2 2015S o u rc e : Kn ight Frank R esearchH1 2016H2 2016H1 2017H2 2017H1 2018H2 2018H1 2019H2 2019H1 2020H2 2020H1 2021H2 2021
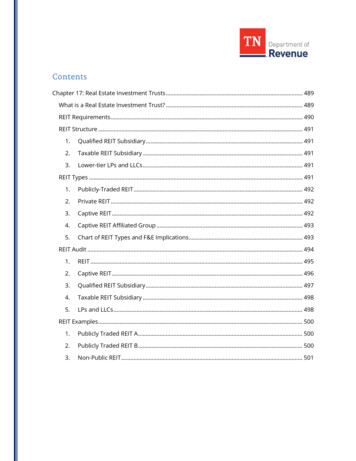
17 I NDI A REAL ESTATE A LL I ND I A 2021 began on a positive note with the first quarter of the yearand Mumbai accounted for 62% of the new completions withshowing encouraging signs of recovery and growth, but the muchBengaluru seeing the most space delivered at 0.6 mn sq m (6.8 mnmore intense second wave of the pandemic curtailed markettraction in Q2 2021. However, improving economic fundamentalsand business environment coupled with a better understanding ofsq ft). There was a dip in rentals on a YoY basis across most markets in2021. However, rental levels across markets were observed to bethe pandemic encouraged corporate India to gradually return tooffice in the second half of the year. 2.4 mn sq m (25.9 mn sq ft) ofoffice space was transacted during H2 2021 compared to 1.14 mnstabilizing towards the end of the year. Despite the uncertainty regarding the Omicron variant of thepandemic, transaction volumes in H2 2021 have shown asq m (12.3 mn sq ft) in H1 2021.reassuring growth over the same period last year. The active While annual transacted volumes in 2021 almost equaled 2020adoption of managed office premises by large enterpriseslevels (-3% YoY), they could have comfortably crossed the sameis expected to continue as employee health considerationsbut for the uncertainty caused by the emergence of the Omicronwill necessitate a high level of flexibility in their workspacevariant towards the end of the year.considerations, especially as the pandemic runs its course. Six of the eight markets under our coverage saw transactionAs things stand now, more than 60% of the country’s eligiblepopulation is already fully vaccinated and over 90% have receivedvolumes grow in YoY terms during H2 2021. Transaction volumestheir first dose. Further, our vastly increased understanding ofin NCR and Pune grew the most at 56% and 58% YoY respectivelythe pandemic should help avoid a panic situation in the marketduring the period. Bengaluru with 0.8 mn sq m (8.7 mn sq ft)as was seen in 2020. Going forward, the progress in employeeconstituted 33% of the area transacted during the year and it isvaccinations and the speed at which clarity is achieved on thealso the highest volume transacted in the city during a half-yearlyvirulence of the latest variant will determine how quickly corporatesperiod.return to office in force. The Information Technology sector accounted for 27% of the spacetransacted during H2 2021 compared to 41% in H2 2020. However,given the substantial hiring that has occurred in the sector during10%momentum in every successive quarter of 2021, 84,000 seats8%player’s positioning as experts in the domain of workspace6%increased to 29% in Q4 2021 from 11% in Q4 2020. Gatheringwere taken up in managed office premises in 2021. The co-workingdelivery continues to strengthen even as this sector goes througha consolidation phase that will see the weaker players eventuallygetting pushed out of the market.1 7.2%influenced quarter. The share of the sector in total transactionsmanaged office sector’s transactions during the Omicron1 6 .6 %12%14.2%activity, it was the primary driver for the spike in the co-working/a growing phenomenon. While the IT sector deferred its leasing13.1%14%12.6 %the need for flexibility and a hybrid working environment has beensector was the highest amongst all sectors during Q4 2021 as13 .0%16%1 2.9 % The share of transactions in the co-working/managed workspace11. 6%18%of 1.08 mn sq m (11.7 mn sq ft).1 2.4%2021 period, which is estimated to create an incremental demand13.4%20%top five IT companies in India during the April 2020 to September15 .1 %average. Approximately 0.26 mn employees have been hired by the1 5 .4%I NDI A OFFI CE MARKET VACANCY1 6 .7%of time before its share in transactions reverts to its longer-term1 5 .6 %the year and its professed need to return to office, it is a matter4%2% With labour shortages and other supply chain bottlenecks havingbeen overcome to a large extent in H2 2021, office completionsalso picked up significantly with 2.2 mn sq m (23.7 mn sq ft) gettingdelivered during the period, a 38% growth YoY. Bengaluru, Pune0%H1 2015 H2 2015 H1 2016 H2 2016 H1 2017 H2 2017 H1 2018 H2 2018 H1 2019 H2 2019 H1 2020 H2 2020 H1 2021 H2 2021S ou rce: Kn i gh t Fra n k Rese a rch
1 8 I NDI A REAL ESTATE A LL I ND I AS E CTO R- W I S E T RA N SACTIONS SPLIT IN H2 2 02 0AND H2 2021H2 2 02 0MARKET-W I SE RENTAL MOVEMENTCITYRENTAL VALUE RANGE IN H22021 IN INR/SQ M/MONTH(INR/SQ FT/MONTH)12 MONTHCHANGE6 MONTHCHANGEMUMBAI1 1 5 2 (1 0 7)-8 %-2%NCR8 8 4 (8 2.1 )0%1%BENGALURU78 6 (73 )-9%1%PUNE721 (6 7)- 4%2%AHMEDABAD43 3 (40 .3 )-2%0%CHENNAI6 27 (5 8 .3 )-3 %-3%HYDERABAD6 6 1 (6 1 .4)0%0%KOLKATA3 75 (3 4.8 )-3 %0%H2 2 02 116%B FS I16%41%I nfo rm at i o n Tec hno l o g y27 %16%M a nufa ct uri ng10%C o -wo rk i ng18%18%Ot her S erv i c es19%21%S o u rc e : Kn ight Frank R esearchN ote : B FS I includes B FSI support servicesS ou rce: Kn i gh t Fra n k Rese a rchOF F IC E T RA N SACT I O NS & COM PLETIONSOFFICE TRANSACTIONSOFFICE SPACE COMPLETIONSCITYH2 2021 IN MN SQ M(MN SQ FT) (YOY CHANGE)2021 IN MN SQ M(MN SQ FT) (YOY CHANGE)H2 2021 IN MN SQ M(MN SQ FT) (YOY CHANGE)2021 IN MN SQ M(MN SQ FT) (YOY CHANGE)MUMBAI0 .2 (2 .1 ) (1 % )0 .3 5 (3 .8 ) (-3 7%)0 .3 4 (3 .7) (1 23 %)0 .46 (5) (-6% )NCR0.3 7 (4 ) (5 6 % )0 .6 (6 .4) (3 8 %)0 .2 (2.1 ) (0 %)0 .48 (5.1) (76% )BENGALURU0.8 (8 .7 ) (1 5 % )1 .1 4 (1 2.2) (-1 %)0 .6 3 (6 .8 ) (25 %)1 .1 1 (11. 9 ) (27% )PUNE0.2 5 (2 .7 ) (5 8 % )0 .3 6 (3 .8 ) (3 %)0 .4 (4.3 ) (75 4%)0 .67 (7. 2) (9 21% )AHMEDABAD0 .0 7 (0 .7 ) (-1 0% )0 .1 1 (1 .1 ) (-1 2%)0 .1 3 (1 .4) (- 4 4%)0 .23 (2. 5) (-51% )CHENNAI0.2 5 (2 .7 ) (-1 5 % )0 .3 6 (3 .9) (-1 4%)0 .0 9 (0 .9) (1 3 5 9%)0 .1 6 (1. 8) (- 47% )HYDERABAD0 .41 (4.4 ) (1 6 % )0 .5 6 (6 ) (0 %)0 .3 6 (3 .8 ) (-21 %)0 .43 (4. 6) (- 47% )KO L KATA0 .0 5 (0 .6 ) (24 % )0 .0 8 (0 .8 ) (-1 2%)0 .0 6 (0 .6 ) (0 %)0 .0 6 (0. 6) (610% )TOTAL2 .4 (2 5 .9) (1 7 % )3. 5 4 ( 38.1) ( -3%)2 . 2 ( 2 3.7 ) ( 38%)3. 6 (38 .7) (9 %)S o u rc e : Knight Frank R esearch
1 9 I NDI A REAL ESTATE A LL I ND I AMA R K E T-W I S E RE N TAL M OVEM E NTCITYRENTAL VALUE RANGE IN H2 2021 IN INR/SQ M/MONTH(INR/SQ FT/MONTH)12 MONTH CHANGE6 MONTH CHANGEMUMBAI1 1 5 2 (1 0 7)-8 %-2%NCR8 8 4 (8 2.1 )0%1%BENGALURU78 6 (73 )-9%1%PUNE721 (6 7)- 4%2%AHMEDABAD43 3 (40 .3 )-2%0%CHENNAI6 27 (5 8 .3 )-3 %-3%HYDERABAD6 6 1 (6 1 .4)0%0%KO L KATA3 75 (3 4.8 )-3 %0%S o u rc e : Kn ight Frank R esearch
2 0 I NDI A REAL ESTATE A H ME DA BA DAHMEDABADRESIDENTIAL AND OFFICE MARKET
2 1 I NDI A REAL ESTATE A H ME DA BA DR ES I D E NTI A L M A RK ETA H ME DABAD M ARKET SUM M ARYPAR A MET E R2021Launch es(hous i n g u n i ts )Sales(hous i n g u n i ts )2 02 1CH ANGE ( YOY)H 2 2 02 1H 2 2 02 1CH ANGE ( YOY)Q 4 2 02 199%8 ,42277%4,1 6 5-2%8 ,9 1 13 7%4,70 318%3 ,0 969 3%0%---0%I N R 3 1 ,1 3 9(INR/ s q f t ) ( E n d of p e r io d )(
Knight Frank (India) Pvt. Ltd. PS Srijan Corporate Park Unit Number - 1202A, 12th Floor, Block - EP & GP, Plot Number - GP 2, Sector - V, Salt Lake, Kolkata 700 091, India Tel: 033 66521000 Ahmedabad Knight Frank (India) Pvt. Ltd. Unit Nos. 407 & 408, Block 'C', The First, B/H Keshav Baugh Party Plot, Vastrapur, Ahmedabad - 380015