Transcription
NIH Scientific Workforce Diversity Actions and Progress:2014-2019Hannah A. Valantine, MD NIH Chief Officer for Scientific Workforce DiversityM. Roy Wilson, MD President, Wayne State University118th NIH ACD Meeting June 13, 2019 National Institutes of Healthlllllr./ Office of the DirectorScientiftc Workforce Diversity
Acknowledgments NIH Office of Extramural Research– Mike Lauer, Katrina Pearson NIGMS– Jon Lorsch, Alison Gammie, Christa Reynolds Scientific Workforce Diversity– Charlene Le Fauve, Alison Davis, Lauren Milligan, Nicole Lang
NIH Scientific Workforce Diversity 2014-2019Actions and ProgressPresentation Outline ACD Working Group on Diversity in the BiomedicalResearch Workforce recommendations and key datapoints (endorsed by the ACD in June 2012) Implementation of 2012 ACD recommendations Applications/funding: R01, K, fellowships, training awardsNational diversity trends - PhD recipientsDiversity Program Consortium (BUILD, NRMN)Tracking and evaluation of diversity metrics (CEC) 2018 ACD recommendations focused on careerindependence transition through institutional changeNIH Scientific Workforce Diversity Strategic Plan
} lJ)Key Data Points Identified by the ACD WGD BRWContext for Assessing ProgressNational Data Small # URGs inSTEM 504/year*Research ProjectGrants** (R01eq) Applications AA/B1.3% Hisp3.4% Awards AA/B Hisp 1%2.5%AA/B applicants 13 %points less likely to beawarded R01* Biological science, chemistry, andphysics – 2000-2008(NSF women, minorities andpeople with disabilities report 2011)K Awards (K01,K08, K23) AA/B 4% Hisp 5% .W"-'"'1 IIIT,f m '"' G!.n.:. - &-1.31.i- -.;''.;f \ID. "" NIH TrainingAwards Pre-doc F30/F31 AA/B1.3% Hisp3.4% Post-doc F32/T32 AA/B1.3% Hisp3.4%URG - 10% all pre-docawardsURG - 8.1% NIHsponsored post-docs**Note: Although generally NIH awards are made to institutions, as the applicants and awardees of NIH funding, for purposes of thispresentation, the terms “applications,” “applicants,” and “awardees” reference those individuals designated as senior/key personnel onNIH applications and/or awards, respectively.
Original 2012 ACD WGD BRW RecommendationsPIPELINEMENTORINGPEER REVIEWINFRASTRUCTURE#3additional financial support for undergraduates#1systematic review and evaluation of all diversity programs#4assess reason for disparity in grant awards#6establish ACD Diversity Working Group#2develop interest in STEM in K-12 and beyond#5establish a system of mentorship “networks”#9establish ACD Diversity Working Group Subcommittee on Peer Review#10 implicit bias/diversity awareness training for scientific review and program officers#11 design experiment to determine effects of application anonymization#7more detailed explanation for unscored grant applications#8establish bold, multi-year awards to enhance diversity at under-resourced institutions#12 appoint chief diversity officer and establish office of diversity#13 more comprehensive search for tenure-track investigators (e.g., Stadtman search)diversity.nih.gov
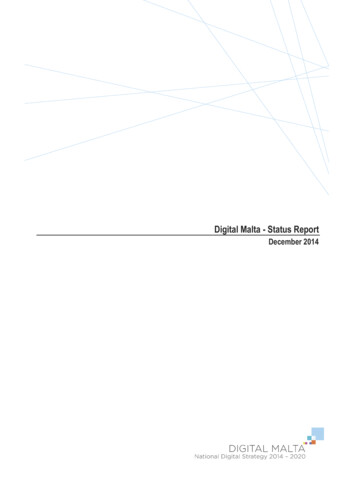
i'}lJ) .W"'1"'1 IIIT,f m '"', G!.n.:. - - -.:'.;f . ID. "" Interpreting R01 Success Rates in Context of Decline in Pay Lines:Gap Persists but is Slightly Narrowed&-1.31.i30% OF FUNDING GAPATTRIBUTABLE TOAPPLICANT &REVIEWER TOPICPREFERENCE(Hoppe, et al. in press)Success rate for Type 1 R01 (Ginther et al. 2011):FY 2000 – 2006African American applicants: 17.1%White applicants:29.3%Differential success (AA:W) 0.58Success rate for Type 1 R01-Equivalent:FY 2013 - 2018African American applicants: 11.3%White applicants:18.1%Cochran-Mantel-Haenszel statisticsDifferential success (AA:W) 0.63Effect of race adjusted for timeperiod: 184.45, p 0.0001
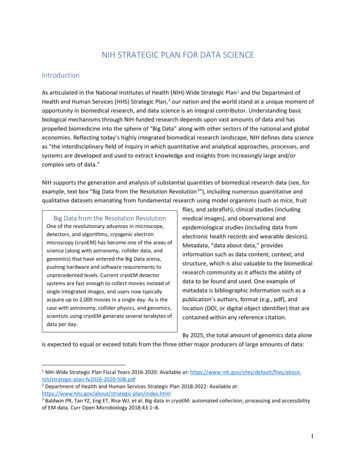
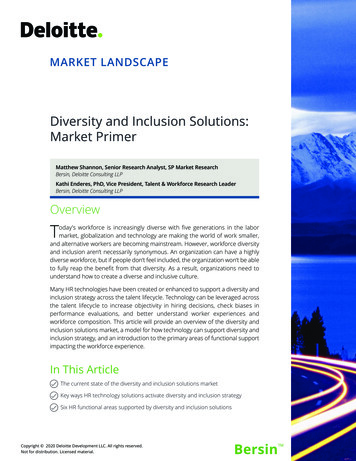
R01eq Applicants* and Funding Rates (Type 1 and 2) Race/EthnicityFY2013 and FY2018Number of Applicants20,00018,00016,918Funding Rates28.9% increaseAA/B applicants19,15368.9% increaseAA/B funding 6% 27.9%21 ,0002,0005.0%1,36268020130.0%2018 Al/AN M/B2013 NH/Pl Hispanic AsianWhite2018* Principal Investigators
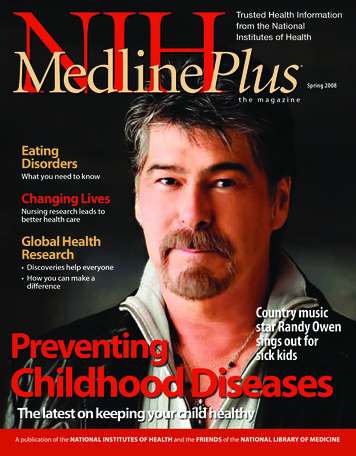
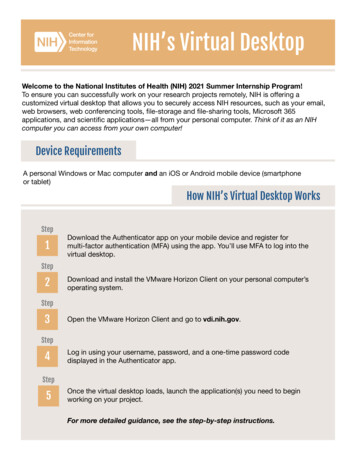
I'}lJ) .W"- Jil'i IIIT.Lm '"'' : G!.n.:. - -&-1.31.i -.:'.;f . ID. "" African-American and Hispanic/Latino R01eq Awardees*(Type 1 and 2) FY2013 and FY2018390400350Number of Awardees300250117% increase# AA/B awards183200150D11310050D52020132018Black or African-American2013Hispanic or Latino2018* Principal Investigators
Funding Rates Mentored Career-Development (K-Series) Awardees*Type 1 and Type 2: FY2013 and %15%15%10%10%5%5%0%0%2013 AmericanIndian/ Alaska Native2018 Black or African-American Hispanic or Latino* Principal Investigators AsianWhite
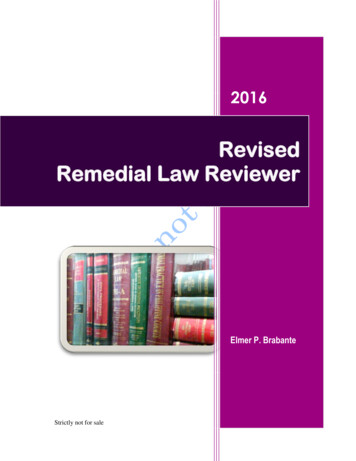
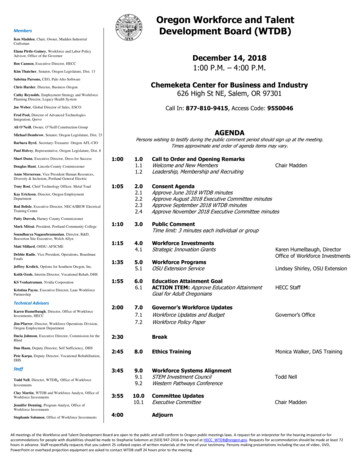
} lJ)African-American and Hispanic/Latino K Awardees*(Type 1 and 2) FY2013 and FY201880 .W"'1"'1 IIIT,Lm '"'' G!.n.:. - &-1.31.i -.:'.;f . ID. "" 747063Number of Awardees6050142% increase# AA/B awards524030262010020132018Black or African-American20132018Hispanic or Latino* Principal Investigators :-
} lJ) .W"'1"'1 IIIT,Lm '"'' G!.n.:. - &-1.31.i -.: . ID. "".;,;.URMs Supported on Predoctoral and Postdoctoral Training* Grants (2018)Increased to 20% from 12% in 201212,00080%Number of Trainees10,0008,000 URM6,0004,00020%2,00010,3570* T15, T32, T34, T35, T90, TL1, TL4WR2,074WR Well-representedWhite and Asian AmericanURM UnderrepresentedAmerican Indian/Alaska Native,African American/Black andNative Hawaiian/PacificIslander :c,,,,:
URM Trainees Supported on Predoctoral Fellowships (F31) andPostdoctoral Fellowships (F32)Increased in 2018 to 14.4% from 10% in 20123,5003,00085.6%(I)"'C"-n,2,5003 WR C 2,0000"Q).0E z 1,5001,00014.4%5000F awardsURMWR Well-representedWhite and Asian AmericanURM UnderrepresentedAmerican Indian/AlaskaNative, AfricanAmerican/Black and NativeHawaiian/Pacific Islander
i'}lJ)PhD Recipients in NIH-Relevant FieldsIncrease in URM Representation (2012-2017) .W"'1"'1 IIIT,Lm '"'' G!.n.:. - -&-1.31.i -.: . ID. "" Life SciencesRace/EthnicityTotalsPercentage20122017% ChangeHispanic or LatinoAmerican Indian or AlaskaNative49360622.92%2425Asian9341,014Black or African 04%73.56%70.72%More than one 00.00%Source: NSF Survey of Earned Doctorates 1997-2017I :-
NIH Scientific Workforce Diversity 2014-2019Actions and ProgressPresentation Outline ACD Working Group on Diversity in the BiomedicalResearch Workforce recommendations and key datapoints (endorsed by the ACD in June 2012) Implementation of 2012 ACD recommendations Applications/funding: R01, K, fellowships, training awardsNational diversity trends - PhD recipientsDiversity Program Consortium (BUILD, NRMN)Tracking and evaluation of diversity metrics (CEC) 2017 ACD recommendations focused on careerindependence transition through institutional changeNIH Scientific Workforce Diversity Strategic Plan
NIH Diversity Program ConsortiumBuilding Evidence- Awards made October 2014Total: 250 million (5 years)BUILD: 10 sites/experimentsNRMNCECBUILD (2,500* students haveparticipatedto date)BUILDTested CaliforniaState University LongInterventionsBeach California State University NoStertrheridotgype e threat Morgan State University Phase II begins July2019NRMN NRMNBostonActivitiesCollege– CorrittliacacehneioPndl rSatate tUveryrsitySan Francisco State University StudententrepreneurshipUniversity of Alaska Fairbanks University of Detroit MercyLiving and learningUniversity of Maryland Baltimorecommunities CountyUniversity of Texas El PasoXavier University of LouisianaMorehouseSM;UUteanh;torshipsGuided virtual. mU. NorthMyNRMTNexatos;ol U.WisconsinMenCtors: 3,470*CEtees: 5,690of* MenUniversityCalifornia LosGrantwriting/coaching Angelesmentees:546* gesandUniversitiesTotal of 10Sites/Experiments StateCollegesPublicUniversities152 awards granted (89NIH awards)*Data as of January 2019 *Track record of training Hispanic studentsdiversity.nih.gov
BUILD Dashboard (Years 1-5*)0BUILD NRSA training slots (TL4)1000Unique trainees:1157BUILD research training slots (RL5)BUILD TL4 graduates (B.S./B.A.)BUILD TL4 Graduates Pursuing ty Professional Development (# activities)152Publications**2272164Faculty Mentor Training (# activities)Pilot Projects4000304Research Mentor Training (# non-unique participants)Faculty Release Time (# participants)3000Faculty248199259Institutional Partner Agreements113Novel Curriculum104Institution*Data from YR5 isinterim throughDec. 2018
BUILD NRSA DemographicsUnknown /Withheld2%White, NonHispanic12%Hispanic41%American Indian,Alaska Native,Pacific Islander,or Multiple Races6%Black, NonHispanic27%Asian, NonHispanic12%Spring 2019 datan 1138
NRMN Grantwriting/Coaching ProgramBy the Numbers6Grant writing/coaching programs (GCPs)546Investigator participants in all GCPs89NIH awards (71%URG, 73% Women)152Awards (NIH non-NIH) 65MTotal NIH funds across GCPs
i'lJ)NRMN Demographics of Grantwriting/Coaching ParticipantsGrant Recipients* (top categories)0510K01, K08, K22, K23, K12, KL2R01, INBREOffice of tho DirectorScientific Workforce Diversity152063% URMOther Rs ' - . National Institutes of Health111111""/}45% URM57% URM25 .W"'1"'1 IIIT,f m '"', G!.n.:. - &-1.31.i -.:'.;f . ID. "" 3067% Female80% Female79% Female*Note: Although generally NIH awards are made to institutions, as the applicants and awardees of NIH funding, for purposes of thispresentation, the terms “applications,” “applicants,” and “awardees” reference those individuals designated as senior/key personnel onNIH applications and/or awards, respectively.
I'}lJ) .W"- Jil'i IIIT.Lm '"'' : NIH Awards to NRMN Grantwriting/Coaching ParticipantsDetails by Award Types0510152025K01, K08, K22, K23, K12, KL2Other RsR01, INBREDiversity SupplementF31, F32, FI2SC1Pilot and Feasibility, i.e., P30P20, P50, P60K99/R00UL1, U54 ' - . National Institutes of Health111111""/ G!.n.:. - -&-1.31.iOffice of tho DirectorScientific Workforce DiversityS06--IIII IOverall NIH Awards Received: 8971% to URM73% to female22% to MSI30 -.:'.;f . ID. ""
DIVERSITYDPC TimelinePROGRAMCONSORTIUMSupported by the NationalInstitutes of HealthPhase I: Develop and implement interventions & evaluations;publish early findings 250 million committed over 5 yearsYear 1Developing,planningYear 2Year 3Year 4Year 5Implementing interventions, collecting dataPhase II: Focus on continuing interventions, tracking andevaluations, as well as sustainability and disseminationYear 6Year 7Year 8Year 9Year 10Issued fundingannouncementsReviewapplications,make awards
Tracking and Evaluation of Diversity MetricsCoordination and Evaluation Center (CEC)I. MEAN SCIENCE IDENTITY SCORES - BUILD AND NON-BUILD STUDENTSIN DIFFERENT TYPES OF BIOMEDICAL MAJORS7061.562.2 **60.8*57.06052.852.250403020IO0All Majors* p .00 1Biomedical Natu BUILDSciences Non-BUIDBiomedical Social Sciences
NIH Scientific Workforce Diversity 2014-2019Actions and ProgressPresentation Outline ACD Working Group on Diversity in the BiomedicalResearch Workforce recommendations and key datapoints (endorsed by the ACD in June 2012) Implementation of 2012 ACD recommendations Applications/funding: R01, K, fellowships, training awardsNational diversity trends - PhD recipientsDiversity Program Consortium (BUILD, NRMN)Tracking and evaluation of diversity metrics (CEC) 2018 ACD recommendations focused on careerindependence transition through institutional changeNIH Scientific Workforce Diversity Strategic Plan
2018 ACD WGD Recommendations (endorsed by ACD):Implementation UpdateRESULTS-BASED ACCOUNTABILITY1Diversity/inclusion metrics reporting templateFACULTY INSTITUTIONAL RECRUITMENT FOR SUSTAINABLE TRANSFORMATION (FIRST)Career-independence transition: Facultydevelopment institutional FOA for cohort model2NIH ADVANCING DIVERSITY PROGRAMS CONFERENCE (JUNE 24, 2019)3National diversity/inclusion conferenceENHANCE MENTORING AND PROFESSIONAL DEVELOPMENT4Diversity supplements: Trans-agency standards
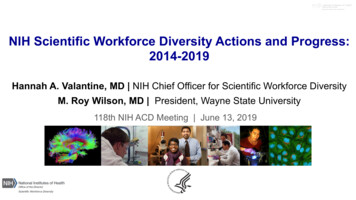
Decoupling the Minority PhD Talent Pool andAssistant Professor HiringPopulation Growth Relative to 1980(-fold)109876 -54321 URM Ph.D.URM Asst. Prof.WR Ph.D.WR Asst. Prof. 01981 1985 1989 1993 1997 2001 2005 2009 2013Gibbs, K. D., et al. (2016). Decoupling the minority PhD talent pool and assistant professor hiring in the medical school basic science departments in the US.
NIH Distinguished Scholars Program Goals:Cohort Model in NIH’s Intramural Research program Institutional transformation by recruiting asubstantial number of PIs with demonstratedcommitment to inclusive excellence (15 per year) Build self-reinforcing community of PIs committed todiversity and inclusion Provide professional development and culture thatvalues mentoring and inclusion Send the message that NIH values a commitment toinclusive excellenceExtramural: Request for Information (RFI): Institutional Accountability to Promote Inclusive ExcellenceRelease Date : February 25, 2019; Response Date: June 14, 2019
} lJ) .W"-'"'1 IIIT.t m '"' G!.n.:. - &-1.31.i- -.;''.;f \ID. "" formationFIRST Program Goals Promote inclusive excellence Address racial/ethnic, gender gaps in postdoc faculty transitionsFIRSTapproachwould be the first nationwide attempt to enhance inclusive Integratedexcellence through NIH-funded institutional transformation Recruitment, outreach, implicit-bias education, mentoring, career development Institutional transformation- ----- -- Recruit critical mass of PIs with demonstrated commitment to diversity and inclusion Professional development and culture that values mentoring and inclusion Institution sends message that it values diversity and inclusion
}1)) G!.n.:. - .W"-'"'1 IIIT.t - m '"' ,s,,'&-1. - -.:'.;f ID. "" Progress on Key Data Points (2018)Summary Research Grants - R01– Increase in # URG applicants– Increase in # awardees and award rate– B/AA – White gap slightly narrowedGreat mindsthink differently QUESTIONS AND DISCUSSION Mentored Career development – K series– Increase # URG applicants, # awardees and award rate– B/AA – White gap significantly narrowed Predoctoral and postdoctoral fellowships– Increase in # URGs PhD recipients (Life science, chemistry, math)– Increase in # URGs (14% of pool)
National diversity trends - PhD recipients Diversity Program Consortium (BUILD, NRMN) . Tracking and evaluation of diversity metrics (CEC) ACD recommendations focused on career. 2018 - independence transition through institutional change. NIH Scientific Workforce Diversity Strategic Plan . African American applicants: 17.1% .