Transcription
UNIVERSITY OF CALIFORNIAOffice of the Chief Investment OfficerUC Retirement Savings ProgramInvestment Performance and Program Reviewas of June 30, 2019Growing Portfolios Building PartnershipsUC Investments
Plan and People2
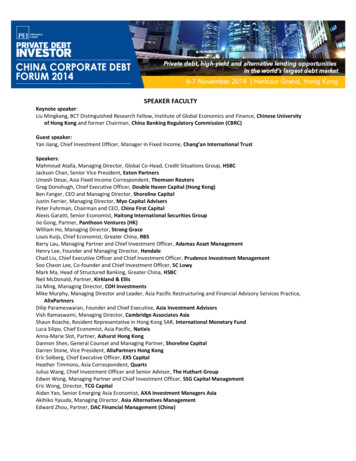
UC Retirement Savings Program at a GlanceUC Retirement Savings ProgramDeliver the best in class DC plan focused on participant outcomes through superior performance and cost managementUC Retirement Savings Program Facts 25.6 billion across 3 plans Established in 1967 Almost 320,000 Participants 25.6 billion in assets 3 Plans: 403(b), 457(b), DC Plan 25.6B 2nd largest public DC plan in the US Largest 403(b) plan in the US Target Date Fund (Pathway) default since 2014 9.8 billion in Target Date FundsAs of June 30, 2019Tax Deferred 403(b) Plan: 17.9B71%457(b) Deferred Compensation Plan: 3.1B11%Defined Contribution Plan: 4.6B18%3
UC Retirement Savings Program Evolution2017/2018Party manager for PathwayWhite labeled all FundsMoved to Institutional Vehicles3rdUCRSP Assets and Evolution 1967-20182015Lineupstreamlined from64 to 16 d1987Added FidelityMutual Funds2004457(b) Planadded1967Plan InceptionAs of June 30, 20194
Investment Options at a GlanceTARGET DATE FUNDS - 9.8 billionUC Pathway FundsUC Pathway Income FundUC Pathway Fund 2015UC Pathway Fund 2020UC Pathway Fund 2025UC Pathway Fund 2030UC Pathway Fund 2035UC Pathway Fund 2040UC Pathway Fund 2045UC Pathway Fund 2050UC Pathway Fund 2055UC Pathway Fund 2060CORE FUNDS - 14.1 billionBond and Stock InvestmentsBond InvestmentsShort-TermUC Savings FundDomestic StockLarge CapUC Growth Company FundIntermediate-TermUC Bond FundSmall CapUC Domestic Small Cap Equity FundInflation-ProtectedUC Short Term TIPS FundUC TIPS FundBroad CapUC Domestic Equity Index FundForeign StockDeveloped MarketsUC International Equity Index FundUC Diversified International FundEmerging MarketsUC Emerging Markets Equity FundSpecialty StockUC Real Estate FundUC Social Equity FundBROKERAGE WINDOW - 1.7 billionFidelity BROKERAGELINK As of June 30, 20195
Core Lineup Assets - DetailsCORE FUNDS - 14,058Bond and Stock InvestmentsBond Investments - 5,489Domestic Stock - 6,600Intermediate-TermUC Bond Fund - 1,254Small CapUC Domestic Small Cap Equity Fund - 502Inflation-ProtectedUC Short Term TIPS Fund - 55UC TIPS Fund - 236Broad CapUC Domestic Equity Index Fund - 5,114Short-TermUC Savings Fund - 3,944Market Value in Millions, as of June 30, 2019Large CapUC Growth Company Fund - 984Foreign/Global Stock - 1,310Developed MarketsUC International Equity Index Fund - 965UC Diversified International Fund - 133Emerging MarketsUC Emerging Markets Equity Fund - 212Specialty Stock - 659UC Real Estate Fund - 239UC Social Equity Fund - 4206
Defined Contribution TeamMarco Merz, CFAHead of DefinedContribution Joined University of California in 201610 year career at BlackRockMost recently Senior Strategist for Defined ContributionFocus on Target Date Fund & Core lineup implementationFrequent speaker at DC Industry conferences including P&I, II and IMCAArthur Guimaraes, CPA, CBVChief Operating Officer Joined University of California in 2014Led UC glide path review and fund rationalization in 201510 year career in pension management in the US and CanadaMost recently, Vice President, Alberta Investment Management Co.Previously, senior member of Group Savings & Retirement team at Manulife7
5 Year Review
Changes over last 5 YearsPlan Enhancement Initiatives Streamlined fund choices from 74 to 13 Reduced average management fee from 14 bps to 6 bps Saved participants 25 million over 5 yearsAUM exNumber ofBrokerage ( bln) FundsManagement Fee Management Fee (mln)(bps)2015 18.974 25.9142016 18.916 18.2102017 20.915 20.8102018 22.613 13.069
Plan Design EnhancementsTop 30 Investment Consultants suggest enhancements in 2018that we incorporated in this fiscal yearReview Target Date FundReviewed Pathway and hired 3rd party via RFPEvaluate Investment FeesCompleted fee analysis and reduced fees by over 6million annually by moving to institutional fund vehiclesEvaluate How Plan Costs Are PaidUpdated approach to management feesEvaluate Administrative FeesMoved to flat per participant fee in line withconsultant recommendationsSimplify Core LineupWhite labeled 3 funds for a more intuitive namingconvention and eliminated 2 redundant investments10
Optimal Investment StructureUC Lineup now follows industry best practiceActiveUCPassiveTier 1: Default OptionTier 2: Core LineupCustom Target Date FundCapital Preservation: 1 FundHybridFixed Income: 1 FundEquity: 8 FundsInflation Protection: 2 FundsOptimalCustom Target Date FundCapital Preservation: 1 FundFixed Income: 2 FundsEquity: 6 FundsInflation Protection: 1 Fund11
Fiscal Year 2018/2019 Project PlanI.Overview of ChangesImplementation DateTransition 3 Vanguard mutual funds to separate accounts at SSgA9/30/2018II. Implement High Yield active manager in Pathway3/31/2019III. Transition Diversified International Fund to Class 2 Fund6/30/2019IV. Transition Pathway 2015 vintage into Pathway Income12/31/2019V. Launch Pathway 206512/31/2019Lineup changes will: Reduce fees by over 1.1 million annuallyIncrease expected return through active implementation of Pathway’s High Yield componentStreamline line up by consolidating Pathway 2015 into Pathway Income which will have sameallocations on 12/31/19Maintain existing Pathway vintage structure by launching Pathway 206512
Target Date Fund - Pathway
Pathway – Our Target Date FundDesigned to support participants’ spending throughout retirementLongShortTime HorizonPathway 2060Pathway 2055Pathway 2050Pathway Key Features An equity landing point of 30% with static allocations at andthrough retirementPathway 2045 Focus on diversification with broad asset class exposuresPathway 2040 Utilizes a strategic glidepath to help mitigate the risksassociated with market timingPathway 2035Pathway 2030Key Benefits for ParticipantsU.S. Large Cap EquityU.S. Small/Mid Cap EquityPathway 2025International Equity Constructed to navigate the major sources of uncertaintyparticipants faceEmerging Market EquityReal Estate/CommoditiesPathway 2020U.S. Bonds/Short Term Seeks to reduce volatility in an effort to keep participantssaving and investing across market cyclesU.S. TIPSdHigher Continuous research to anticipate, assess and adapt ahead ofevolving conditions to help meet participant needs now and inthe futurePathway IncomeInvestment RiskLower14
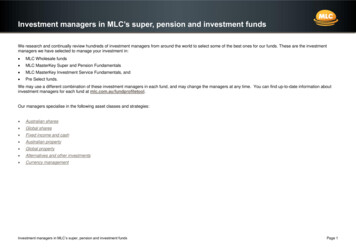
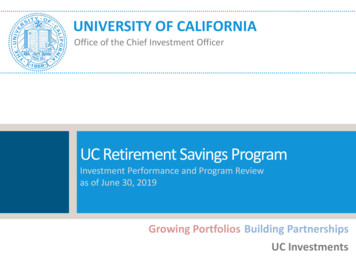
Pathway GlidepathPathway GlidePath Evolution vs. TDF providersAs of June 30, 201915
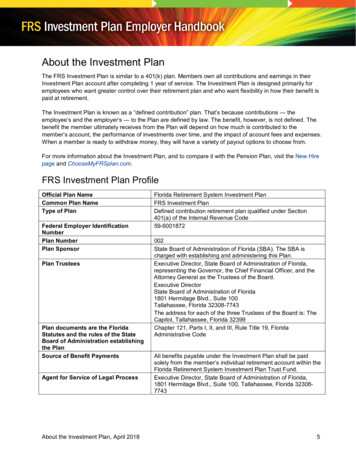
Pathway Performance – Quarter and 1 YearQ2 2019 performance relative to policy benchmarksNet of fee returns 2050Pathway2055Pathway2060Fund Policy Benchmark Value 2One year performance relative to policy benchmarksNet of fee returns (%) - thway2045Pathway2050Pathway2055Pathway2060Fund Policy Benchmark Value 5As of June 30, 201916
Pathway Performance – 3 Year and 5 Year3 year performance relative to policy benchmarksNet of fee returns 2050Pathway2055Pathway2060Fund 1.12Policy Benchmark 1.28Value 15-0.165 year performance relative to policy benchmarksNet of fee returns 2050Pathway2055Pathway2060Fund Policy Benchmark Value s of June 30, 201917
Detailed Performance
Core Lineup Performance - DetailsAnnualized Total Return (%)US Large EquityUC Domes ti c Equi ty Index FundRus s el l 3000 TF IndexValue AddedUC Soci a l Index FundMarket Value ( M)% of Program3 MonthsOne YearThree YearFive YearTen Year 0.3810.220.1614.7914.660.13 11.5611.66-0.1015.6015.72-0.12 836.740.0914.3314.250.08 970.337.016.640.37Spl i ced Soci a l IndexValue AddedUS Small/Mid Cap EquityUC Domes ti c Sma l l Ca p Index FundSma l l Ca p Spl i ced IndexValue AddedGlobal/World ex-US EquityUC Interna ti ona l Equi ty Index FundMSCI Worl d ex-US TF IndexValue AddedAs of June 30, 201919
Core Lineup Performance - DetailsAnnualized Total Return (%)Capital PreservationMarket Value ( M)UC Sa vi ngs Fund 3,944Two-Yea r U.S. Trea s ury Notes Income ReturnValue AddedInflation SensitiveUC Short Term TIPS Fund 55Ba rcl a ys 1-3 Yea r U.S. TIPS IndexValue AddedUC TIPS Fund 236Ba rcl a ys US TIPS IndexValue AddedDiversified Fixed IncomeUC Bond Fund 1,254Ba rcl a ys Aggrega te Fi xed Income Benchma rkValue AddedNew Large EquityUC Growth Compa ny Fund 984Rus s el l 3000 GrowthValue AddedWorld ex-US EquityUC Di vers i fi ed Intl . Fund 133MSCI EAFEValue AddedUC Emergi ng Ma rkets Fund 212MSCI Emergi ng Ma rkets IndexValue AddedReal EstateUC Rea l Es ta te Fund 239REIT Spl i ced IndexValue AddedAs of June 30, 2019% of Program3 MonthsOne YearThree YearFive YearTen .553.230.327.417.250.1615.3115.250.0620
Target Date Funds Performance - DetailsAnnualized Total Return (%)Target Date FundsUC Pa thwa y Income FundPol i cy Benchma rkValue AddedUC Pa thwa y Fund 2015Pol i cy Benchma rkValue AddedUC Pa thwa y Fund 2020Pol i cy Benchma rkValue AddedUC Pa thwa y Fund 2025Market Value ( M) 1,030% of Program4.02%3 Months2.322.35-0.03One Year5.225.37-0.15Three Year5.225.170.05Five Year3.533.370.16Ten Year4.554.080.47 3.470.145.745.410.33 4.480.156.846.610.23 1,5295.98%Pol i cy Benchma rkValue AddedUC Pa thwa y Fund .097.367.150.21 1,4615.71%Pol i cy Benchma rkValue AddedUC Pa thwa y Fund .077.817.640.17 95.430.068.268.070.19Pol i cy Benchma rkValue AddedAs of June 30, 201921
Target Date Funds Performance - DetailsAnnualized Total Return (%)Target Date FundsUC Pa thwa y Fund 2040Pol i cy Benchma rkMarket Value ( M) 893% of Program3.49%3 Months3.663.660.00One Year5.745.700.04Three Year9.619.74-0.13Five Year5.725.680.04Ten Year8.598.430.16 45.920.028.978.820.15 86.160.029.469.340.12 06.250.059.909.740.16 040.020.05-0.160.050.15Value AddedUC Pa thwa y Fund 2045Pol i cy Benchma rkValue AddedUC Pa thwa y Fund 2050Pol i cy Benchma rkValue AddedUC Pa thwa y Fund 2055Pol i cy Benchma rkValue AddedUC Pa thwa y Fund 2060Pol i cy Benchma rkValue AddedAs of June 30, 201922
Appendix
Last Fiscal Year lineup changesOverview of ChangesImplementation DateI.Repackaged Fidelity and DFA funds to institutional funds10/02/2017II.Renamed 3 Vanguard funds to easier naming convention10/02/2017III. Eliminated the UC Balanced Growth and UC Global funds10/02/2017IV. Implemented 3rd party manager for Pathway12/31/2017Lineup changes highlights:Transitioned 9.4 billion into new funds (38% of UCRSP plan assets);Completed a multi-stage communication campaign that reached over 300,000 participants;Reduced fees by over 7 million annually;Reduced operational complexity and risk;Allow participants to better understand their risk exposure; andImplement an easy to understand and consistent naming convention for all funds.24
Target Date Fund (Pathway) default since 2014 9.8 billion in Target Date Funds. UC Retirement Savings Program Facts. 25.6 billion across 3 plans. Deliver the best in class DC plan focused on participant outcomes through superior performance and cost management . UC Retirement Savings Program. 25.6B. Tax Deferred 403(b) Plan: 17.9B 71%