Transcription
Community HealthAssessment andNeeds Survey2021
2021 Community Health Assessment & Needs Survey1
Table of ContentsExecutive Summary. 3Acknowledgements. 5Community Profiles & Survey Results.34Cameron. 35Tuba City Regional Health CareCorporation. 6Coalmine. 40Coppermine. 45Dinnebito. 50COVID-19. 7Gap-Bodaway. 55Kaibeto. 60Underlying Health Conditions. 13Adult Obesity.14Childhood Obesity. 15LeChee. 65Moencopi.70Tonalea. 75Diabetes. 16Tuba City. 80Diabetes in Pregnancy. 17Hypertension and Heart Disease. 18 References. 85Mood Disorders. 19Substance Abuse.20Suicide. 21Unintentional Injuries. 22Access to Care. 23Patient-Centered Medical Home.24Insurance. 24Telehealth and Telemedicine. 25Social Determinants of Health.26Water and Indoor Plumbing. 27Electric. 27Housing. 28Employment. 29Food Access. 30Internet Access. 31Health Status. 32Health Behaviors. 332021 Community Health Assessment & Needs Survey2
Executive SummaryThe Tuba City Regional Health Care Corporation (TCRHCC) Community Health Division completes aCommunity Health Assessment and Needs Survey approximately every three years. The information includedis specific to the tribal communities served by Tuba City Regional Health Care Corporation. The service areaincludes Navajo communities of Cameron, Coalmine Canyon, Coppermine, Dinnebito (Hard Rock Chapter),Gap-Bodaway, Kaibeto, LeChee, Tonalea, and Tuba City; the San Juan Southern Paiute Community; and theHopi Village of Moencopi. In a few sections where noted, the Assessment may include information onindividuals living in surrounding communities served by TCRHCC, such as but not limited to Flagstaff, Page,Grand Canyon, and Shonto.TCRHCC is a tribal health organization and a 501(c)(3) nonprofit organization. Since September 2002,TCRHCC has had a P.L. 93-638 Indian Self-Determination contract with the Secretary of Health and HumanServices and the Indian Health Service. In July 2010, TCRHCC was granted Title V of the Indian SelfDetermination and Education Assistance Act (25U.C.S 450 et seq.). Today, TCRHCC is in its nineteenth yearof operation as a 638 tribal healthcare organization and continues to grow as a health care system, a regionalreferral center, and a public health authority.PurposeThe Community Health Assessment and Needs Survey serves as a foundation for developing CommunityHealth Improvement Plans (CHIP). The document is shared with Chapter communities and other communitypartners so that each community may utilize the information to develop their own plans for community healthimprovement. It will also be shared with other tribal, county, state, and regional partners. The informationgathered aids in planning TCRHCC services and programs, including Mobile Medical and Dental Clinics,public health services, and other community health programs.Data CollectionThe 2021 Community Health Assessment contains data from diverse sources. At the time of publishing, 2020census data was not yet available and any census data specific to the communities served was extremelylimited. Due to the geography of Arizona counties; shared zip codes amongst communities on and off triballands; and frequent movement from community to community both on and off tribal lands, data on the peopleliving in the Tuba City Service Area is difficult to obtain from federal and state sources. As a proxy, thisCommunity Health Assessment utilizes data from the TCRHCC electronic health record sorted by eachpatient’s community of residence.Survey responses, collected September-November 2021, have been received from more than 700 residents orapproximately 3.8% of the 18 and older population of each of the ten communities served. The survey asksabout demographics, including employment, housing, utilities, and transportation; health status and behaviorsquestions, most of which are adapted from validated screening tools or the CDC’s Behavioral Risk FactorSurveillance System surveys; health care access; and community health-related needs and priorities. Navajolanguage interpreters delivered surveys to ensure that the unique experiences and needs of the Navajo-speakingpopulation were gathered.2021 Community Health Assessment & Needs Survey3
Data on the COVID-19 pandemic was obtained using testing and other data sources that TCRHCC has used totrack data throughout the pandemic. These methods were developed primarily by the TCRHCC EpidemicResponse Team in collaboration with staff from the Centers for Disease Control and Prevention, who weredeployed to TCRHCC and the Navajo Nation from April to September 2020. Some data was also obtainedfrom various TCRHCC services.Lastly, data was also collected through ‘welfare check’ forms. From April 2020 to present day, the TCRHCCCommunity Health Division interviewed community members in COVID isolation or quarantine about thenumber of people living in their home, home utilities and transportation, and the resources they needed to stayisolated. While this was for the primary purpose of delivering resources to households, it also provided usefuldata for the Community Health Assessment.FindingsThe COVID-19 pandemic severely affected health outcomes in a wide variety of ways. Our tribal communitiesexperience COVID-related hospitalization and death rates twice the overall Coconino County rate. Despitemaking up only about 26% of the Coconino County population, Native Americans accounted for 75% of thetotal Coconino County COVID-19 deaths (March 2020-October 2021 data). The Navajo Nation wasdisproportionately impacted by the COVID-19 pandemic due to a super-spreader event on March 7th, 2020;crowded living conditions; 30% of homes lacking running water; lack of access to culturally-tailored andNavajo language information; and a high rate of comorbidities, such as obesity, diabetes, and substance abuse.The future of the COVID-19 pandemic and its long-term effect on our community members is still uncertain.The Community Health Division has selected to focus this Community Health Assessment on informationrelated to COVID-19 and the underlying conditions (obesity, diabetes, substance abuse, hypertension) andsocial determinants of health (water, housing, employment, access to care, electric, access to internet, access tohealthy foods, and access to healthcare) that were responsible for the severity of the pandemic for thecommunities we serve.Another important finding in the community surveys is the variety of what community members considercommunity health problems. While substance abuse, diabetes, and COVID-19 were often identified ascommunity health problems, so were trash, animal control, water, electric, and housing. Social and economicissues are also very important in our community members health and well-being. As a healthcare organization,these concerns may be considered outside of our scope, but our community members clearly consider them acentral part of their community’s health. TCRHCC looks forward to supporting communities in developingsolutions to these problems.Lastly, obesity continues to be a significant problem across our communities. More than 50% of adults areobese and another 25% are overweight. This might be an overestimate as those at a healthy weight may havebeen less likely to have a healthcare visit that included a weight and height in the last three years. However,Fitnessgram data of 9-12 year olds attending schools within our tribal communities also show that for the firsttime since 2006, less than half were at a healthy weight and more than 30% were considered obese as of Fall2019 measurement. Obesity is associated with an increased risk of chronic diseases, such as diabetes,hypertension, heart disease, and cancer. It is also associated with an increased risk of severe illness and deathfrom COVID-19 infection.2021 Community Health Assessment & Needs Survey4
AcknowledgmentsIt is important to recognize the individuals and teams that contributed to the 2021Community Health Assessment. These include:Community Health Leadership Team Ms. Dollie Smallcanyon, Chief Community Health Services Officer LCDR Anathea Edleman, Public Health Director Ms. Mitze Lee, Native Connections Program Director Mr. Lyndon Endischee, Environmental Health Officer II Ms. Mary Degnan, Diabetes Education and Clinical Nutrition Director Mr. Alfonso Bitsuie, Health Promotion Diabetes Prevention Director Ms. Marlana Wilson, Interim Public Health Nursing Manager Ms. Pearl Curley, Native and Spiritual Medicine Coordinator Ms. Joni Nakaideneh, Executive AssistantMr. Jacob Moul, Public Health Data AnalystDr. James Decker, Chief of Mental Health ServicesDr. Amanda Burrage, Physician Medical Epidemiology Advisor and EpidemicResponse Team LeadThe Community Health Survey Team: Ms. Michelle Attakai, Ms. Louise Jackson,and Ms. Violet YazzieMs. Rajean Victor, Public Health NurseTCRHCC Community Health Division2021 Community Health Assessment & Needs Survey5
Tuba City Regional Health Care CorporationMISSION: To provide safe, accessible, quality, and culturally sensitive health care.VISION: Embracing healthy living to heal, to respect, to console.VALUES: We take pride and honor in the dignity in all individuals. We promise to uphold a safeenvironment dedicated to quality and a vision of excellence for today and tomorrow.2021 Board of DirectorsChristopher Curley (BA)PresidentTonalea ChapterTincer Nez, Sr.Vice PresidentCoalmine Canyon ChapterDolly Lane (MBA)MemberBodaway Gap ChapterJustice M. Beard (M. Ed.)MemberTo’Nanees’Dizi ChapterLyonel Tso (M. Ed.)MemberLeChee ChapterThomas McCabe (BS)Franklin FowlerMemberCameron ChapterMemberKaibeto ChapterLeila McCabe (M.Ed.)MemberCarmelita HomerMemberCoppermine ChapterSan Juan Southern Paiute TribeVacant, Moenkopi VillageSenior Leadership CouncilLynette Bonar, RN, BSN, MBA, FACHEChief Executive OfficerJoette Walters, RN, MSN/MBADollie Smallcanyon, RN, MSNChief Community Health Services OfficerJulius Young, II, MBAAssociate Executive OfficerRiad Abdelkarim, MD, MHCM, FACPChief Medical OfficerJudy Lunbery, RN, MSNChief Nursing OfficerChief Support Services OfficerNatalia Hatathli, MT, AMT, MPHChief Ancillary OfficerJeff Wright, MHAInterim Chief Operating OfficerChristine Keyonnie, CPA, MSAChief Financial OfficerElizabeth Lally, MDChief of Internal MedicineJulia Billy, MHAChief Quality Officer MenteeSharr Yazzie, MBA, SHRM-CPChief Human Resources OfficerStephen Holve, MDChief of StaffSophina Calderon, MDDeputy Chief of StaffShawn Davis, MISChief Information OfficerAlvina Tunney-Patterson, MBA, CHCChief Compliance Officer2021 Community Health Assessment & Needs Survey6
COVID-19At the time of our 2018 Community Health Assessment, COVID-19 did not exist. SinceMarch 2020, COVID-19 has become a global pandemic, a national public health emergency,and a serious threat to the health and well-being of our community members.COVID-19 (coronavirus disease 2019) is a disease caused by the SARS-CoV-2 virus and wasdiscovered in December 2019 in Wuhan, China. It is very contagious and has quickly spreadaround the world.COVID-19 spreads when an infected person breathes out droplets and very small particles thatcontain the virus. These droplets and particles can be breathed in by other people or land ontheir eyes, noses, or mouth. In some circumstances, they may contaminate surfaces they touch.People who are closer than 6 feet from the infected person are most likely to get infected.Symptoms may include shortness of breath, body aches, chills, cough, headache, runny nose,sore throat, vomiting or diarrhea, and loss of smell or taste. Most people with COVID-19 havemild symptoms, but some people become severely ill. Some people including those with minoror no symptoms may suffer from post-COVID conditions — or “long COVID”. Older adultsand people who have underlying medical conditions are at increased risk of severe illness fromCOVID-19. Native Americans have been disproportionately affected by COVID-19.2021 Community Health Assessment & Needs Survey7
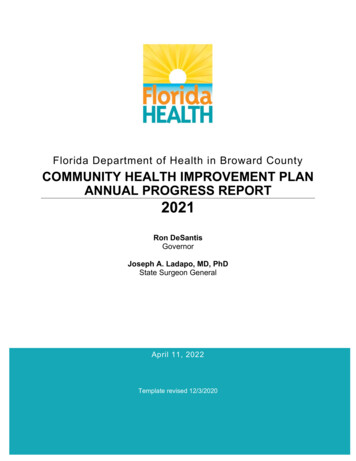
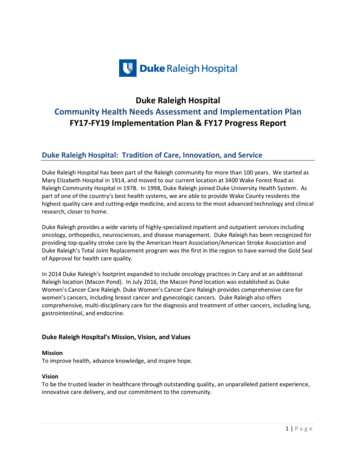
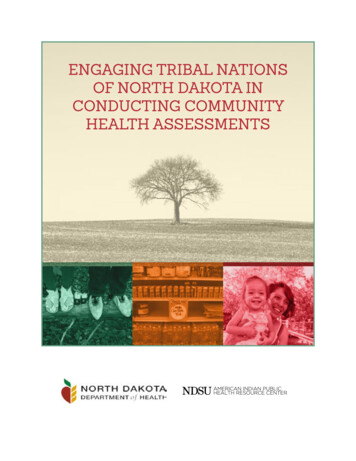
COVID-19400Weekly Epi Curve3002001000MaA r. '2pM r. ' 0a 2M y. ' 0ay 20Ju . '2n 0Ju . '20A l. 'u 2A g. '20u 0Seg. '2p 0O . '2ct 0O . '2cN t. '20ov 0D . '2eD c. '20ec 0Ja . '20Fen. '21bFe . '2M b. '21aA r. '21pM r. ' 1a 2M y. ' 1ay 21Ju . '2n 1Ju . '21lJ . '2A ul. ' 1u 2Seg. '211Sep. '2p. 1O '2cN t. '21ov 1N . '2ov 1. '21Total CasesThe graph below shows the weekly number of COVID-19 cases since March 17, 2020 when the first cases inour Service Area were identified. The darker red color includes cases that live in tribal communities withinthe Service Area, regardless of where they were tested. The orange color identifies those cases that liveoutside of the Service Area, such as Flagstaff, Page, or other Service Areas, but were tested or receivedhospital care with TCRHCC. From December 2020 to January 2021, TCRHCC had more than 300 newCOVID cases per week. This data is current as of November, 2021.Testing Rates1600137111439146864572290Total Tests706050403020100Outside Service AreaMaM r. '2a 0A r. '2pr 0M . '2a 0M y. ' ay.Ju ' n.Ju '20A l. '2ug 0A . ' ugSe . ' pO . '20ctO . '20cN t. '2ov 0D . '2ec 0D . '2ec 0Ja . '20nFe . '2b. 1Fe '2b 1M . '2a 1A r. '2pr 1M . '2a 1M y. ' ay.Ju ' n.Ju '21l.Ju '21A l. '2ug 1Se . ' pSe . '2p 1O . '21ctN . '2ov 1N . '2ov 1. '21Percent Positive(%)Inside Service AreaInside Service AreaOutside Service AreaPercent Positive (%)The graph above shows the total number of COVID-19 tests each week and the percentage of tests that werepositive. For example, in March-April 2020, TCRHCC had very limited testing availability and only tested thesickest patients: less than 200 tests were done per week and up to nearly 70% of these returned positive results. InNovember 2020-January 2021, more than 1000 tests were done each week. During the darkest days of the wintersurge, 25% or more of these were returning positive. Between March 2020 and October 2021, TCRHCCperformed more than 55,000 COVID tests.2021 Community Health Assessment & Needs Survey8
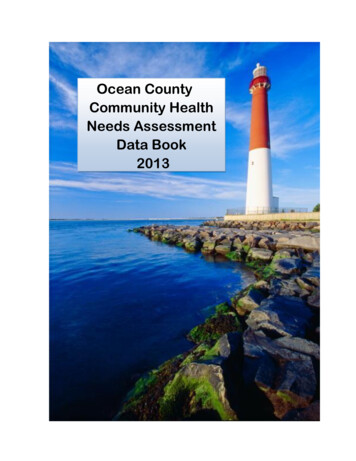
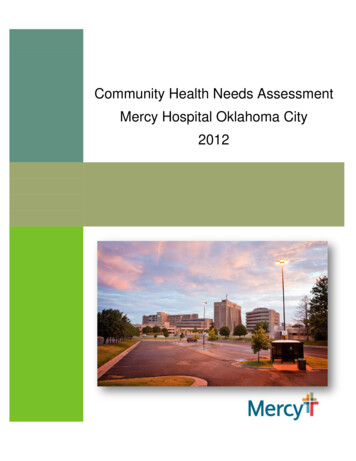
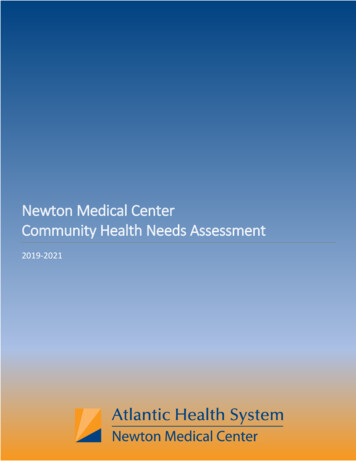
COVID-19 Outcomes by Age GroupBetween March 2020-October 2021, 14% of all Service Area COVID-19 cases were hospitalized,compared to 7.1% for Coconino County overall. 2.7% of Service Area COVID-19 cases resultedin death compared to 1.5% for Coconino County overall. Although Native Americans compriseonly 26% of the Coconino County population, 75% of all COVID-19 deaths in Coconino Countywere Native Americans.Percent of CasesProportion of Cases Hospitalized by Age100%80%60%40%20%0%0-1920-3940-5960-79 80Age GroupMissing DataNot HospitalizedHospitalizedPercent of CasesProportion of Recovered Cases by Age100%75%50%25%0%0-1920-3940-5960-79 80Age GroupRecovered2021 Community Health Assessment & Needs SurveyDeceased9
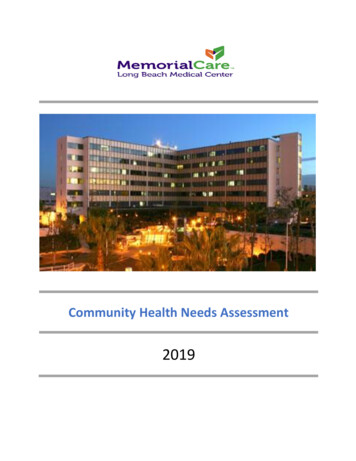
Estimated COVID-19 PrevalenceTuba City Service AreaEstimated Prevalence by CommunityCOVID-19 prevalence does not21.5%include people who had the virusCameron18.6%but never had a positive test result.In spring 2020, testing capacityCoal Mine20.9%Copper copi18.1%Tonalea15.6%Tuba City17.6%Bodaway/Gapwas limited and many people withmild to moderate symptoms maynot have been tested. Even aftertesting capacity increased, peoplewho were asymptomatic or hadmild symptoms may not havebeen tested. One study fromNational Institutes of Healthsuggests that for each persondiagnosed with COVID in the firsthalf of 2020, another 4.8 peoplehad undiagnosed COVID.Estimated Prevalence by Age Group Within the Service Area0-1912.620-3917.740-5920.760-7919.880.2 80 19.480.60%10%87.482.379.320%30%Type something40%COVID Positive50%60%70%80%90%100%No Documented COVID Infection2021 Community Health Assessment & Needs Survey10
COVID-19 Vaccination Effort inTuba City Service AreaCumulative Vaccinations Over TimeDecJa .Fen.Feb.M b.aA r.pM r.ayM .ayJu .nJu .A l.uA g.uSeg.pO .ctN .oD v.ec.100%80%60%40%20%0%Fully ImmunizedVaccineNo. of DosesGivenJohnson Pediatric1154Partially Immunized5,290UnvaccinatedBooster Doses Givenas of December 3, 2021TCRHCC received the first shipment of COVID-19 vaccine on December 15, 2020 and began vaccinatinghealth care workers and first responders the following day. On December 29, we were able to startvaccinating elders, and on January 15 TCRHCC held its first mass vaccination event.(does not include TCRHCC patients living outside of Service Area tribalcommunities)Service AreaVaccinationBreakdown byAge (as of 12/10/21)5-1112-1516-3435-5455-6465-7475 VaccinatedReceivedBooster ShotUnvaccinatedCommunityVaccinationProgress (as of12/10/21)2021 Community Health Assessment & Needs Survey11
Vaccination Rates by Age Group and Communityas of 12/10/21Bodaway/Gap Chapter5-1112-1516-3435-5455-6465-7475 0%Cameron Chapter5-1112-1516-3435-5455-6465-7475 20%40%60%80%100%0%20%Coal Mine Chapter5-1112-1516-3435-5455-6465-7475 0%40%60%Copper Mine 0%80%100%5-1112-1516-3435-5455-6465-7475 100%Kaibeto Chapter0%20%40%60%80%100%Moencopi Villages5-1112-1516-3435-5455-6465-7475 20%40%60%80%100%0%20%Tonalea Chapter5-1112-1516-3435-5455-6465-7475 0%80%5-1112-1516-3435-5455-6465-7475 LeChee Chapter0%100%5-1112-1516-3435-5455-6465-7475 5-1112-1516-3435-5455-6465-7475 0%80%40%60%80%100%Tuba City Chapter5-1112-1516-3435-5455-6465-7475 20%40%60%Fully Vaccinated80%100%0%20%Partially Vaccinated2021 Community Health Assessment & Needs Survey40%60%80%100%Unvaccinated12
Underlying Health Conditions2021 Community Health Assessment & Needs Survey13
Adult ObesityAdultsObese (BMI 30)Overweight(BMI 25-29)HealthyWeight (BMI18.5-24.9)Of community members 18 who have been seen at TCRHCC in the last threeyears and live in the TCRHCC Service Area, 82% had a measured weight andheight. As the infographic above shows, just over 50% were obese and another25% or more were overweight. Adults at a healthy weight may be less likely tohave a visit in the last three years and less likely to have a measured weight.Obesity may be overestimated in this data.Body mass index, or BMI, is calculated using weight and height. Obesity is themost common health condition in our community members. Obesity is associatedwith an increased risk of many serious conditions, such as diabetes, high bloodpressure, high cholesterol, heart disease, stroke, certain types of cancers, sleepapnea, osteoarthritis, and mental health problems.2021 Community Health Assessment & Needs Survey14
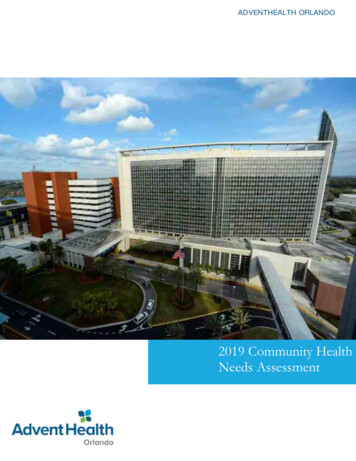
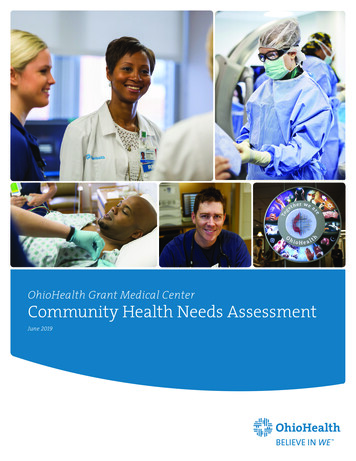
Childhood ObesityChildren aged 2-18 living in Service Area with a TCRHCC visit in last 3 years25%17%Obese (BMI 95th percentile)Overweight(BMI 85thpercentile)Healthy Weight58%In Fall 2019, 3195 nine to twelveyear old students attending allTuba City Service Area schools(excluding those that attendschools outside of Service Area)were assessed utilizing theFitnessGram assessment tomeasure childhood obesity. The2019 data shows that 49.5% ofschool aged children have ahealthy body weight while 18.4%are overweight and 30.5% areObesity is defined as a Body Mass Index or BMIfor age that is greater than the 95th percentile.Overweight is defined as a BMI for age greaterthan the 85th percentile. Children andadolescents who are overweight or obese aremore likely to become overweight or obeseadults. Childhood obesity can lead to early onsettype 2 diabetes, high blood pressure, highcholesterol, and mental health problems.2019 FitnessGram Results (n 3195)Underweight 2.00%Obese 31.00%obese. Fitnessgram assessmentswere not completed for the 2020school year due to COVID-19.More 9-12 year old kids are obeseor overweight in our schools thanever before. In fact, for the firsttime since 2006, less than ½ ofthese children are at a healthyweight. (see graphic at right)Overweight 18.00%Healthy Weight 49.00%2021 Community Health Assessment & Needs Survey15
DiabetesDiabetes is a chronic condition that affects how your body turns food into energy. Too muchblood sugar stays in your bloodstream. Over time, that can cause serious health problems, suchas heart disease, vision loss, and kidney disease.4,149Number of service area residents who have beendiagnosed with diabetes.590Number of service area residents who have beendiagnosed with pre-diabetes.Patient with diabetes canlive longer, healthier livesand reduce risks ofcomplications by:Visiting your primarycare providerGetting annual foot,eye and dental examsChoosing healthierfood options Being physically active Taking medicationregularly16.2%16.2% of the adult (18 ) population and 0.6% of those under18 been seen for diabetes or pre-diabetes since 2018.Prediabetes is also known as impaired glucose tolerance.Prediabetes is a condition in which blood sugar is elevated,but not high enough to be type 2 diabetes. With weight loss,healthy eating, and increased physical activity, progression toType 2 Diabetes is preventable.Healthy Living Center, Diabetes Education & ClinicalNutrition at TCRHCC provides these services: Diabetes Self-Management Education/Training Medical Nutrition Therapy Glucometer Teaching and Training Continuous Glucose Monitoring Teaching and Training Foot Exams, JVN Eye Screening Visits can be face to face or by telehealth, call 928 283-28952021 Community Health Assessment & Needs Survey16
Diabetes in PregnancySince 2018, out of 530 pregnancies in our servicearea population, 128 have been women withdiabetes in pregnancy.YearPregnanciesDM in Pregnancy201820613201918065202014450Diabetes in Pregnancy includes women withGestational Diabetes or Pre-existing Type 2Diabetes.Risk factors:ageGestational diabetes goes away afterdelivery, but women remain at high risk ofdeveloping type 2 diabetes and should gettested yearly. Weight loss, healthy eating,and physical activity after delivery reducethe risk. Children born to women withdiabetes in pregnancy are at increased riskof childhood obesity and diabetes.Breastfeeding reduces this risk.2021 Community Health Assessment & Needs SurveyDiabetes in Pregnancyincreases risks for:Large infants relativeto gestational ageDeliverycomplications - largerbabies are harder todeliverBirth defectsLow blood sugar ofbaby at deliveryJaundiceMiscarriageType 2 Diabetes forboth mom and baby 17
Hypertension and Heart Disease1,005Number of service area residents who have beendiagnosed with hypertension.2,063Number of service area residents who have beendiagnosed with other heart diseases.Hypertension or high blood pressure means that thepressure of blood pushing against the walls of theblood vessels is too high. A normal blood pressureis 120/80—the top number is the pressure when theheart beats and the bottom number is the pressurewhen the heart rests between beats.Risk FactorsageHigh blood pressure can increase the risk of heart attack and heart failure; stroke; andkidney disease. High blood pressure usually has no signs or symptoms, so it isimportant to have regular check-ups with a blood pressure measurement.The most common heart disease is coronary artery disease, which affects blood flow tothe heart. Heart disease may not be diagnosed until a person experiences signs orsymptoms of a heart attack, heart failure or arrythmia.Risk factors for heart disease includehigh blood pressurehigh cholesterolalcohol abuse and tobacco useobesityphysical inactivityunhealthy diets. 2021 Community Health Assessment & Needs Survey11.8%Service Area residentsdiagnosed with heartdisease.18
Mood Disorders38%Since 2018, 2,108 individualsSurvey respondents who scored a3 or higher on the PHQ4 scale,indicating psychological distress.The PHQ4 is a four questionscreening tool for anxiety anddepression.have been seen by TCRHCCproviders for help with a mooddisorder, including depression,bipolar disorder, and anxietydisorders.7.2%During the COVIDHow do mental health symptoms affect ourcommunities?While there is limited data on native communitiesspecifically, trends seem to be following those of thegeneral US population:In 2020, 4.2 million adolescents 12 to 17 received mentalhealth services in the past year.An estimated 41.4 million adults 18 or older in 2020received mental health services or took prescriptionpandemic, large numbers ofaffected people reporteddistress, including new orworsening symptoms ofdepression, anxiety, andinsomnia. Most people willrecover, though thatrecovery can take sometime. A notable fraction ofpeople will develop chronicsymptoms severe enough tomeet criteria for a mentalillness, such as posttraumatic stress disordermedication for a mental health issue in the past year.These numbers have been 25-50% higher than theprevious year (a significantly higher increase than the(PTSD) or major depressivedisorder. People whoexperience more severeaverage 5-10% per year over the last decade).stressors, such as exposureto death, and people with7% of the adult community and 3% of the pediatricpopulation served by TCRHCC has been seen for a mooddisorder in the past 3 years. more prolonged disruptionsare more likely toexperience enduringsymptoms that wouldbenefit from treatment.2021 Community Health Assessment & Needs Survey19
Substance AbuseCurrently more than 2700 residents, or 11% of theTCRHCC user population has been diagnosed with asubstance abuse disorder.What are substance use disorders?These are disorders where people are using chemicals (both legal and illegal) which arenegatively impacting their lives but they are unable to stop using them. Use of legal substanceslike alcohol and cigarettes is common, and many people find they cannot stop using them. Evenillegal substance use is common with almost 1 out of every 6 people 12 or older using them in2020.Percent of DiagnosesType of Substance Abuse806040200AlcoholStimulantOpioidAmerican Indian/Alaska Native (AI/AN) havethe highest rates of substance abuse comparedto other racial or ethnic groups in the UnitedStates (U.S). Data reveal that AI/AN have theOtherSedativeInhalantHallucinogenRelative Increase of Drug/Alcohol Related:Hospitalizations2012Deaths2016highest rates of alcohol, and drugs abuse. Likemany communities across the U.S., CoconinoCounty is not invulnerable to substance abuse.Combined with high rates of poverty, with22.2% of residents living below the federalHospital Visits and Death, Past 5 Yearspoverty line, and limited access to mentalhealth providers, substance abuse injury anddeath have been increasing among countyresidents. Analysis of alcohol/drug morbidityand mortality identified the following trends Alcohol was the most abused substance, making it the leadingamong Coconino County residents:Hospital VisitsDeathsDrugs/AlcoholEverything Elsecause of death among residents aged 35-54 years-old and thesecond leading cause of death among AmericanIndian/Alaskan Natives residents.Drug-related deaths have increased at rate 1.6 times fasterthan alcohol deaths. 2021 Community Health Assessment & Needs Survey20
Suicide179Number of documented suicide attempts since2018.WHY ADDRESS SUICIDE PREVENTION In 2019, suicide was the second leading cause of death forAmerican Indians/Alaska Natives between the ages of 10 and34.In 2019, adolescent American Indian/Alaska Native females,ages 15-19, had a death rate that was five times higher thannon-Hispanic white females in the same age group.In 2018, American Indian/Alaska Native males, ages 15-24,had a death rate that was twice that of non-Hispanic whitemales in the same age group.Relative Death Rates Female, Age15-19AI/ANMale, Age 15-24WhiteHOW AMERICAN INDIAN/ALASKA NATIVE COMMUNITIES CAN TAKE ACTIONAmerican Indian/Alaska Native communities often lack access to suicide prevention programs that meettheir cultural needs. The best way to prevent suicide is to use a culturally relevant, and comprehensiveaction that includes:Creating a vision of wellness by collecting and sharing the community’s resources.Increase protective factors by promoting culturally competent practices that reduces risk.Important protective factors that address the high rates of suicide are: Cultural Identification Native Language Spirituality Ceremonies Kinship models Family connectedness Gaining knowledge and understanding of the issues of suicide in the community where you live bygathering information from Elders and community members.2021 Community Health Assessment & Needs Survey21
Unintentional InjuriesAny TCRHCC visit related to unintentional injuries, Environment0Fal
Julius Young, II, MBA Chief Support Services Officer Natalia Hatathli, MT, AMT, MPH Chief Ancillary Officer Jeff Wright, MHA Interim Chief Operating Officer Elizabeth Lally, MD Chief of Internal Medicine Stephen Holve, MD Chief of Staff Sophina Calderon, MD Deputy Chief of Staff Alvina Tunney-Patterson, MBA, CHC Chief Compliance Officer