Transcription
INVESTMENT STRATEGY GROUPOUTLOOK 2022JANNEY MONTGOMERY SCOTT LLCPublished: December 15, 2021
As we peer into the New Year, there are no fewer challengesto consider.The pandemic is one we hoped would be a mere remnant ofthe past year. It lingers, but the world has become much moreoptimistic thanks to vaccinations and therapeutics leading toa shift to an endemic phase that could be effectively managed.Additionally, on the global stage: Simmering Sino-Americanrelations persist and a recent effort to re-engage with Iranmay lead to a détente, which could curb the near-term risksassociated with that country’s efforts to nuclearize—a potentiallydestabilizing factor in the Middle East and oil markets.Domestically, although shared globally, is a bout of inflationthat has been running higher for longer than anticipated bycentral planners. This could invoke a shift in policy settingsthat complicate the macroeconomic landscape.
I N V E S T M E N T S T R AT E G Y G R O U POUTLOOK 2022OVERVIEWCertainly, there are always variables of concern for investors. The good news is the economy seems well fortified toovercome the aforementioned challenges, barring an extreme outcome. Growth is occurring at a rapid pace and while itwill undoubtedly slow in 2022, its glide path is starting from an unusually high level. The Federal Reserve has begun toreduce its bond-buying regime to create flexibility if it needs to raise interest rates to address fears of rampant inflation.That is hardly a reason for caution, as policy will still be quite loose and likely remain well below the equilibrium rate forthe next year or two. This view comes from our belief that inflation is likely to subside to a less-threatening pace whilestaying somewhat higher than the average has been for the past 20 years. Above-average growth without the constraintof tight monetary policy should underwrite a favorable environment for risk assets.Economy & Equity Markets. Page: 4 The economy could continue to expand at an above-trend pace. Labor markets are tightening and consumers are wellendowed, both of which underpin a robust pattern of consumption. Corporate-profit growth in line with nominal GDP should lead to a healthy increase in earnings again this year. Stockprices should rise in a directionally commensurate fashion. Commodities, particularly oil and industrial metals, could build on gains from last year, as markets largely remainundersupplied against a backdrop of rising demand. Geopolitical tensions, rising prices, and the uneven success of COVID-19 treatments could serve as pressure points thatmay occasionally rattle, but should not thwart, the advance in risk assets.Fixed Income & Interest Rates.Page: 9 2022 will be a battle between inflation expectations and a supply/demand imbalance, the resolution of which will likelysee interest rates somewhat higher and the yield curve flatter. The Federal Reserve will wait until they have a clear read of post-bottleneck inflation to raise overnight interest rates,meaning one—or at most two—rate hikes late in the year. Corporate-credit fundamentals remain very strong, and spreads should contract modestly, possibly letting both investmentgrade and high-yield credit outperform Treasuries. The tax-exempt municipal markets remain a source of relative stability, as issuance is muted and demand from high-networth investors is growing amid high savings. JANNEY MONTGOMERY SCOTT LLC MEMBER: NYSE, FINRA, SIPC JANNEY OUTLOOK 2022 REF: 503552-1221 PAGE 3 OF 12
ECONOMY & EQUITY MARKETSThe U.S. economy may see moderating growth in 2022, but on balance, the fundamentallandscape remains quite attractive. We expect financial markets to be jostled from timeto time because of the impending concerns already mentioned, but that should not derailprospects for risk assets to perform. Here are our expectations for the economy, equities,and fixed income in 2022.ECONOMICSMARK LUSCHINI, CMTChief Investment StrategistPresident and ChiefInvestment Officer, JanneyCapital ManagementMark Luschini serves asJanney’s Chief InvestmentStrategist and leads theInvestment Strategy Group,which sets the firm’s view onmacroeconomics, as well asthe equity and fixed incomemarkets. In addition, Markis the President and ChiefInvestment Officer of JanneyCapital Management (JCM),the asset managementsubsidiary of JanneyMontgomery Scott. Underhis leadership, JCM hasdelivered competitive resultsacross its suite of investmentstrategies and grown itsassets under managementto more than 3.5 billion.Mark has spent more thanthirty years in the investmentindustry. He draws on thatexperience to speak on topicsrelated to macroeconomicsand the financial markets atseminars, client events andconferences. He is frequentlyquoted in publicationsranging from the Wall StreetJournal and Barron’s tothe New York Times andUSA Today. In addition, heregularly appears in variousmedia outlets includingCNBC, Fox Business News,and Bloomberg Televisionand Radio. He has anundergraduate degree inPsychology and an MBAin Finance from GannonUniversity and holds theChartered Market Technician(CMT) designation fromthe Market TechniciansAssociation.After losing some momentum in the thirdquarter, driven by the outbreak of the Deltavariant of COVID-19 and inventory logjams,the economy has re-accelerated as wemove toward the end of the year. The recentdiscovery of the new Omicron variant ofthe virus is raising concerns about mobilityrestrictions and the economic impairment itcould induce. There seems to be little publicappetite for lockdowns outside of localizedmitigation protocols, therefore, we do notlook for a marked deceleration in activityas a consequence. We have highlightedin previous reports that a vaccine-evadingmutation of the COVID-19 virus is a risk toour otherwise sanguine views about bothcurrent and forward-looking macro conditions.Obviously, time will tell to what extentOmicron, or another variant, introduces a riskto the healthcare system that is too great tobear such that policymakers have to imposetighter sanctions on public and generalsocial behavior. For now, the economy isgrowing rapidly (Chart 1) and we expect thatmomentum to persist throughout 2022, albeitto a moderating but still above-trend pace.Chart 1: US GDPeconomy. The stock market is one of themsince it has a notorious reputation for movingnot on the news of today, but rather whatinvestors extrapolate from it and projectout what it is likely to mean for share pricesnine to 12 months ahead. Chart 2 shows thericochet rebound from the pandemic lowcontinues to climb at almost a 45-degreeangle, placing exceedingly high odds thatthe expansion currently underway has muchfarther to go.Chart 2: US Leading Economic Index (LEI)(Source: Janney ISG, Conference Board)Consumers’ propensity to spend is beingmonetized in malls, restaurants, homes andfurnishings, and online purchases of goods.As a barometer of spending, retail sales,excluding automobiles, is giving a strong signalthat the consumer is flush with cash (Chart 3).Chart 3: US Retail Sales Ex Autos(Source: Janney ISG, Bureau of Economic Analysis)The Leading Economic Index (LEI) is awidely followed gauge because it includeseconomic variables that have movementsthat tend to precede changes in the overall(Source: Janney ISG, US Census Bureau) JANNEY MONTGOMERY SCOTT LLC MEMBER: NYSE, FINRA, SIPC JANNEY OUTLOOK 2022 REF: 503552-1221 PAGE 4 OF 12
Pent-up demand continues in the post-lockdown world,as consumers shift spending towards services and awayfrom goods. Furthermore, consumers are set to propeleconomic activity for quite a while. This is importantbecause personal consumption drives almost 70% ofeconomic activity in the U.S. Consider the following chartsas reasons to hold such an optimistic view.The number of those unemployed has fallen dramaticallyand will likely soon approach 4%, a level rarely seenand only 0.5% from the pre-pandemic 50-year low of3.5% (Chart 4). The tightening in the labor market shouldpromote job security and wage increases—elixir forstout consumer spending. Job growth is the key to aself-sustaining economy, in other words, one that growswithout heavy-handed monetary intervention. Chart 5further endorses our view that this is what is developing.The JOLTS (Job Openings and Labor Turnover Survey)report illustrates the number of job openings that exist.Not only are there a near-record amount of unfilled jobopenings in this country, but they exceed the number ofunemployed by approximately two million. Consequently,job creation is likely to continue at a heady pace for manymonths to come.Moreover, consumers have money to spend, with overallexcess savings standing at more than 2 trillion today. Whilethat has contributed to gains in household net worth, bothrising stock prices and home values have risen dramatically,further enriching American families. Today, householdnet worth is more than double the previous peak periodbefore the Great Financial Crisis. Empirically, householdstend to spend a portion of the gains in their wealth, so therapid climb that can be seen in Chart 6 is further evidencespending should continue to clip along.Chart 6: US Household Net Worth (Nominal USD)Chart 4: US Unemployment Rate(Source: Janney ISG, Federal Reserve)A final point about the consumer: Years of debt destructionwithout a renewed appetite to re-lever personal balancesheets in a significant way means there is considerablescope for borrowing to take place. This is particularly thecase when interest rates are so low and the service cost tocover existing family debt (Chart 7) remains near the lowestin more than a generation.Chart 7: US Household Debt Service Ratio(Source: Janney ISG, Bloomberg)Chart 5: JOLTS(Source: Janney ISG, US Census Bureau)(Source: Janney ISG, Bureau of Labor Statistics)Meanwhile, business activity is robust. The Institute forSupply Management (ISM) survey is a renowned sourceof information about current and expected order flows,employment, and capital spending plans. As shown incharts 8 and 9, the indices represent readings that are wellabove average for the past two decades. JANNEY MONTGOMERY SCOTT LLC MEMBER: NYSE, FINRA, SIPC JANNEY OUTLOOK 2022 REF: 503552-1221 PAGE 5 OF 12
Chart 8: ISM Manufacturing Indexpunches well above its weight because no other industryposes the multiplier housing construction does when youconsider all the other tertiary industries impacted by it.Chart 10: US Housing - Building Permits(Source: Janney ISG, ISM)Chart 9: ISM Non-Manufacturing Index(Source: Janney ISG, US Census Bureau)GLOBAL OUTLOOKOur primary focus on non-U.S. activity is China. A majorconcern is that China’s growth is decelerating. TheirNational Bureau of Statistics reported growth in thethird quarter was barely positive and its yearly gainof just 4.9% was the slowest in decades outside ofthe pandemic.(Source: Janney ISG, ISM)Finally, on the domestic front, housing is booming. It issaid that housing is the economy. Approximately 60% ofhouseholds own one. A house is a sizeable and durablepurchase and it is very interest-rate sensitive. Becausemost homes are purchased with a mortgage, interest ratesplay a disproportionate role in affecting housing demand.Chart 10 illustrates the strength in the housing market.Building permits are a leading indicator for housingbecause it signals activity associated with the constructionand sale of a permitted home is likely to follow. While risinghome prices could deter some would-be buyers for newor even existing homes, it has not slowed sales activity asof yet. Homebuilder sentiment is bullish based on trafficperusing new home inventories and the market for existinghomes is deeply undersupplied.Household formation is running at about 1.5 million peryear and that figure could rise as the gigantic demographiccohort known as Millennials continue to age. That shouldproduce a wave of demand, as long as jobs are steady andhousing affordability remains reasonably grounded, thatcould last through this decade. While residential investmentis a relatively small portion of GDP—at less than 5%—itChinese leaders are grappling with fallout from the overlevered property developers that fed off the constant priceappreciation in housing that was expected to continue inperpetuity. President Xi has taken a hard line on extendingcredit to the highly indebted development community,and has taken strides to cool the housing market fromChinese buyers using it as an investment vehicle. Underhis Common Prosperity initiative, he is taking steps to makehousing more affordable, including applying a property taxfor the first time.Chart 11: Chinese GDP(Source: Janney ISG, National Bureau of Statistics of China) JANNEY MONTGOMERY SCOTT LLC MEMBER: NYSE, FINRA, SIPC JANNEY OUTLOOK 2022 REF: 503552-1221 PAGE 6 OF 12
Certainly, China has introduced a few measured movesto stem the decline in growth. At best, it seems thosemoves may have stalled further erosion, but it has notbeen forceful enough to reflate activity in a meaningfulway. The consequences to other countries whose exportsfeed China’s needs for food, oil, metals, machinery, andequipment, is that trade with China represents a largeportion of their GDP. It is 15-25% in many cases, so adrop-off like the one we have seen has severe blowback,especially through the emerging-market complex. Commodities – Increasing global demand and attentivesupply management principally administered by OPECmembers Saudi Arabia and Russia should help boost oilprices. Industrial metals stand to benefit from increasedmanufacturing activity, de-carbonization, expandingpurchases of electric vehicles, and fiscal policies bothhere and abroad designed to address aged infrastructureand spur jobs and economic growth. As a hedge, goldmight offer support against a flaring geopolitical risk andpath-risk for inflation.We expect China to make a more serious effort toreaccelerate the economy in the first half of 2022. As hostsof the Winter Olympics in February, followed by PresidentXi’s inauguration as “president for life” during the fall NationalParty Congress, authorities have every reason to present theachievements of the Communist regime to the world in thebest light possible. That will serve to boost imports, whichthen should aid the growth of those export-reliant nations.Our prognostication for the U.S. stock market’s pathforward includes three potential outcomes that emanatefrom various economic scenarios that could unfold. Weassign a likelihood to each to express our confidence levelin the forecast presented. In preview, we continue to skewbullish, which is indicative of our belief in the sustainabilityof the global equity rally that’s been underway for morethan a year. While going forward it seems unrealistic thatthe returns earned in 2021 will be repeated in 2022, wedo, however, envision possible further upside that shouldprove flattering to balanced portfolios.Bottom line: We believe the macroeconomic climate isexpansive, but perhaps not synchronized. We expectinflation to cool somewhat, allowing central banks to slowlypivot to withdrawing accommodation. Overall, we believethe residual impulse from years of uber-loose monetaryconditions and an unprecedented level of fiscal stimulusunleashed over the past 18 months could keep economicmomentum sufficiently strong to overcome any lightlyimposed distortions the coronavirus, or geopolitical dustups, generate.INVESTMENT IMPLICATIONSThe following outline demonstrates how we would expressour central thesis that economic growth will continue, albeitmoderating somewhat from 2021’s sizzling pace. This, inturn, should enable the advance in stock prices, and riskassets in general, to continue. G lobal Equity Markets – U.S. equities should performwell, although valuations and margin pressures couldweigh on prices should profit growth expectations fail todevelop along the current projections. European equitiesare poised to benefit from a valuation re-rating as thecontinent’s vaccination campaign allows for the removalof COVID-19 mitigation protocols. Emerging marketsmay become attractive at some point next year since weexpect China to begin taking meaningful steps to reflateits economy in the year’s first half. S ectors – We favor overweighting pro-growth sectors,including Industrials, Materials, Energy, and Financials. TheConsumer Discretionary sector also stands to benefit fromthe potential release of over-endowed savings, particularlythroughout the service industries. Technology and HealthCare may become increasingly attractive as the year unfoldsif the growth deceleration we expect occurs in a morepronounced fashion heading into 2023. Tactically, weare favorably disposed toward small-company stocks asbeneficiaries of robust domestic conditions. JANNEY MONTGOMERY SCOTT LLC MEMBER: NYSE, FINRA, SIPC JANNEY OUTLOOK 2022 REF: 503552-1221 PAGE 7 OF 12
VARIOUS ECONOMIC SCENARIOS AND PROBABLE OUTCOMESScenario 1: NirvanaScenario 2: Navigating the CrosscurrentsThe economy grows at roughly 4%, but nominal GDPadvances at 7% or above. Since corporate revenuestend to pace near the inflation-adjusted growth rate ofthe economy, that spurs profits to rise some 8-9% yearover-year.The economy loses momentum throughout the year, butgrowth remains positive. Labor markets remain healthy,but wage gains soften as the heightened incentive tolure employees to fill job openings fades. Still, excesssavings and improved sentiment stokes consumers’propensity to spend which, in turn, drives economicactivity. Inflation remains sticky at a higher level thanmonetary officials deem comfortable, and the FederalReserve embarks on a slow but earlier-than-expectedeffort to withdraw its accommodation.Inflation, while remaining elevated, begins to subside,relieving the Federal Reserve from having to embarkon a rate-hike campaign until late in the year at theearliest. Governmental policy remains a tailwind asoutlays for infrastructure and other items prevent a fiscalcliff from occurring.Negotiations with Iran lead to a détente, cooling fears thatIran’s rapid approach to nuclear breakout capacity willlead to a heated confrontation. China, hosting the 2022Winter Olympics and later in the year celebrating the 20thNational Party Congress where President Xi is expected tobe elected to a third term, tempers any desire to provoketrade disruptions or a military confrontation.Foreign equities post particularly strong gains whiledomestically, pro-growth sectors, such as Energy,Industrials, Materials, and Financials lead. Commoditiesalso produce strong returns, led by oil and industrialmetals. The S&P 500, despite more volatility than last year,benefits from multiple expansion and climbs to 5,200.Probability: 35%Scenario 3: The Curtain FallsThe rapid pace of inflation that emerged last year fails toabate. Federal Reserve officials, realizing they have fallenwell behind the curve, begin raising rates at a pace that isquicker than expected, catching market participants offside.This occurs in concert with many other central banksaround the world, some of whom have already raised rates,which serves to slow domestic and global activity alike.COVID-19 moves to an endemic phase and restrictivelockdowns are avoided. Geopolitical tensions with Iranand China simmer but do not lead to a major volatilityinducing clash.Fiscal spending only amounts to a marginal tailwindas, like a time-release capsule, outlays occur onlyincrementally over many years. Profits grow, but marginsare squeezed by higher input costs for materialsand labor. Multiples contract, but not so much as tocounteract the rise in earnings, leading stock prices torise. Commodities, particularly oil and industrial metals,perform well as years of underinvestment and the movetoward global de-carbonization creates demand. TheS&P 500 reaches 4,900.Probability: 60% (our Base Case)BOTTOM LINE: ENSEMBLE FORECASTConsidering the probabilities around three different butplausible scenarios, we look for the S&P 500 Index toreach 5,000. Indeed, not unlike last year, we believe therisks are asymmetrical with there being greater odds thattarget is ultimately proven too low rather than too high.The combination of higher-than-average inflation anddecelerating growth promotes talk of stagflation if not theincreasing risk of a recession in 2023. With the loss of anynew fiscal impulse and higher taxes on corporations, profitsfail to materialize to the level that analysts had anticipated.Stocks are de-rated as the price-to-earnings ratio for themarket compresses and the equity risk premium rises.Defensive growth sectors are the stalwarts led byTechnology and Health Care. These sectors are eventuallyjoined in leadership by economically insensitive areas likeConsumer Staples and Utilities as the yield curve comesclose to inverting, which often foreshadows an economiccontraction. The S&P 500 Index gyrates throughout theyear, but ends about where it began—resting near 4,600.Probability: 5% JANNEY MONTGOMERY SCOTT LLC MEMBER: NYSE, FINRA, SIPC JANNEY OUTLOOK 2022 REF: 503552-1221 PAGE 8 OF 12
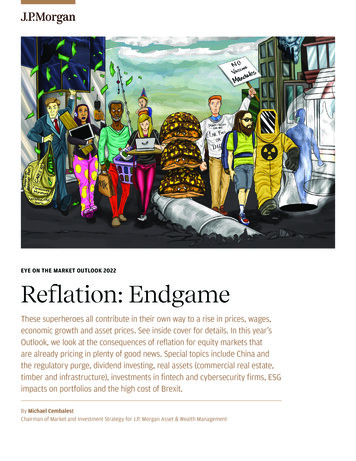
FIXED INCOME & INTEREST RATESFrom steady and consistent moves in interest rates to seemingly random volatility, 2021has had it all.GUY LEBAS, CFA Chief Fixed Income StrategistDirector of Custom FixedIncome Solutions, JanneyCapital ManagementGuy LeBas is responsiblefor providing direction tothe firm’s clients on themacroeconomic, interestrate, and bond marketinvesting climate.Guy authors bondmarket periodicals whichprovide relative valuerecommendations acrossthe fixed income spectrum.Bloomberg named him themost-accurate forecaster ofthe Treasuries market in 2015and previously recognizedhim as a “Bloomberg Best”for his work in bond marketforecasting.Prior to joining Janney in2006, Guy served as InterestRate Risk Manager for U.S.Trust’s bank asset and liabilityportfolios, a role in which heoversaw risk and return onan 11 billion balance sheet.He received his educationfrom Swarthmore Collegeand is a CFA Charterholder.Interest rates rose consistently fromJanuary’s Senate election results to March’srough auctions; fell through July as foreigndemand increased; began rising intosummer’s end as inflation worries becameprominent; and chopped their way towardswinter as over-extended positioning frommacro hedge funds took their toll.Whether you lean bullish or bearish on fixedincome markets, you had your shot in 2021,and with impending monetary policy andfiscal changes in 2022, you probably willagain. From our seats, we see two dynamicsshaping up in fixed-income markets for2022: shifting sands of inflation expectationsand big swings in the supply/demand balance.Chart 12: Long-term yields have been choppy in2021, but short-term yields have moved consistentlyhigher since .20%0.00%what level. Broadly speaking, we anticipategoods inflation will finish 2022 below 1%(that’s the normalization after 2021), servicesinflation in the mid-1% range, and housinginflation in the high-2%-to-low-3% range, thelatter as the influence of higher home pricespushes into inflation data. That combinationspeaks to a core PCE inflation rate of 2.22.5% by the end of 2022, although riskslie to the upside. By comparison, inflationmarkets are pricing a roughly 2.1-2.3% longrun core PCE inflation rate, and so if theeconomy “settles” at 2.5%, we can expect anapproximately 0.2-0.3% increase in long-runinterest rates from inflation alone, but again,there is some upside risk.Chart 13: Market pricing anticipates inflationreturning to the 2% range after the current spike4.5%4.0%Fiscal optimism afterJan. Senate runoff,culminating in weakUST Auctions3.5%3.0%Fade of initialinflation fears10yr Treasury Yield2yr Treasury YieldJay Powellbegins hintingat taperFederalReserve taperannouncementCore PCE YoY (Last Reading)Long Run Inflation Expectations(5y5y Forward Feb-21Apr-21Jun-21Aug-21Oct-21(Source: Janney ISG, Bureau of Economic Analysis, Bloomberg)(Source: Janney ISG, Bloomberg)Inflation is elevated. Core personalconsumption expenditures (PCE), the Fed’spreferred measure of inflation, reached 4.1%in the most recent annual reading—twice thecentral bank’s official target. Under normalconditions, policymakers would raise ratesto push inflation down, but these are far fromnormal conditions.Supply-and-demand dynamics in theinterest-rate markets should be volatile in2022. On the one hand, total U.S. Treasurysupply will decline as fiscal authorities run asignificantly narrower budget deficit. Muchof this supply reduction will come in theform of less short-term (T-bill) issuance, andtherefore have limited effect on longer-terminterest rates.Post-pandemic, a host of economicimbalances has triggered sharp spikes inprices of various goods and services. Manyof these spikes are one time and most willresolve, suggesting strongly that inflationwill decline into 2022 without rate hikes.The debate for the bond markets is notwhether inflation will decline, but rather toOn the other hand, the Federal Reserve willreduce its own purchases of intermediateto long-term bonds as it tapers to zeromonthly buying by June, or perhaps earlier.We anticipate “private sector supply” ofTreasuries (that is, issuance minus Fed buys)will decline through the first half of the yearand turn net positive during the summer. JANNEY MONTGOMERY SCOTT LLC MEMBER: NYSE, FINRA, SIPC JANNEY OUTLOOK 2022 REF: 503552-1221 PAGE 9 OF 12
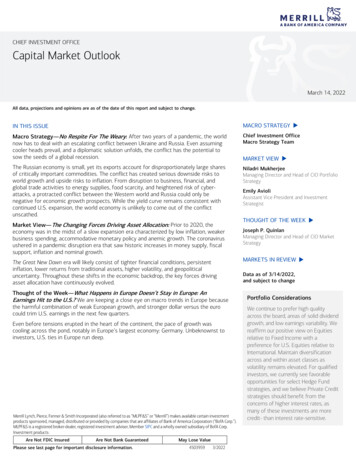
The X factor in the supply/demand equation is pensions,which are relatively price-insensitive allocators to bonds.Strength in the financial markets in 2020-2021 has leftmany pensions overfunded, or if not overfunded, in a muchbetter position for the first time in more than a decade. Inaggregate, these pensions will be buyers of long-durationfixed income as they take advantage of higher fundingratios by increasing bond allocations and derisking theirportfolios. Even accounting for pension demand, however,the price-sensitive private sector could be forced to absorb 250 billion to 300 billion of supply in the final half of theyear, which has the potential, absent other factors, to pushlong-term interest rates higher by 0.2-0.6%.Chart 14: High-Grade Bond Supply Likely Picks Up into 2H 2022CORPORATE CREDITAlthough we are anticipating somewhat higher rates andnegative total returns on much of the Treasury, our readof the evidence suggests that corporate credit, includingboth investment-grade and high-yield, should outperformTreasuries. In other words, while spreads—a measure ofincremental income from risk taking—are in their lowesthistorical quintile, we anticipate they will narrow somewhatfurther. It is likely that by the time the current credit cycleis complete in several years, both investment-grade andhigh-yield spreads will have made fresh all-time lows.Chart 16: Net leverage of S&P 500 companies is at an all-time low5.5x5.0x4.5xEst. Net TsyIssuance(2yrs )Est. Net USIG IssuanceEst. FedBuysNet Supply1Q 2022 438 195 (220) 413bln2Q 2022 406 180 (80) 506bln2.0x3Q 2022 382 160- 542bln1.0x4Q 2022 375 150- 20132015201720192021(Source: Janney ISG, Bloomberg)(Source: Janney ISG, US Treasury Department, Federal Reserve Board)Fixed-income professionals have long separated nominalinterest rates into two components: i nflation expectations, which are a feature mainly ofeconomic trends, and r eal interest rates, which are a feature of the supply/demand balance and monetary policy.There are feedback effects between the two, but weanticipate the combination of the two will push longer-terminterest rates modestly higher in 2022, to wit: our yearend target for 10-year Treasury yields is 2.10%, although itwill not be a straight line. In contrast, we expect short-terminterest rates to rise more consistently as time passes towhat will likely be a relatively gradual, but consistent, Fedtightening cycle in late 2022 and several years after. Ourbase-case forecasts portend a slightly negative total returnfor 7-year and longer Treasuries and, it is worth noting,more significant negative returns for Treasury InflationProtected Securities (TIPS).Chart 15: Janney ISG Interest Rate 1.39%1.71%0.79%0.56%4Q 20210.60%1.20%1.50%1.85%0.90%0.65%1Q 20220.65%1.35%1.85%2.25%1.20%0.90%2Q 20220.80%1.40%1.75%2.20%0.95%0.80%3Q 20220.95%1.55%1.90%2.30%0.95%0.75%4Q 20221.10%1.70%2.10%2.45%1.00%0.75%(Source: Janney ISG, Bloomberg)4.0xThe best optimistic case for credit performance comes fromfundamentals. Both market and internal liquidity are strong,as evidenced by bond markets eager to finance new debtissuance and Federal Reserve data on corporate moneymarket fund holdings. Balance sheet leverage is, meanwhile,very low, especially for relatively early in a credit cycle.Using S&P 500 companies as a sample, the U.S. corporatemarkets’ net debt-to-EBITDA ratio (essentially how muchcash-flow generation is available to pay off debt) is at thelowest point in history. This metric suffers from distributionproblems—a few large companies with lots of cash flowskew it somewhat—but as a broad indicator, it is impressivelystrong. Finally, revenue and profit expectations are high, withoperating margins for S&P 500 companies at the highest inhistory, signaling income and cash-flow generation shouldcontinue to support debt easily.Chart 17: Credit spreads have been in the bottom decile throughmost of 2021109InvestmentGrade8High Y
Dec 15, 2021 · Capital Management Mark Luschini serves as Janney’s Chief Investment Strategist and leads the Investment Strategy Group, which sets the firm’s view on macroeconomics, as well as the equity and fixed income markets. In addition, Mark is the President and Chief Investment Officer of Jann