Transcription
Original article 7A microarray minisequencing system for pharmacogeneticprofiling of antihypertensive drug responseUlrika Liljedahla , Julia Karlssona , Håkan Melhusa , Lisa Kurlanda ,Marie Linderssona , Thomas Kahanc , Fredrik Nyströmd , Lars Linda,b andAnn-Christine SyvänenaWe aimed to develop a microarray genotyping system formultiplex analysis of a panel of single nucleotidepolymorphisms (SNPs) in genes encoding proteinsinvolved in blood pressure regulation, and to apply thissystem in a pilot study demonstrating its feasibility in thepharmacogenetics of hypertension. A panel of 74 SNPs in25 genes involved in blood pressure regulation wasselected from the SNP databases, and genotyped in DNAsamples of 97 hypertensive patients. The patients hadbeen randomized to double-blind treatment with either theangiotensin II type 1 receptor blocker irbesartan or theâ1 -adrenergic receptor blocker atenolol. Genotyping wasperformed using a microarray based DNA polymeraseassisted ‘minisequencing’ single nucleotide primerextension assay with fluorescence detection. The observedgenotypes were related to the blood pressure reductionusing stepwise multiple regression analysis. The allelefrequencies of the selected SNPs were determined in theSwedish population. The established microarray-basedgenotyping system was validated and allowed unequivocalmultiplex genotyping of the panel of 74 SNPs in everypatient. Almost 7200 SNP genotypes were generated in theIntroductionThe most abundant form of genetic variation are thesingle nucleotide polymorphisms (SNPs) that occur onthe average at one out of every thousand bases in thehuman genome [1,2]. As a result of the efforts of theSNP consortium, which comprises a collaboration between 14 major pharmaceutical companies, and theHuman Genome Project [1], there are over four millionSNPs in public databases. Depending on where in thegenome a SNP occurs, it may have different consequences on the phenotypic level. SNPs in the codingregions of genes may alter the function or the structureof the encoded proteins. While most of the SNPs arelocated in non-coding regions of the genome and haveno direct known impact on the phenotype of anindividual, they are useful as genetic markers becausethey may be inherited linked to the functional variantsof physically closely located genes.Hypertension is a quantitative trait caused by multiplefactors that interact through pathways involving cardiacstudy. Profiles of four or five SNP-genotypes that may beuseful as predictors of blood pressure reduction afterantihypertensive treatment were identified. Our resultshighlight the potential of microarray-based technology forSNP genotyping in pharmacogenetics. Pharmacogenetics13:7–17 & 2003 Lippincott Williams & WilkinsPharmacogenetics 2003, 13:7–17Keywords: minisequencing, pharmacogenetics, systolic blood pressure,diastolic blood pressure, haplotype, single nucleotide polymorphism,genotyping, microarraysaDepartment of Medical Sciences, Uppsala University, Uppsala, b Astra ZenecaR&D, Mölndal, c Division of Internal Medicine, Karolinska Institute, DanderydHospital, Stockholm and d Department of Medicosurgical Gastroenterology,Endocrinology and Metabolism, University Hospital of Linköping, Linköping,Sweden.Correspondence to Ann-Christine Syvänen, Department of Medical Sciences,Molecular Medicine, Uppsala University Hospital, Entrance 70, Third Floor,Research Department 2, S-751 85 Uppsala, Sweden.Tel: 46 18 611 29 59; fax: 46 18 611 25 19;e-mail: ann-christine.syvanen@medsci.uu.seReceived 1 July 2002Accepted 24 October 2002function, blood volume, salt regulation, peripheralvascular tone and endothelial function [3]. Many of thecomponents of the blood pressure regulating pathwaysare proteins that vary in structure and activity amongindividuals owing to SNPs in the genes encoding them.Twin studies show that heritable components explainapproximately one-half of the variance in blood pressure [4,5]. Because genetic factors contribute to hypertension, there is good reason to hypothesize thatgenetic factors also contribute to individual responsesto treatment with antihypertensive drugs. A large interindividual variation in the response to antihypertensivetreatment is well documented [6,7]. Despite attemptsto use biochemical indicators, such as plasma reninactivity, or metabolic characteristics as predictors ofindividual drug response, no such predictor has yetbeen identified to be of clinical importance [8,9].We have recently found that the insertion/deletionpolymorphism in the angiotensin-converting enzyme(ACE) gene predicted the reduction in blood pressure0960-314X & 2003 Lippincott Williams & WilkinsCopyright Lippincott Williams & Wilkins. Unauthorized reproduction of this article is prohibited.
8 Pharmacogenetics 2003, Vol 13 No 1in hypertensive patients treated with an angiotensin IItype 1 (AT1 )-receptor blocker, but not in patientstreated with a 1 -adrenergic receptor ( 1 -AR) blocker[10]. A SNP in the aldosterone synthase gene(CYP11B2 344 T/C) has also been found to bepredictive of the systolic blood pressure reduction inhypertensive patients treated with irbesartan [11].These studies suggest that pharmacogenetic analysescould be used as tools to achieve the optimal therapy.The unimodal frequency distribution of the response totreatment with antihypertensive drugs on the population level shows that many factors are involved [7]. Inthis study, we hypothesized that a combination of SNPsin genes known to be involved in blood pressureregulation would be powerful for predicting individualresponses to antihypertensive drug treatment.To facilitate simultaneous analysis of multiple SNPs inblood pressure-related genes, we developed a microarray-based genotyping system that utilizes ‘minisequencing’ single nucleotide primer extension [12]. Thisreaction principle has been adapted to a variety of assayformats [13], and allows specific genotyping of mostSNPs at the same reaction conditions, which is aparticularly advantageous feature for multiplex genotyping in the microarray format. In our system, theprimers are immobilized covalently on microscopeslides in an ‘array of arrays’ format [14] that allowsgenotyping of a panel of SNPs in multiple samples oneach slide. We applied the microarray-based minisequencing system to genotype a panel of 74 SNPs inblood pressure regulating candidate genes in DNAsamples from hypertensive patients who had beentreated with either of two antihypertensive drugs withdifferent mechanisms of action.Materials and methodsStudy populations and blood samplesDNA samples from 97 hypertensive patients from thedouble-blind parallel group ‘Swedish Irbesartan LeftVentricular Hypertrophy Investigation versus Atenolol’(SILVHIA) trial [15] were analysed. The patients wererandomized to treatment with either an AT1 -receptorblocker (irbesartan) or a 1 -AR blocker (atenolol). Theresults presented in this study are reported after3 months of monotherapy. In 66% of the subjectsreceiving irbesartan and 39% of the subjects receivingatenolol, the dose was doubled after 6 weeks of treatment. However, neither for irbesartan nor for atenololwere the doses significantly related to the change inblood pressure (data not shown). The reduction inseated systolic blood pressure (SBP) and diastolic bloodpressure (DBP) was recorded in a strictly standardizedmanner, as previously described in detail [10,15]. Thetwo treatment groups showed a similar reduction inSBP and DBP. Table 1 presents the basic characteristics of the patients.Table 1.Basic characteristics of the hypertensive patientsNumber of patientsAge (years)Gender (proportionfemales)Height (m)Weight (kg)Pretreatment SBP (mmHg)Pretreatment DBP (mmHg)Change in SBP at12 weeks (%)Change in DBP at12 weeks (%)Irbesartan group Atenolol group P4854 837%4954 831%0.940.361.74 0.0983 15164 18104 79.9 111.73 0.0982 14160 20103 86.8 9.30.610.730.400.430.139.6 9.711 7.00.34 Data are mean SD.The study was approved by the ethics committee ofthe Medical Faculty of Uppsala University (DNr 01–378).A pooled sample consisting of equal amounts of DNAfrom 150 healthy Swedish blood donors was analysed tovalidate the SNPs and to determine the populationfrequencies of the SNP alleles. DNA was extractedfrom the blood samples using QiAamp DNA BloodMini Kit (Qiagen, Hilden, Germany) or the WizardGenomic DNA Purification Kit (Promega, Madison,Wisconsin, USA).SNPs and primersNinety-eight SNPs in candidate genes were identifiedfrom the literature and the dbSNP (www.ncbi.nlm.nih.gov/SNP) and TSC (The SNP consortium, http://snp.cshl.org/) databases. They are described in greaterdetail in Table 2. The polymerase chain reaction(PCR) primers were designed using the Primer AnalysisSoftware Oligo, version 6.15 (Molecular Biology Insights Inc, Cascade, Colorado, USA) to have similar Tmvalues, two or three A- and/or C-residues at their 39ends and universal primer sequences at their 59-ends.The primers were synthesized by Interactiva Biotechnologie GmbH (Ulm, Germany) or by Sigma-Genosys(Cambridge, UK). The sequences of the primers areavailable from the authors upon request.PCRPCR primers for 49 fragments comprising 74 SNPswere combined into eight multiplex PCR reactionscontaining two to 10 primer pairs, generating PCRproducts of different sizes. The fragments were amplified using a touchdown PCR-program [16] in a ThermalCycler PTC-225 (MJ Research, Watertown, Massachusetts, USA). The PCR reactions were performed with50 ng of DNA, 4 U of AmpliTaq Gold DNA polymerase (N808–0245, Applied Biosystems, Foster City,California, USA), 3.5 mmol/l MgCl2 , 0.2 mmol/l dNTPs,0.2–0.5 mol/l primer and 5% dimethylsulphoxide inCopyright Lippincott Williams & Wilkins. Unauthorized reproduction of this article is prohibited.
Minisequencing for pharmacogenetic profiling Liljedahl et al. 9Table 2.Description of the single nucleotide polymorphisms analysedGene name and sterone synthaseCYP11B2Angiotensin converting enzymeACEAngiotensinogenAGTAngiotensin II type 1 receptorAGTR1Angiotensin II type 2 receptorAGTR2Mineralocorticoid receptorMLRReninRENAdrenergic systemAdrenergic Æ1a receptorADRA1aAdrenergic Æ1b receptorADRA1bAdrenergic Æ2 receptorADRA2AAdrenergic 1 receptorADRB1Adrenergic 2 receptorADRB2Adrenergic 3 receptorADRB3Endothelial systemEndothelin receptor type AEDNRAEndothelin receptor type BEDNRBEndothelial nitric oxide synthaseENOSLipid metabolismApolipoprotein AAPOAApolipoprotein BAPOBApolipoprotein EAPOECholesteryl ester transfer proteinCETPAccessionnumberaSNP nameb,cdbSNP 801CYP11B2 T267C (344T/C)CYP11B2 A3323GACE C10514TACE T10527CACE A10578GACE G12257AACE G14480CACE C14488AACE A14521GAGT C1015T (T174M)AGT T1198C (M235T)AGT A1237GAGT A1204C (A-20C)AGT G1218A (G–6A)AGTR1 A49954GAGTR1 A50058C (A1166C)AGTR1 T4955AAGTR1 T5052GAGTR1 C5245TAGTR2 G1675AAGTR2 G4297TAGTR2 A4303G(AGTR2 T3786C)MLR M26900–M26440–M26900L00073REN T1456GREN A1442GREN G134AREN T164GREN A279C (A204C)(REN C170T)rs5707rs5706NANArs5705NAThr/ThrArg/TermNM 000680ADRA1a T1441CNAArg/CysNM 000679(ADRA1b �––X72861–ADRA2A C787GADRA2A G1817AADRA2A G278TADRB1 C1165GADRB1 A145GADRB2 T1217CADRB2 T1244CADRB2 G1309A (G46A)ADRB2 G1342C (G79C)(ADRB2 T1754C (Ile164))ADRB3 T827CADRB3 94rs4999D11149–D13165EDNRA T89CEDNRA G125AEDNRB F032908D26607–––eNOS G7002TeNOS A2000TeNOS G9767AeNOS A498GeNOS G20455TeNOS 9rs1800781Asp/GluJ02758APOA ��M32997–APOB G10108AAPOB C711TAPOE T3932C (T112C)APOE C4070T (C158T)CETP A128CCETP C146ACETP C147ACETP A1300GCETP ino opyright Lippincott Williams & Wilkins. Unauthorized reproduction of this article is prohibited.
10 Pharmacogenetics 2003, Vol 13 No 1Table 2.(continued)Gene nameand acronymLow density lipoprotein receptorLDLRLipase hepaticLIPCLipoprotein lipaseLPLOtherCalcium sensing receptorCASREndothelin 2ET2Glucocorticoid receptorGRLLecithin-cholesterol acyltransferaseLCATNeuropeptide YNPYOsteoprotegerinOPGParathyroid hormonePTHPeroxisome proliferator activatedreceptor ÆPPARAPeroxisome proliferator activatedreceptor gammaPPARGSuperoxide dismutaseSODVitamin D receptorVDRAccessionnumberaSNP nameb,cdbSNP IDdAmino 3895––AF050163–––CETP G338ACETP G571ACETP A311G(CETP G2132T)(CETP T1511G)LDLR C16730TLDLR T20001CLIPC G89ALIPC A110G(LIPC C873T)(LIPC A1075C)(LIPC C1221T)LPL C9040GLPL G7315CLPL A7344GLPL R C3031GCASR G2956T(CASR G2968A)(ET2 T461C)(ET2 G577A)(GRL (LCAT G2233A)NAArg/HisK01911(NPY 1(OPG T950C)(OPG C1217T)(OPG G1181C)(PTH T164C)(PTH T179C)PPARA /ArgSer/ProVal/AlaL40904–PPARG G1043APPARG (SOD C386T)(SOD C2734T)(SOD C5775G)(VDR raAccession number of GenBank entry. b SNP name composed of acronym, nucleotide variation and nucleotide position.Alternative SNP name in parentheses. c SNPs marked with parentheses were excluded from genotyping panel. d dbSNP IDnumber; NA, not available.100 l of PCR reaction buffer supplied with the enzyme. The multiplex PCR reactions had been optimized with respect to MgCl2 , enzyme and primerconcentrations. The success of the PCR was evaluatedon 8% polyacrylamide gels.Preparation of microarraysThe minisequencing primers were covalently immobilized on CodeLinkTM Activated slides (previously 3DLink slides, Motorola, Northbrook, Illinois, USA) bymediation of a 59-NH2 group [17]. The NH2 -modifiedprimers were applied to the slides at a 25 mol/lconcentration in 400 mmol/l sodium bicarbonate buffer,pH 9.0, by contact printing using a ProSys 5510Aspotter (Cartesian Technologies Inc., Irvine, California,USA) equipped with four Stealth Micro Spotting Pins(SMP3; TeleChem International Inc., Sunnyvale, Cali-fornia, USA) resulting in spots with a diameter of160 m. The oligonucleotides were printed in duplicatespots with a centre-to-centre distance of 200 m in an‘array of arrays’ format with the same spacing as thewells of a 384-well microtitre plate [14] with fourcolumns and 14 rows on each slide. A fluorescentlylabelled oligonucleotide was included as control for theimmobilization process and for scanning of the arrays.Microarray minisequencing reactionsThe multiplex PCR products from each sample werecombined, precipitated with ethanol and the DNApellet was resuspended in 46 l of water. After denaturation of the DNA at 95 8C for 2 min, 14 l of abuffer containing 4.5 mmol/l NaCl, 50 mmol/l TrisHCl, pH 8.0, 5 mmol/l Na2 -EDTA was added, and15 l of the DNA solution was used in four parallelCopyright Lippincott Williams & Wilkins. Unauthorized reproduction of this article is prohibited.
Minisequencing for pharmacogenetic profiling Liljedahl et al. 11reaction wells on the slides. A custom made siliconrubber grid placed on top of each microscope slide wasused to form 56 separate reaction chambers [14]. Aheated aluminium block holding three microscopeslides was used for the reactions. After incubation for40 min at 37 8C, the slides were briefly rinsed in asolution containing 5 mmol/l Tris-HCl pH 8.0, 0.5mmol/l Na2 -EDTA, 100 mmol/l NaCl, 0.1% Triton X100 followed by rinsing with water. The minisequencing reaction mixtures contained one of the fourTAMRA-labelled ddNTPs (ddATP NEL474, ddCTPNEL473, ddGTP NEL475 or ddUTP NEL472 PerkinElmer Life Sciences, Boston, Massachusetts, USA) andthe other three ddNTPs unlabelled at a concentrationof 0.5 mol, 0.75 U of DynaSeq DNA polymerase (giftfrom Finnzymes OY, Helsinki, Finland) or ThermoSequenase DNA Polymerase (Amersham Biosciences,Uppsala, Sweden) in 26 mmol/l Tris-HCl pH 9.5,6.5 mmol/l MgCl2 , 0.1% Triton X-100. Fifteen l ofreaction mixture was added to the reaction wells on theslides preheated to 55 8C, followed by incubation for15 min. The slides were then briefly rinsed in waterfollowed by washing for 2 min with 50 mmol/l NaOH,and twice for 5 min with 3 mmol/l sodium citrate,30 mmol/l NaCl, 0.1% SDS, pH 7.0 at 65 8C and finallybriefly rinsed with water. The slides were allowed todry at room temperature before fluorescence scanning.Fluorescence scanning and data interpretationThe fluorescence signals were detected using an arrayscanner (ScanArray 5000, Perkin-Elmer Life Sciences,Boston, Massachusetts, USA). The fluorescence intensity values were extracted with the QuantArray software supplied with the scanner. Using an algorithm,the mean values of the signals from the duplicate spotswere corrected for the average background measuredbeneath each ‘subarray’. The ratio between the fluorescence signal from one of the alleles and the sum of thefluorescence signals from both possible alleles at eachSNP site was calculated to assign the genotypes.Minisequencing in microtitre platesSolid-phase minisequencing in microtitre plates with3H-labelled dNTPs was used to determine the allelefrequencies of the SNPs in pooled DNA samplesessentially as described previously [12,18], with theexception that a biotin residue for immobilization ofthe PCR products in the streptavidin-coated microtitrewell was incorporated in a secondary PCR reaction witha biotinylated primer complementary to the universalsequence on the specific PCR primer. The ratio between the 3 H-dNTPs incorporated was normalizedagainst the ratio in a heterozygous sample. If noheterozygous reference sample was available, the specific activities of the tritium labelled nucleotides (3 HdATP TRK633 69 Ci/mmol, 3 H-dCTP TRK625 46 Ci/mmol, 3 H-dGTP TRK627 41 Ci/mmol, 3 H-dTTPTRK576 124 Ci/mmol, Amersham Biosciences) wereused for normalization. Solid-phase minisequencingalso served as reference method [12].Statistical analysisFor the SNPs with a frequency over 5% for the minorallele, Hardy–Weinberg equilibrium was assessed bycomparison of the observed and expected genotypefrequencies using the chi-square test with one degreeof freedom. The Genepop web program (http://wbiomed.curtin.edu.au/genepop) [19] was used to calculatepairwise linkage disequilibrium (LD). Haplotypes weredesignated using the expectation maximization algorithm in the Haplo program (http://info.med.yale.edu/genetics/kkidd) [20]. Subsets of SNPs required fordistinguishing between haplotypes [21] were identifiedby visual inspection of the haplotypes.The relationship between genotypes and change inblood pressure was first analysed using factorial oneway ANOVA (Statview 5, SAS Institute Inc., Cary,North Carolina, USA) to evaluate which of the genotypes of the 74 SNPs were related to the changes inSBP or DBP in the irbesartan and atenolol groupseparately. Four univariate analyses were performed foreach of the individual SNPs. SNPs demonstrating aP , 0.10 were entered as independent variables inforward stepwise multiple regression models with oneof the four possible combinations of SBP/DBP andirbesartan/atenolol as a dependent variable. In thesemodels, P , 0.01 was set for retention of the independent variables in the models in order to reduce theeffect of multiple testing by reducing the P-valueaccepted. Two-tailed significance levels were used. Noformal correction for multiple testing was applied.ResultsThe candidate genes were chosen based on their function in the renin–angiotensin–aldosterone, adrenergicand endothelial systems, and the lipid metabolism,respectively. A panel of 98 genetic variants in thesegenes was assembled for prediction of individual responses to treatment with antihypertensive drugs(Table 2). This panel comprised a small number ofSNPs that had been shown or suggested to be involvedin blood pressure regulation in the published literature.Most of the SNPs in the panel were located in codingor regulatory regions of the candidate genes, but also afew SNPs in non-coding regions close to the genes(, 1.5 kb) were included. When possible, SNPs withpublished allele frequencies from 10% to 90% wereselected. The allele frequencies in the Swedish population of the initially selected SNPs were determinedby quantitative minisequencing analysis [12,18] of apooled sample containing DNA from 150 healthyindividuals of Swedish origin. Based on this analysis, 24SNPs were excluded from the panel for SNP profilingCopyright Lippincott Williams & Wilkins. Unauthorized reproduction of this article is prohibited.
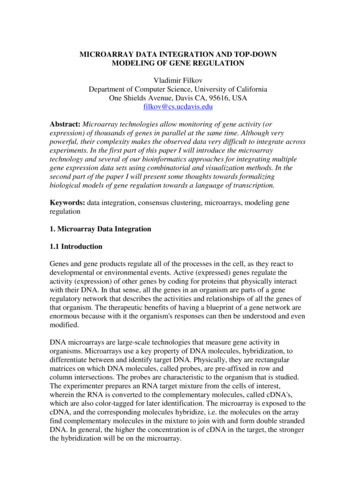
12 Pharmacogenetics 2003, Vol 13 No 1because they had a minor allele frequency of less than1% in the Swedish population (16 SNPs) or due toPCR failure (8 SNPs). Over one-half of the SNPs,especially those with even allele distribution, hadsimilar frequencies in Sweden as in the populationwhere they had been identified (Table 3). Seventy-fourSNPs with allele frequencies ranging from 1% to 50%for their minor allele were included in the panel togenotype the DNA samples from hypertensive patients.Figure 1 presents a fluorescence scan image of amicroarray where the SNPs included in the panel havebeen genotyped by minisequencing in samples from 12of the patients. After fluorescence scanning of thearrays, the results are interpreted with the aid of analgorithm that extracts the signals from the microarray,and assigns the genotypes according to the ratio of thefluorescence signal from one of the alleles to the sumof the fluorescence signals from both alleles at eachSNP site. As shown in Fig. 2, the signal ratios for eachSNP fall within one of three distinct, non-overlappingclusters that define the three possible genotypes unequivocally. Although the limits for the clusters ofratios vary depending on the sequence context of theSNPs, the ratios defining the genotype of the SNPsdiffer from each other on average by 0.32.Using the microarray-based system, the panel of SNPswas genotyped in DNA samples from the 97 hypertensive patients participating in the study. As a consequence of the stringent criteria applied for definingthe genotypes, approximately 20% of the genotypeswere assigned after repeating the microarray-basedanalysis with a primer of the opposite polarity, or byverification of individual genotypes in the microtitreplate format of the minisequencing method. As a resultof this strategy, a genotype was assigned for each SNPin every patient, and thus almost 7200 genotypes weregenerated. The genotypes of four SNPs (CYP11B2T267C, AGTR1 A50058C, ADRB1 A145G, ADRB2T1217C) were also determined individually by thereference method in all of the study samples. Inaddition, 200 randomly selected genotypes (8%) wereredetermined by the reference method. Fully concordant genotyping results were obtained by the individualanalysis and by the multiplex microarray-based genotyping, evidencing for the accuracy of the microarraysystem. The assigned genotypes conformed to Hardy–Weinberg expectations with the exception of the threeSNPs in the AT2 receptor gene, the C1165G SNP inthe 1 -adrenergic receptor gene and the G134A SNP inthe renin gene (P , 0.001).The allele frequencies for the panel of SNPs calculatedfrom the individual patient samples are shown in Table3. With the exception of the SNPs REN G134A,Allele frequency of the single nucleotide polymorphismsincluded in the panelTable 3.Allele frequencySNPLiteratureaSwedenStudy subjectsNANA65/35 6/3485/1580/20 ��angiotensin–aldosteronesystemCYP11B2 T267C57/43ACE C10514T59/41ACE T10527C86/14ACE A10578G86/14ACE G12257A41/59ACE G14480C59/41ACE C14488A41/59ACE A14521G59/41AGT C1015T88/12AGT T1198C59/41AGT A1237GNAAGT A1204C90/10AGT G1218A30/70AGTR1 A49954G75/25 AGTR1 A50058C50/50 AGTR1 T4955A82/18AGTR1 T5052G83/17AGTR1 C5245T64/36AGTR2 G1675A56/44AGTR2 G4297T60/40AGTR2 A4303G30/70MLR C1825TNAREN T1456G55/45 REN A1442G95/5 REN G134AREN T164GREN A279CAdrenergic systemADRA1A T1441CADRA2A C787GADRA2A G1817AADRA2A G278TADRB1 C1165GADRB1 A145GADRB2 T1217CADRB2 T1244CADRB2 G1309AADRB2 G1342CADRB3 T827CADRB3 C3246TEndothelial systemEDNRA T89CEDNRA G125AEDNRB G40AENOS G7002TENOS A2000TENOS G9767AENOS A498GENOS G20455TENOS G2996ALipid metabolismAPOA A1449GAPOB G10108AAPOB C711TAPOE T3932CAPOE C4070TCETP A128CCETP C146ACETP C147ACETP A1300GCETP G1335ACETP G338ACETP G571ACETP A311GLDLR C16730TLDLR T20001CLIPC G89ALIPC ht Lippincott Williams & Wilkins. Unauthorized reproduction of this article is prohibited.
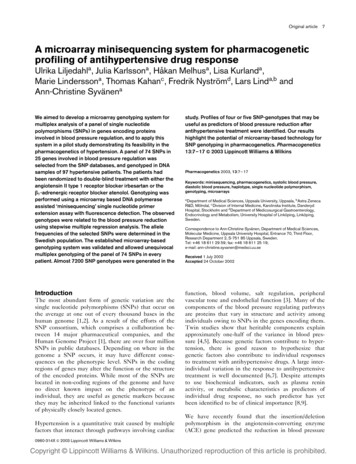
Minisequencing for pharmacogenetic profiling Liljedahl et al. 13Table 3.(continued)Allele frequencySNPLPL C9040GLPL G7315CLPL A7344GLPL G7360AOtherCASR C3031GCASR G2956TPPARA T39067CPPARG G1043APPARG C1575TLiteratureaSwedenStudy 93/790/10100/0100/0100/0aAllele frequency in a European population except for a few from Zimbabwemarked with an asterisk. NA, frequency not available. b Deviation from Hardy–Weinberg equilibrium, P , 0.001.gene is in complete LD with the ACE I/D polymorphism, which was shown to predict the reduction in bloodpressure in the same patients treated with irbesartan inour previous study [10]. In both treatment groups, theSNPs in the endothelin type B receptor (G40A) andthe endothelial nitric oxide synthase (eNOS) (A498G)genes were predictors of SBP reduction. Of the SNPsin genes encoding components of lipid metabolism, thesame SNP in the apolipoprotein A gene (A1449G)emerged as predictor of both SBP and DBP response toirbesartan. The SNP in the hepatic lipase gene(A110G) showed opposite effects on DBP response inthe irbesartan and atenolol groups. In both treatmentgroups, the combined SNP genotype profiles explain asmuch as 44% to 56% of the reduction in SBP and DBP.DiscussionADRB1 C1165G, ADRB2 G1342C and LPL G7360A,the allele frequencies identified in the hypertensivepatients were identical to those in the pooled samplerepresenting healthy blood donors.The most probable haplotypes were determined usingthe expectation maximization algorithm based on thegenotypes of the SNPs in eight of the candidate genes(Fig. 3). This analysis revealed that the allelic diversityof these genes is explained by three to six majorhaplotypes with a frequency of more than 5%. Thisanalysis also shows that only two or three SNPs pergene define the haplotypes in 73% to 95% of theindividuals analysed.Of the 97 individuals with hypertension included in thestudy, one-half had been treated with atenolol and halfwith irbesartan. There was no difference in the basiccharacteristics between the two treatment groups, andboth groups showed a similar reduction in SBP andDBP at three months of treatment (Table 1). Becausethe reduction in blood pressure was unrelated to thedoses of the two drugs, the doses were not evaluated asconfounders in the statistical analysis. Those SNPs thatwere related to a change in blood pressure by univariateanalysis were subjected to stepwise multiple regressionanalyses relating the genotypes of the SNPs to changesin blood pressure. This analysis revealed profiles of fouror five SNPs that appeared as significant predictors ofthe reduction in SBP and DBP (Table 4).According to the calculation of pairwise linkage disequilibrium by the Genepop program, the two SNPs inthe adrenergic receptor Æ2 in the group treated withatenolol, as well as the two SNPs in the ADRB2-genethat predicted both the SBP and DBP responses, are inLD, respectively. In the irbesartan-treated group, SNPsin the genes encoding angiotensinogen, ACE and aldosterone synthase were significant predictors of bloodpressure reduction. The SNP G12257A in the ACEIn this study, we have established a robust microarraybased minisequencing system for genotyping a panel of74 SNPs in 25 genes encoding proteins that potentiallydetermine the pharmacodynamics of individual responses to antihypertensive treatment. The systemproved to be robust and allowed accurate genotyping ofall SNPs in every sample. Using this genotypingsystem, we were able to identify combinations of a fewSNPs that predicted approximately 50% of the variationin the individual drug responses in two groups ofhypertensive patients that had been subjected to monotherapy with one of two different antihypertensivedrugs, a 1 -AR blocker or an AT1 -receptor blocker. Thenumber of s
aDepartment of Medical Sciences, Uppsala University, Uppsala, bAstra Zeneca R&D, . SNPs in the coding regions of genes may alter the function or the structure of the encoded proteins. While most of the SNPs are . Endothelial nitric oxide synthase D26607 eNOS G7002T rs1799983 Asp/Glu ENOS AF032908 eNOS A2000T rs1800783