Transcription
REUTERS/RICK WILKINGThomson Reuters2015 Top 100Global InnovatorsHonoring the World Leadersin InnovationFINDINGS AND METHODOLOGYFeaturing a special supplement on the Top Bay Area InnovatorsNOVEMBER 2015
ES/UERUTREGerman Chancellor Angela MerkelG8 World Economic Summit 2007CSLEI MAR ELINO“Innovation is thekey to growth andprosperity. Measuresto effectively protectintellectual propertyrights are particularlyvital.”
THOMSON REUTERSTOP 100 GLOBAL INNOVATORSTable of ContentsMessage from David Brown. 3Methodology. 4Economic Impact & Findings. 5Thomson Reuters 2015 Top 100 Global Innovators. . . 7Geographic Breakout. 10Industry Breakout. 14Top Bay Area Innovators. 22Thomson Reuters 2015 Top Bay Area Innovators. 26Conclusion. 30Who We Are. 31Solutions For Innovation Success. . . 342
TOP 100 GLOBAL INNOVATORSTHOMSON REUTERSMessage from David BrownFounding member of the Top 100 Global InnovatorsInnovation. We hear and read about it every day, yet the word stillholds a certain mystique. With necessity as the mother of invention,there’s no shortage of ideas for doing things better, faster or incompletely new ways, however the leap from idea to reality is long andchallenging. What does it take to be truly innovative and who are theinnovation leaders in our world today?At Thomson Reuters, it is our belief thatpatents are a proxy for innovation andthat innovation is a driver of economicgrowth and success. The ThomsonReuters Top 100 Global Innovatorprogram, now in its fifth year, isevidence of this.Our methodology is scientificallyrooted in patent data and analysis.Looking at metrics involving patentvolume, application-to-grant success,globalization and citation influence,we’ve developed an objective formulathat identifies the companies aroundthe world that are discovering newinventions, protecting them frominfringers and commercializing them.This is what we call the “Lifecycle ofInnovation:” discovery, protection andcommercialization. Our philosophyis that a great idea absent patentprotection and commercialization isnothing more than, a great idea.With intangible assets now comprisingmore than 80 percent of the S&P500 market value1, understanding theeffect of these assets is critical. Proofof the economic impact of intellectualproperty (IP) can be found in statisticslike IP-intensive industries generatingmore than 5 trillion in economicactivity and creating 40 million jobsin the US.2 Similarly, companies withlarger patent portfolios receive up to 12 million more in startup fundingthat semiconductors continue to playa significant role in the advancementof technological trends such asthe Internet of Things and digitaleverything, however it’s also clear thatindustries that were less active in therecent past have increased their volume,bleeding into tangential sectors wheretheir expertise can be applied.Another proof point is that for fiveconsecutive years the Thomson ReutersTop 100 companies have consistentlyoutperformed other indices in termsof revenue and R&D spend. This year,our Top 100 innovators outperform theMSCI World Index in revenue by 6.01percentage points and in employmentby 4.09 percentage points. We alsooutperform the MSCI World Index inmarket-cap-weighted R&D spend by1.86 percentage points. The conclusion:investment in R&D and innovationresults in higher revenue andcompany success.New in 2015 is the addition of aregional top 100 innovator list for theUnited States’ Bay Area, comprisingSan Francisco, California and thesurrounding region. This area is knownas Silicon Valley and is home to some ofthe world’s top technology companies,such as Apple, Google, Intel, Oracle andmany others. We created a Top 100 listto see how the Bay Area compares toinnovators on a global scale. See page23 for the Top Bay Area Innovator listand its similarities and differences to theglobal Top 100 Innovators compilation.The Thomson Reuters 2015 Top 100Global Innovators list starts on page7 of this report. There are somenoteworthy shifts in year-over-yearactivity. For instance, the Semiconductorand Computer Hardware spaces eachdecreased significantly over last year,whereas the Oil & Gas space increased300 percentage points, Chemicalsincreased two-fold and Pharmaceuticalsjumped up 75 percent. There’s no doubtOcean TomoIntellectual Property & the U.S. Economy: Industries in Focus, 20123 “Patents as Quality Signals for Entrepreneurial Ventures,” Academy of Management Journal, 20084Global Intellectual Property Center, U.S. Chamber of Commerce123than those without3. And, the wages ofemployees in R&D-intensive industriesare at least 30 percent higher thanthose in non-R&D industries4. Wealso found that the higher a country’sGDP, the larger its investment in R&D,innovation, patenting and generallythe better its IPR (intellectual propertyrights) protection.Congratulations to all of theorganizations making the 2015 Top 100lists. Their commitment to innovationand dedication to ongoing R&D aredrivers of economic success, not only forthem but also for the countries in whichthey reside.David BrownSenior Vice President,Thomson Reuters IP & ScienceFounding member of theTop 100 Global Innovator team
THOMSON REUTERSTOP 100 GLOBAL INNOVATORSMethodologyThe Thomson Reuters Top 100 Global Innovator methodology analyzes patentand citation data across four main criteria: volume, success, globalization andinfluence using Thomson Reuters solutions including Derwent World PatentsIndex (DWPI), Thomson Innovation and Derwent Patent Citations Index (PCI).VolumeVolume is the first criteria. Anorganization must have at least100 unique inventions protectedby a granted patent over the mostrecent five year period to advance forfurther analysis. A unique invention isdefined as one instance of a publishedapplication or granted patent for anidea for which protection is sought. InDWPI, these are called “basic” patents.DWPI provides access to 50 patentissuing authorities. Subsequent filingsfor the same invention are recorded asequivalents and collated into patentfamilies which, for this analysis, werenot included.Once an organization passes thevolume stage gate, it is measuredacross the next three criteria: success,globalization and influence.SuccessThe success metric covers the ratioof inventions described in publishedapplications (those patents which arefiled and publicly published by thepatent office but not yet granted) toinventions protected with grantedpatents over the most recent fiveyears. Not all patent applications passthrough the examination process andare granted.GlobalizationGlobalization has to do with the valuean organization places on an inventionby protecting it across the major worldmarkets. The premise being thatinventions protected in all four of theThomson Reuters Quadrilateral PatentIndex authorities: the Chinese PatentOffice, the European Patent Office, theJapanese Patent Office and the UnitedStates Patent & Trademark Office, aredeemed to be of significant value tothe organization. A ratio is created ofthe inventions protected across theQuadrilateral Patent Index authoritiesversus the total volume for that period.InfluenceFinally, influence is the downstreamimpact of an invention, measuredby how often it is cited by otherorganizations. Via the DerwentPatent Citation Index, citations toan organization’s patents are countedover the most recent five years,excluding self citations.Scores for each of these areas are talliedand combined to produce the Top 100Global Innovator list.4
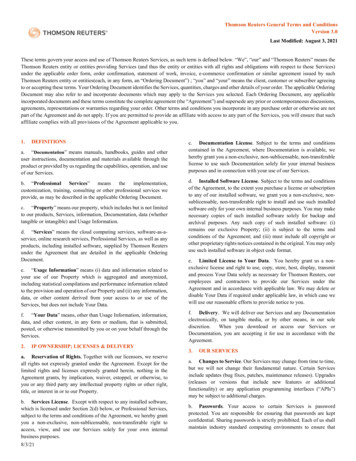
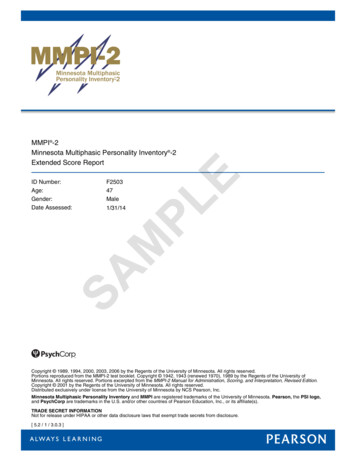
TOP 100 GLOBAL INNOVATORSTHOMSON REUTERSEconomic Impact & FindingsThe 2015 Thomson Reuters Top 100 Global Innovators are a creativeand successful group. Together they generated more than 429 trillionin revenue (in local currency) and invested more than 20 trillion in R&D(local currency) in 2014. They are the organizations leading us into the future,by innovating, protecting their inventions with IP rights and commercializingthem. Without them, our world would be a very different place.Proof of the Lifecycle of Innovationconcept embodied in the 2015 Top 100Global Innovators (that the discovery,protection and commercializationof ideas leads to economic success)can be found in the fact that theTop 100 outperform the MSCI WorldIndex on several fronts. They beatMSCI in year-over-year revenue andemployment figures by 6.01 and 4.09percentage points, respectively. Theyalso outperform MSCI in their marketcap weighted R&D spend by 1.86percentage points. These are clearindicators that companies that investin R&D and convert their ideas intoprotected, commercialized productsperform better than those that don’thave such a focus.Patent ReformThere’s been29some influentialintellectual30%property legislation that is shaping howcompanies innovate, where they seekprotection and when. Some of theseinitiatives include the America InventsAct and the Patent Trial & AppealBoard; the European unitary patent andunified patent court; the UK’s Patent Boxlegislation; and impactful court rulings,such as Alice 101 in the US.5Figure 1: Five-Time Top 100 Global Innovator HonoreesJapanUSFranceSouth KoreaSwedenSwitzerlandSource: Thomson Reuters Derwent World Patents Index
THOMSON REUTERSThe landscape is ripe with reform aspatent offices and filers grapple withhow best to implement these changesgiven their goals and needs. Despitethese changes, one thing remainscertain: the patent system is vitalto protecting innovation and to theeconomic wellbeing of organizations,nations and our world. OECD statisticsconfirm that nations with higher GDPshave similarly high patent filing rates(aka strong patent infrastructures),whereas the converse holds equallytrue. One way for developing nationsto propel their economies forwardis to invest in innovation andbuilding a reliable intellectualproperty infrastructure.Repeat Honorees2015 marks the fifth consecutiveyear of the Top 100 Global Innovatorprogram. There have been 40consecutive, repeat honorees over thistime, with Japan providing 15 five-timewinners, the US contributing 14, andfour other countries comprising theremaining 11 spots: France, South Korea,Sweden and Switzerland (see Figure 1).AbsenteesThe United Kingdom is absent fromthe list yet again this year. Innovationincentives introduced in the UK, suchas Patent Box legislation, do not haveenough legacy yet to have had animpact. Additionally, the UK spendsmuch less on R&D as a percentage ofGross Domestic Product (GERD) thanthe Top 100 Global Innovator countriesdo. The UK’s GERD is 1.63 percent,whereas, for example, Japan’s is 3.47percent.5 The region’s underuse of itspatent system and lack of significant5commercialization keep the UK frommaking the list once again.China is also absent from the 2015 list.It joined the innovation-leader ranksin 2014, for the first time, via Huawei,however wasn’t able to replicate thatperformance to join again in 2015.A big factor contributing to China’sshortcoming is the fact that most of itsinnovation is domestic and thereforeis not realized outside of its borders.In fact, only about six percent ofChina’s innovation activity is protected,and commercialized, outside ofChina. In order for China to see moreorganizations join this prestigiousgroup, it will need to think moreinternationally and look to bring itsinventions to market around the world.There are 27 companies that droppedfrom the prior year (see Table 1 on page12), including AT&T, IBM, Siemens andXerox. While these companies arestill innovating at noteworthy levels,their respective scores across all of themetrics did not advance them to the Top100. It’s expected that we will see themagain in the future.Bleeding into Tangential AreasThere is a bleeding of innovation intotangential industries, as companiesexpand their portfolios and apply theirinventions to related technologies orapplications. This is seen across allsectors, and especially in some areaswith notable increases, such as inChemicals, where small molecules arebeing used in new ways as related tocosmetic applications, food chemistry,flavoring, and otherwise.TOP 100 GLOBAL INNOVATORSYOY ChangesOne of the most significant year-overyear changes is in the Semiconductorspace. This category dominated the listin the past, comprising nearly onequarter of the 100 companies.However, there are just 12Semiconductor companies thisyear, a 43 percent drop from last year.This is not to say that Semiconductorshave decreased in importance, butrather that there are new technologiesor methods to make computers andelectronic devices faster, smarter andcapable of more functionality.New in 2015:Top Bay Area InnovatorsFor the first time, Thomson Reutersanalysts studied Silicon Valley, knownas the technology and innovationcorridor in the US, to see whichcompanies are leading there.Following a methodology similar tothat of the Top 100 Global Innovators,except for the Volume criteria, allcompanies headquartered or witha major subsidiary in that regionwere investigated. The Top Bay AreaInnovators list can be found on page19. There are 11 companies that overlapwith the Top 100 Global Innovators;meaning 31 percent of the leadingUS innovators and 11 percent of theworld’s top innovators are locatedin the Bay Area.2013 OECD data6
TOP 100 GLOBAL INNOVATORSTHOMSON REUTERSIntroducing the Thomson Reuters2015 Top 100 Global Innovators7OrganizationCountryIndustryPrevious Winners3M CompanyUSAChemical2011, 2012, 2013, 2014Abbott LaboratoriesUSAPharmaceutical2013, 2014Advanced Micro DevicesUSASemiconductor & Electronic Components2011, 2012, 2013, 2014Air ProductsUSAChemical2013Aisin mmunication & Equipment2011, 2012, 2013, 2014AlstomFranceElectrical PowerAmazonUSAMedia Internet Search & Navigation SystemsAnalog DevicesUSASemiconductor & Electronic Components2011, 2012, 2013AppleUSATelecommunication & Equipment2011, 2012, 2013, 2014ArkemaFranceChemical2011, 2012, 2013, 2014Avago Technologies (previously LSI)USASemiconductor & Electronic Components2011,2012, 2013, 2014BASFGermanyChemical2011, 2014BayerGermanyPharmaceutical2011Becton DickinsonUSAMedical DevicesBlackberryCanadaTelecommunication & EquipmentBoehringer idgestoneJapanAutomotiveBristol-Myers SquibbUSAPharmaceutical2011CanonJapanImaging2011, 2012, 2013, 2014Casio ComputerJapanComputer Hardware2014ChevronUSAOil & Gas2011, 2012, 2013CNRS, The French National Centerfor Scientific ResearchFranceScientific Research2011, 2012, 2013, 2014CEA–The French AlternativeEnergies and Atomic EnergyCommissionFranceScientific Research2011, 2012, 2013, 2014Daikin IndustriesJapanIndustrial2011, 2014Dow Chemical CompanyUSAChemical2011, 2012, 2013, 2014DuPontUSAChemical2011, 2012, 2013, 2014Emerson ElectricUSAElectrical Products2012, 2013, 2014EricssonSwedenTelecommunication & Equipment2011, 2012, 2013, 2014Exxon MobilUSAOil & Gas2011, 2012, 2013FraunhoferGermanyScientific Research2013, 2014Freescale SemiconductorUSASemiconductor & Electronic Components2013, 2014FujifilmJapanImaging2012, 2013, 2014FujitsuJapanComputer Hardware2011, 2012, 2013, 20142013, 20142011, 2012, 2013, 2014
THOMSON REUTERSTOP 100 GLOBAL INNOVATORS2015 Top 100 Global InnovatorsOrganizationCountryIndustryPrevious WinnersFurukawa ElectricJapanElectrical Products2014General ElectricUSAConsumer Products2011, 2012, 2013, 2014Google (now Alphabet Inc.)USAMedia Internet Search & Navigation Systems2012, 2013, 2014HitachiJapanComputer Hardware2011, 2012, 2013, 2014Honda MotorJapanAutomotive2011, 2012, 2013, 2014Honeywell InternationalUSAElectrical Products2011, 2012, 2013, 2014Idemitsu KosanJapanOil & GasIFP Energies NouvellesFranceScientific Research2011, 2012, 2013, 2014IntelUSASemiconductor & Electronic Components2011, 2012, 2013, 2014InterDigitalUSATelecommunication & EquipmentJapan Science and TechnologyAgency (JST)JapanScientific ResearchJohnson & JohnsonUSAPharmaceuticalJohnson ControlsUSAAutomotiveJTEKTJapanAutomotiveKawasaki Heavy IndustriesJapanIndustrialKobe SteelJapanPrimary ectrical Products2014LG ElectronicsS KoreaConsumer Products2011, 2012, 2013, 2014Lockheed MartinUSATransportation Equipment2012, 2013, 2014LSISS KoreaElectrical Power2011, 2012, 2013, 2014Makita CorporationJapanMachineryMarvellUSASemiconductor & Electronic Components2012, 2013, 2014MediaTekTaiwanSemiconductor & Electronic Components2014MedtronicUSAMedical Devices2014MicronUSASemiconductor & Electronic Components2012, 2013, 2014MicrosoftUSAComputer Software2011, 2012, 2013, 2014Mitsubishi ElectricJapanElectrical Products2011, 2012, 2013, 2014Mitsubishi Heavy IndustriesJapanMachinery2012, 2013, 2014Mitsui ChemicalsJapanChemicalNECJapanComputer Hardware2011, 2012, 2013, 2014NikeUSAConsumer Products2012, 2013, 2014Nippon Steel & Sumitomo MetalJapanPrimary Metals2012, 2013, 2014Nissan MotorJapanAutomotive2013, 2014Nitto DenkoJapanChemical2011, 2012, 2013, 2014NovartisSwitzerlandPharmaceutical20142013, 20148
TOP 100 GLOBAL INNOVATORSTHOMSON REUTERS2015 Top 100 Global Innovators9OrganizationCountryIndustryPrevious WinnersNTTJapanTelecommunication & Equipment2011, 2012, 2013, 2014OlympusJapanHealthcare Products2011, 2012, 2013, 2014OracleUSAComputer Software2013, 2014PanasonicJapanConsumer Products2011, 2012, 2013, 2014PhilipsNetherlandsElectrical Products2011, 2013, 2014QualcommUSASemiconductor & Electronic Components2011, 2012, 2013, 2014RocheSwitzerlandPharmaceutical2011,2012,2013, 2014SafranFranceTransportation Equipment2013, 2014Saint-GobainFranceIndustrial2011, 2012, 2013, 2014Samsung ElectronicsS KoreaSemiconductor & Electronic Components2011, 2012, 2013, 2014SeagateUSAComputer Hardware2012, 2013, 2014Seiko EpsonJapanImaging2011, 2012, 2013, 2014Shin-Etsu ChemicalJapanChemical2011, 2012, 2013, 2014Showa anConsumer Products2011, 2012, 2013, 2014Sumitomo ElectricJapanIndustrial2011, 2013, 2014SymantecUSAComputer Software2011, 2012, 2013, 2014TE ConnectivitySwitzerlandSemiconductor & Electronic Components2011, 2012, 2013, 2014ThalesFranceTransportation Equipment2012, 2013TorayJapanChemicalToshibaJapanComputer Hardware2011, 2012, 2013, 2014Toyota MotorJapanAutomotive2011, 2012, 2013, 2014ValeoFranceAutomotive2012, 2013XilinxUSASemiconductor & Electronic Components2012, 2013, 2014YamahaJapanConsumer Products2011, 2014Yamaha MotorJapanAutomotiveYaskawa ElectricJapanIndustrialYazakiJapanAutomotive
THOMSON REUTERSTOP 100 GLOBAL INNOVATORSGeographic BreakoutGlobalThe 2015 Top 100 Global Innovators hail from three continents andcomprise eleven countries. Just two countries account for 75 percent of thelist: Japan and the US, making them the true innovation hubs of the world.The remaining nine countries include Belgium, Canada, France, Germany,the Netherlands, South Korea, Sweden, Switzerland and Taiwan (seeFigure 2). The majority of the nations in our world are absent fromhosting even one of the world’s leading innovators.Figure 2: Composition of the 2015 Top 100Global InnovatorsFigure 3: 2015 versus 2014 Top 100 Global InnovatorRepresentation by Country403530252015105JapanSouth ndsCanadaBelgiumSwitzerlandSouth KoreaGermanyFranceUS0Japan30%Source: Thomson Reuters Derwent World Patents Index10
TOP 100 GLOBAL INNOVATORSTHOMSON REUTERSAsiaAsia continues to be the regionalfrontrunner in terms of its innovationactivity. Japan once again takes the spotas the country with the most Top 100Global Innovator representation, with40 such companies on the 2015 list(compared to 39 in 2014). South Koreaand Taiwan join Japan in solidifyingAsia’s innovation leadership position,contributing three and one companies,respectively. This cements Asia’sleadership position in discovering,protecting and commercializing ideaswith 44 percent of the top 100 slots(see Figure 4).Figure 4: Asian Representation Compared to Rest of World for the 2015Top 100 Global InnovatorsJapanSouth KoreaTaiwanNorth AmericaMissing from the list this year is China.There was one Chinese company in 2014:Huawei, however its Globalization scorekept it from being a repeat honoree.Similarly, the volume from South Koreaand Taiwan hasdecreased over the2930% byprior year; South Korea dropped25 percent and Taiwan by 50 percentover 2014 levels.North AmericaNorth American representation ofthe 2015 Top 100 Global Innovatorsis exactly the same as it was in 2014:35 companies from the United Statesand one from Canada. However, theUS composition is much different, asshown in Table 1, with new entrants suchas Amazon, InterDigital and JohnsonControls all making the list for the firsttime. The one company from Canadaremains the same: Blackberry.11EuropeSource: Thomson Reuters Derwent World Patents Index
THOMSON REUTERSTOP 100 GLOBAL INNOVATORSTable 1: Change in Representation of the 2015 Top 100 Global InnovatorsNew 2015CountryDropped from 2014CountryAir USAsahi GlassJapanAnalog DevicesUSAT&TUSBayerGermanyBoschGermanyBecton DickinsonUSBrother IndustriesJapanBoehringer IngelheimGermanyCorningUSBridgestoneJapanCovidien (merged into Medtronic)USBristol-Myers SquibbUSDenso CorporationJapanChevronUSETRIS KoreaExxon MobilUSHewlett-PackardUSIdemitsu KosanJapanHuaweiChinaInterDigitalUSIBMUSJapan Science & Technology AgencyJapanITRITaiwanJohnson ControlsUSKao CorporationJapanJTEKTJapanNGK CorporationJapanKawasaki Heavy IndustriesJapanRicohJapanMakita CorporationJapanSanDiskUSMitsui ChemicalsJapanSemiconductor Energy LabJapanShowa mitomo RubberJapanValeoFranceTDKJapanYamaha MotorJapanTexas InstrumentsUSYaskawa ElectricJapanTokyo ElectronJapanYazakiJapanXeroxUSSource: Thomson Reuters Derwent World Patents Index12
TOP 100 GLOBAL INNOVATORSTHOMSON REUTERSEuropeEurope increased its overall share inthe Top 100 by two percent over 2014,and now holds 20 percent of the overallpie. Its country distribution has shiftedslightly as well. France continues to leadthe region, this year with 10 percent ofthe 100, versus just seven percent lastyear, adding Alstom, Thales and Valeoto its roster. Germany stayed consistentwith four companies on the list, whileBelgium rejoined the group onceagain with the reappearance of Solvay.Switzerland contributed three (versusfive in 2014), while the Netherlands andSweden remain with one honoree each.Figure 5 shows the regional contributionof each country.The United Kingdom is noticeablyabsent from the list again this year, ashas been the case in the past. Several2930%factors contribute to this, oneof themost important of which is that theUK’s investment in R&D as a proportionof GDP (GERD) is only 1.63 percent,a noteworthy difference from the2.73 percent in the US, 2.23 percentin France, 2.85 percent in Germany,and whopping 3.47 percent in Japan.Initiatives such as the UK Patent Box,which provides tax credits and incentivesto UK-based companies with profitsderived from sales of patented productsor processes, will take a couple ofyears to take effect given the lagtime between discovery, protectionand commercialization.13Figure 5: European Representation of the 2015 Top 100 Global dsSwedenSource: Thomson Reuters Derwent World Patents Index
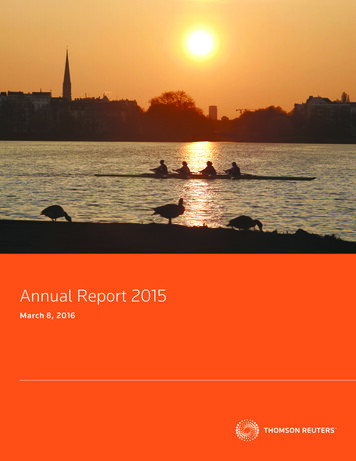
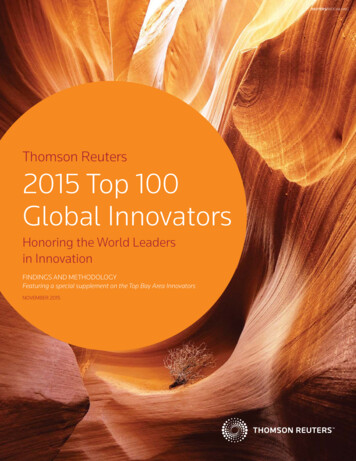
THOMSON REUTERSTOP 100 GLOBAL INNOVATORSIndustry BreakoutIndustry representation across the 2015 Top 100 Global Innovatorcompanies covers all of the same industries as in 2014, as well as threenew ones: Electrical Power, Imaging and Oil & Gas (previously Petroleum),as shown in Table 2.The biggest year-over-year jumps weremade in Chemicals, Media InternetSearch & Navigation Systems, andOil & Gas. The latter didn’t have anyrepresentation in 2014, while this yearthere are three such companies on thelist: Chevron, Exxon Mobil and IdemitsuKosan. The increase in Oil & Gas isinfluenced by the uptake of hydraulicfracking as well as these companiesexpanding from their traditional basein petroleum to new areas of innovationrelated to alternative energy.Similarly, the Chemical sector saw alarge uptick, doubling its representationover 2014. New entrants in this areainclude: Air Products, Mitsui Chemicals,Showa Denko, Solvay, Toray andNitto Denko (the latter of which wasreassigned from Industrial to Chemical).This change is indicative of the growingrole chemicals play in our world, frominfluencing drug development andfood chemistry to agriculture crops andindustrial solvents. And, these needsare growing, as governments andorganizations grapple with multipleissues related to caring for and feedingthe world’s growing population, at 7.2billion and counting.Media Internet Search & NavigationSystems is an emerging innovationarea, as traditional web-based searchcompanies expand from their originalbase into tangential sectors that alsorequire patent protection.Amazon joins the ranks of the Top100 Global Innovators for the firsttime, generating several handfulsof new US inventions each month.Its innovation falls into three broadbuckets: data centers, devices, andelectronic methods and systems. Theseinclude everything from identifying andresponding to malicious or potentiallymalicious activity (US9154515B1) toheadphones with asymmetric coupling(US8891798B1), to carrying cases forelectronic readers, such as the Kindle(US8915357B2), as shown in Figure 6.These underscore the online shoppinggiant’s plans to continue investing in themanufacture and sale of its own goods.14
TOP 100 GLOBAL INNOVATORSTHOMSON REUTERSTable 2: 2015 versus 2014 Industry Comparison of Top 100 Global InnovatorsIndustry20152014% ChangeChemical126100%Semiconductors &Electronic 475%Computer Hardware613(54%)*Consumer Products67(14%)Electrical Products6520%Industrial68(25%)Telecommunication & Equipment67(14%)Scientific Research56(17%)Transportation Equipment330%Computer Software330%Imaging (new)3n/aOil & Gas (previously Petroleum)3-Electrical Power (new)2n/aMachinery24(50%)*Media Internet Search & Navigation Systems21100%Medical Devices220%Primary Metals220%Aerospace110%Healthcare Products110%300%Source: Thomson Reuters Derwent World Patents Index* Declines in Computer Hardware & Machinery are partially due to a re-assignment ofcompanies to more appropriate sectors.15Figure 6: Amazon Technology Inc.’s US Patents8891798B1 for headphones and 8915357B2 for acarrying case for electronic readersSource: Thomson Innovation
THOMSON REUTERSThe full distribution of the Top 100Global Innovators, Figure 7, showsthat despite the increases in Chemical,Media Internet Search & NavigationSystems, and Oil & Gas, the largestindustry sectors continue to beled by Semiconductor & ElectronicComponents, Automotive andPharmaceuticals. And this is still despitethe fact that the Semiconductor sectorexperienced a 43 percent year-over-yeardecline, dropping from 21 representativeTOP 100 GLOBAL INNOVATORScompanies in 2014 to just 12 in 2015.This is the lowest Semiconductorrepresentation since the inception of theTop 100 Global Innovators, which haveranged from 14 to 23 companies overthe course of the program (see Table 3).Figure 7: Industry Representation across 2015 Top 100 Global InnovatorsChemicalSemiconductor & Electronic ComponentsAutomotivePharmaceutical222 2 1 12Computer Hardware12Consumer Products3Electrical Products3Industrial123Telecommunications & Equipment3Scientific Research5Transportation EquipmentComputer Software106ImagingOil & Gas67666Electrical PowerMachineryMedia Internet Search & Navigation SystemsMedical DevicesPrimary MetalsAerospaceHealthcare ProductsSource: Thomson Reuters Derwent World Patents Index16
TOP 100 GLOBAL INNOVATORSTHOMSON REUTERSTable 3: Top 100 Global Innovator Industry Representation Comparison (2011 – 2015)Industry2015 %2014 %2013 %2012 %2011 %Aerospace1%1%2%2%3%Agriculture & 6%6%8%13%Colleges/ Universities0%0%0%2%0%Computer Hardware6%13%11%13%11%Computer Software3%3%3%2%4%Consumer Products6%7%7%7%9%Electrical Power2%n/an/an/an/aElectrical Products6%5%4%5%6%Government Agencies0%0%2%2%0%Healthcare %8%7%3%6%Machinery2%4%5%6%8%Media/Internet Search & Navigation Systems2%1%1%1%0%Medical Devices2%2%1%0%0%Oil & Gas ary Metals2%2%1%1%0%Scientific Research5%6%4%5%3%Semiconductors & Electronic Components12%21%23%18%14%Telecom Equipment6%7%7%7%7%Transportation Equipment3%3%4%7%5%Source: Thomson Reuters Derwent World Patents Index17
THOMSON REUTERSSemiconductorsThe Semiconductor & ElectronicsComponents space is evolving, withdecreased representation on the overallTop 100 list, despite it being one of thelargest categories again this year. TheUS leads the world in Semiconductoractivity with nine companies or 75percent of the sector’s representation.The remaining three are from SouthKorea, Switzerland and Taiwan, eac
Thomson Reuters IP & Science Founding member of the Top 100 Global Innovator team 1 Ocean Tomo 2 Intellectual Property & the U.S. Economy: Industries in Focus, 2012 3 "Patents as Quality Signals for Entrepreneurial Ventures," Academy of Management Journal, 2008 4 Global Intellectual Property Center, U.S. Chamber of Commerce