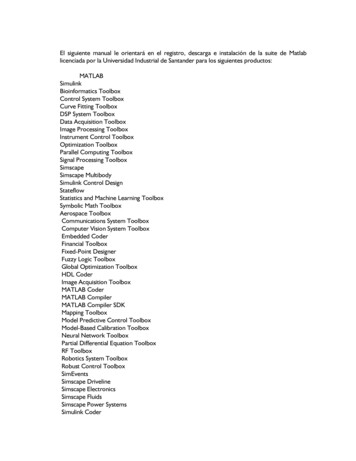
Transcription
Statistics Toolbox 7User’s Guide
How to Contact MathWorksWebNewsgroupwww.mathworks.com/contact TS.html Technical service@mathworks.cominfo@mathworks.comProduct enhancement suggestionsBug reportsDocumentation error reportsOrder status, license renewals, passcodesSales, pricing, and general information508-647-7000 (Phone)508-647-7001 (Fax)The MathWorks, Inc.3 Apple Hill DriveNatick, MA 01760-2098For contact information about worldwide offices, see the MathWorks Web site.Statistics Toolbox User’s Guide COPYRIGHT 1993–2011 by The MathWorks, Inc.The software described in this document is furnished under a license agreement. The software may be usedor copied only under the terms of the license agreement. No part of this manual may be photocopied orreproduced in any form without prior written consent from The MathWorks, Inc.FEDERAL ACQUISITION: This provision applies to all acquisitions of the Program and Documentationby, for, or through the federal government of the United States. By accepting delivery of the Programor Documentation, the government hereby agrees that this software or documentation qualifies ascommercial computer software or commercial computer software documentation as such terms are usedor defined in FAR 12.212, DFARS Part 227.72, and DFARS 252.227-7014. Accordingly, the terms andconditions of this Agreement and only those rights specified in this Agreement, shall pertain to and governthe use, modification, reproduction, release, performance, display, and disclosure of the Program andDocumentation by the federal government (or other entity acquiring for or through the federal government)and shall supersede any conflicting contractual terms or conditions. If this License fails to meet thegovernment’s needs or is inconsistent in any respect with federal procurement law, the government agreesto return the Program and Documentation, unused, to The MathWorks, Inc.TrademarksMATLAB and Simulink are registered trademarks of The MathWorks, Inc. Seewww.mathworks.com/trademarks for a list of additional trademarks. Other product or brandnames may be trademarks or registered trademarks of their respective holders.PatentsMathWorks products are protected by one or more U.S. patents. Please seewww.mathworks.com/patents for more information.
Revision HistorySeptember 1993March 1996January 1997November 2000May 2001July 2002February 2003June 2004October 2004March 2005September 2005March 2006September 2006March 2007September 2007March 2008October 2008March 2009September 2009March 2010September 2010April 2011First printingSecond printingThird printingFourth printingFifth printingSixth printingOnline onlySeventh printingOnline onlyOnline onlyOnline onlyOnline onlyOnline onlyEighth printingNinth printingOnline onlyOnline onlyOnline onlyOnline onlyOnline onlyOnline onlyOnline onlyVersion 1.0Version 2.0Version 2.11Revised for Version 3.0 (Release 12)Minor revisionsRevised for Version 4.0 (Release 13)Revised for Version 4.1 (Release 13.0.1)Revised for Version 5.0 (Release 14)Revised for Version 5.0.1 (Release 14SP1)Revised for Version 5.0.2 (Release 14SP2)Revised for Version 5.1 (Release 14SP3)Revised for Version 5.2 (Release 2006a)Revised for Version 5.3 (Release 2006b)Revised for Version 6.0 (Release 2007a)Revised for Version 6.1 (Release 2007b)Revised for Version 6.2 (Release 2008a)Revised for Version 7.0 (Release 2008b)Revised for Version 7.1 (Release 2009a)Revised for Version 7.2 (Release 2009b)Revised for Version 7.3 (Release 2010a)Revised for Version 7.4 (Release 2010b)Revised for Version 7.5 (Release 2011a)
ContentsGetting Started1Product Overview . . . . . . . . . . . . . . . . . . . . . . . . . . . . . . . . .1-2Organizing Data2Introduction . . . . . . . . . . . . . . . . . . . . . . . . . . . . . . . . . . . . . .2-2MATLAB Arrays . . . . . . . . . . . . . . . . . . . . . . . . . . . . . . . . . . .Numerical Data . . . . . . . . . . . . . . . . . . . . . . . . . . . . . . . . . . .Heterogeneous Data . . . . . . . . . . . . . . . . . . . . . . . . . . . . . . .Statistical Functions . . . . . . . . . . . . . . . . . . . . . . . . . . . . . . .2-42-42-72-9Statistical Arrays . . . . . . . . . . . . . . . . . . . . . . . . . . . . . . . . . .Introduction . . . . . . . . . . . . . . . . . . . . . . . . . . . . . . . . . . . . . .Categorical Arrays . . . . . . . . . . . . . . . . . . . . . . . . . . . . . . . .Dataset Arrays . . . . . . . . . . . . . . . . . . . . . . . . . . . . . . . . . . .2-112-112-132-23Grouped Data . . . . . . . . . . . . . . . . . . . . . . . . . . . . . . . . . . . . .Grouping Variables . . . . . . . . . . . . . . . . . . . . . . . . . . . . . . . .Level Order Definition . . . . . . . . . . . . . . . . . . . . . . . . . . . . .Functions for Grouped Data . . . . . . . . . . . . . . . . . . . . . . . . .Using Grouping Variables . . . . . . . . . . . . . . . . . . . . . . . . . .2-342-342-352-352-37Descriptive Statistics3Introduction . . . . . . . . . . . . . . . . . . . . . . . . . . . . . . . . . . . . . .3-2v
Measures of Central Tendency . . . . . . . . . . . . . . . . . . . . . .3-3.3-5Measures of Shape . . . . . . . . . . . . . . . . . . . . . . . . . . . . . . . . .3-7Resampling Statistics . . . . . . . . . . . . . . . . . . . . . . . . . . . . . .The Bootstrap . . . . . . . . . . . . . . . . . . . . . . . . . . . . . . . . . . . .The Jackknife . . . . . . . . . . . . . . . . . . . . . . . . . . . . . . . . . . . .Parallel Computing Support for Resampling Methods . . . .3-93-93-123-13Data with Missing Values . . . . . . . . . . . . . . . . . . . . . . . . . . .3-14Measures of DispersionStatistical Visualization4Introduction . . . . . . . . . . . . . . . . . . . . . . . . . . . . . . . . . . . . . .4-2Scatter Plots . . . . . . . . . . . . . . . . . . . . . . . . . . . . . . . . . . . . . .4-3.4-6Distribution Plots . . . . . . . . . . . . . . . . . . . . . . . . . . . . . . . . .Normal Probability Plots . . . . . . . . . . . . . . . . . . . . . . . . . . .Quantile-Quantile Plots . . . . . . . . . . . . . . . . . . . . . . . . . . . .Cumulative Distribution Plots . . . . . . . . . . . . . . . . . . . . . . .Other Probability Plots . . . . . . . . . . . . . . . . . . . . . . . . . . . . .4-84-84-104-124-14Box PlotsProbability Distributions5Using Probability Distributions . . . . . . . . . . . . . . . . . . . . .viContents5-2
Supported Distributions . . . . . . . . . . . . . . . . . . . . . . . . . . .Parametric Distributions . . . . . . . . . . . . . . . . . . . . . . . . . . .Nonparametric Distributions . . . . . . . . . . . . . . . . . . . . . . . .5-35-45-8Working with Distributions Through GUIs . . . . . . . . . . .Exploring Distributions . . . . . . . . . . . . . . . . . . . . . . . . . . . .Modeling Data Using the Distribution Fitting Tool . . . . . .Visually Exploring Random Number Generation . . . . . . . .5-95-95-115-49Statistics Toolbox Distribution Functions . . . . . . . . . . .Probability Density Functions . . . . . . . . . . . . . . . . . . . . . . .Cumulative Distribution Functions . . . . . . . . . . . . . . . . . . .Inverse Cumulative Distribution Functions . . . . . . . . . . . .Distribution Statistics Functions . . . . . . . . . . . . . . . . . . . . .Distribution Fitting Functions . . . . . . . . . . . . . . . . . . . . . . .Negative Log-Likelihood Functions . . . . . . . . . . . . . . . . . . .Random Number Generators . . . . . . . . . . . . . . . . . . . . . . . .5-525-525-625-665-685-705-775-80Using Probability Distribution Objects . . . . . . . . . . . . . .Using Distribution Objects . . . . . . . . . . . . . . . . . . . . . . . . . .What are Objects? . . . . . . . . . . . . . . . . . . . . . . . . . . . . . . . . .Creating Distribution Objects . . . . . . . . . . . . . . . . . . . . . . .Object-Supported Distributions . . . . . . . . . . . . . . . . . . . . . .Performing Calculations Using Distribution Objects . . . . .Capturing Results Using Distribution Objects . . . . . . . . . .5-845-845-855-885-895-905-97Probability Distributions Used for MultivariateModeling . . . . . . . . . . . . . . . . . . . . . . . . . . . . . . . . . . . . . . . 5-99Gaussian Mixture Models . . . . . . . . . . . . . . . . . . . . . . . . . . . 5-99Copulas . . . . . . . . . . . . . . . . . . . . . . . . . . . . . . . . . . . . . . . . . 5-107Random Number Generation6Generating Random Data . . . . . . . . . . . . . . . . . . . . . . . . . .6-2Random Number Generation Functions . . . . . . . . . . . . .6-3vii
Common Generation Methods . . . . . . . . . . . . . . . . . . . . . .Direct Methods . . . . . . . . . . . . . . . . . . . . . . . . . . . . . . . . . . .Inversion Methods . . . . . . . . . . . . . . . . . . . . . . . . . . . . . . . . .Acceptance-Rejection Methods . . . . . . . . . . . . . . . . . . . . . . .6-56-56-76-9Representing Sampling Distributions Using MarkovChain Samplers . . . . . . . . . . . . . . . . . . . . . . . . . . . . . . . . .Using the Metropolis-Hastings Algorithm . . . . . . . . . . . . . .Using Slice Sampling . . . . . . . . . . . . . . . . . . . . . . . . . . . . . .6-136-136-14Generating Quasi-Random Numbers . . . . . . . . . . . . . . . .Quasi-Random Sequences . . . . . . . . . . . . . . . . . . . . . . . . . . .Quasi-Random Point Sets . . . . . . . . . . . . . . . . . . . . . . . . . . .Quasi-Random Streams . . . . . . . . . . . . . . . . . . . . . . . . . . . .6-156-156-166-23Generating Data Using Flexible Families ofDistributions . . . . . . . . . . . . . . . . . . . . . . . . . . . . . . . . . . . .Pearson and Johnson Systems . . . . . . . . . . . . . . . . . . . . . . .Generating Data Using the Pearson System . . . . . . . . . . . .Generating Data Using the Johnson System . . . . . . . . . . .6-256-256-266-28Hypothesis Tests7viiiContentsIntroduction . . . . . . . . . . . . . . . . . . . . . . . . . . . . . . . . . . . . . .7-2Hypothesis Test Terminology . . . . . . . . . . . . . . . . . . . . . . .7-3Hypothesis Test Assumptions . . . . . . . . . . . . . . . . . . . . . . .7-5Example: Hypothesis Testing . . . . . . . . . . . . . . . . . . . . . . .7-7Available Hypothesis Tests . . . . . . . . . . . . . . . . . . . . . . . . .7-13
Analysis of Variance8Introduction . . . . . . . . . . . . . . . . . . . . . . . . . . . . . . . . . . . . . .8-2ANOVA . . . . . . . . . . . . . . . . . . . . . . . . . . . . . . . . . . . . . . . . . . .One-Way ANOVA . . . . . . . . . . . . . . . . . . . . . . . . . . . . . . . . .Two-Way ANOVA . . . . . . . . . . . . . . . . . . . . . . . . . . . . . . . . .N-Way ANOVA . . . . . . . . . . . . . . . . . . . . . . . . . . . . . . . . . . .Other ANOVA Models . . . . . . . . . . . . . . . . . . . . . . . . . . . . . .Analysis of Covariance . . . . . . . . . . . . . . . . . . . . . . . . . . . . .Nonparametric Methods . . . . . . . . . . . . . . . . . . . . . . . . . . . .8-38-38-98-128-268-278-35MANOVA . . . . . . . . . . . . . . . . . . . . . . . . . . . . . . . . . . . . . . . . .Introduction . . . . . . . . . . . . . . . . . . . . . . . . . . . . . . . . . . . . . .ANOVA with Multiple Responses . . . . . . . . . . . . . . . . . . . .8-398-398-39Parametric Regression Analysis9Introduction . . . . . . . . . . . . . . . . . . . . . . . . . . . . . . . . . . . . . .9-2Linear Regression . . . . . . . . . . . . . . . . . . . . . . . . . . . . . . . . .Linear Regression Models . . . . . . . . . . . . . . . . . . . . . . . . . . .Multiple Linear Regression . . . . . . . . . . . . . . . . . . . . . . . . .Robust Regression . . . . . . . . . . . . . . . . . . . . . . . . . . . . . . . . .Stepwise Regression . . . . . . . . . . . . . . . . . . . . . . . . . . . . . . .Ridge Regression . . . . . . . . . . . . . . . . . . . . . . . . . . . . . . . . . .Partial Least Squares . . . . . . . . . . . . . . . . . . . . . . . . . . . . . .Polynomial Models . . . . . . . . . . . . . . . . . . . . . . . . . . . . . . . .Response Surface Models . . . . . . . . . . . . . . . . . . . . . . . . . . .Generalized Linear Models . . . . . . . . . . . . . . . . . . . . . . . . . .Multivariate Regression . . . . . . . . . . . . . . . . . . . . . . . . . . . r Regression . . . . . . . . . . . . . . . . . . . . . . . . . . . . . .Nonlinear Regression Models . . . . . . . . . . . . . . . . . . . . . . . .Parametric Models . . . . . . . . . . . . . . . . . . . . . . . . . . . . . . . .Mixed-Effects Models . . . . . . . . . . . . . . . . . . . . . . . . . . . . . .9-589-589-599-64ix
Multivariate Methods10Introduction . . . . . . . . . . . . . . . . . . . . . . . . . . . . . . . . . . . . . .10-2Multidimensional Scaling . . . . . . . . . . . . . . . . . . . . . . . . . . 10-3Introduction . . . . . . . . . . . . . . . . . . . . . . . . . . . . . . . . . . . . . . 10-3Classical Multidimensional Scaling . . . . . . . . . . . . . . . . . . . 10-3Nonclassical Multidimensional Scaling . . . . . . . . . . . . . . . . 10-8Nonmetric Multidimensional Scaling . . . . . . . . . . . . . . . . . 10-10Procrustes Analysis . . . . . . . . . . . . . . . . . . . . . . . . . . . . . . . .Comparing Landmark Data . . . . . . . . . . . . . . . . . . . . . . . . .Data Input . . . . . . . . . . . . . . . . . . . . . . . . . . . . . . . . . . . . . . .Preprocessing Data for Accurate Results . . . . . . . . . . . . . .Example: Comparing Handwritten Shapes . . . . . . . . . . . . .10-1410-1410-1410-1510-16Feature Selection . . . . . . . . . . . . . . . . . . . . . . . . . . . . . . . . . . 10-23Introduction . . . . . . . . . . . . . . . . . . . . . . . . . . . . . . . . . . . . . . 10-23Sequential Feature Selection . . . . . . . . . . . . . . . . . . . . . . . . 10-23Feature Transformation . . . . . . . . . . . . . . . . . . . . . . . . . . . .Introduction . . . . . . . . . . . . . . . . . . . . . . . . . . . . . . . . . . . . . .Nonnegative Matrix Factorization . . . . . . . . . . . . . . . . . . . .Principal Component Analysis (PCA) . . . . . . . . . . . . . . . . .Factor Analysis . . . . . . . . . . . . . . . . . . . . . . . . . . . . . . . . . . .10-2810-2810-2810-3110-45Cluster Analysis11xContentsIntroduction . . . . . . . . . . . . . . . . . . . . . . . . . . . . . . . . . . . . . .11-2Hierarchical Clustering . . . . . . . . . . . . . . . . . . . . . . . . . . . .Introduction . . . . . . . . . . . . . . . . . . . . . . . . . . . . . . . . . . . . . .Algorithm Description . . . . . . . . . . . . . . . . . . . . . . . . . . . . . .Similarity Measures . . . . . . . . . . . . . . . . . . . . . . . . . . . . . . .Linkages . . . . . . . . . . . . . . . . . . . . . . . . . . . . . . . . . . . . . . . .11-311-311-311-411-6
Dendrograms . . . . . . . . . . . . . . . . . . . . . . . . . . . . . . . . . . . . . 11-8Verifying the Cluster Tree . . . . . . . . . . . . . . . . . . . . . . . . . . 11-10Creating Clusters . . . . . . . . . . . . . . . . . . . . . . . . . . . . . . . . . 11-16K-Means Clustering . . . . . . . . . . . . . . . . . . . . . . . . . . . . . . . .Introduction . . . . . . . . . . . . . . . . . . . . . . . . . . . . . . . . . . . . . .Creating Clusters and Determining Separation . . . . . . . . .Determining the Correct Number of Clusters . . . . . . . . . . .Avoiding Local Minima . . . . . . . . . . . . . . . . . . . . . . . . . . . . .11-2111-2111-2211-2311-26Gaussian Mixture Models . . . . . . . . . . . . . . . . . . . . . . . . . . 11-28Introduction . . . . . . . . . . . . . . . . . . . . . . . . . . . . . . . . . . . . . . 11-28Clustering with Gaussian Mixtures . . . . . . . . . . . . . . . . . . . 11-28Parametric Classification12Introduction . . . . . . . . . . . . . . . . . . . . . . . . . . . . . . . . . . . . . .12-2Discriminant Analysis . . . . . . . . . . . . . . . . . . . . . . . . . . . . .Introduction . . . . . . . . . . . . . . . . . . . . . . . . . . . . . . . . . . . . . .Example: Discriminant Analysis . . . . . . . . . . . . . . . . . . . . .12-312-312-3Naive Bayes Classification . . . . . . . . . . . . . . . . . . . . . . . . .Supported Distributions . . . . . . . . . . . . . . . . . . . . . . . . . . . .12-612-6Performance Curves . . . . . . . . . . . . . . . . . . . . . . . . . . . . . . .Introduction . . . . . . . . . . . . . . . . . . . . . . . . . . . . . . . . . . . . . .What are ROC Curves? . . . . . . . . . . . . . . . . . . . . . . . . . . . . .Evaluating Classifier Performance Using perfcurve . . . . .12-912-912-912-9xi
Supervised Learning13Supervised Learning (Machine Learning) Workflowand Algorithms . . . . . . . . . . . . . . . . . . . . . . . . . . . . . . . . . .Steps in Supervised Learning (Machine Learning) . . . . . .Characteristics of Algorithms . . . . . . . . . . . . . . . . . . . . . . . .13-213-213-6Classification Using Nearest Neighbors . . . . . . . . . . . . . . 13-8Pairwise Distance . . . . . . . . . . . . . . . . . . . . . . . . . . . . . . . . . 13-8k-Nearest Neighbor Search . . . . . . . . . . . . . . . . . . . . . . . . . 13-11Classification Trees and Regression Trees . . . . . . . . . . .What Are Classification Trees and Regression Trees? . . . .Creating Classification Trees and Regression Trees . . . . .Predicting Responses With Classification Trees andRegression Trees . . . . . . . . . . . . . . . . . . . . . . . . . . . . . . . .Improving Classification Trees and Regression Trees . . . .Alternative: classregtree . . . . . . . . . . . . . . . . . . . . . . . . . . .13-2513-2513-26Ensemble Methods . . . . . . . . . . . . . . . . . . . . . . . . . . . . . . . . .Framework for Ensemble Learning . . . . . . . . . . . . . . . . . . .Basic Ensemble Examples . . . . . . . . . . . . . . . . . . . . . . . . . .Test Ensemble Quality . . . . . . . . . . . . . . . . . . . . . . . . . . . . .Classification: Imbalanced Data or UnequalMisclassification Costs . . . . . . . . . . . . . . . . . . . . . . . . . . .Example: Classification with Many Categorical Levels . . .Example: Surrogate Splits . . . . . . . . . . . . . . . . . . . . . . . . . .Ensemble Regularization . . . . . . . . . . . . . . . . . . . . . . . . . . .Example: Tuning RobustBoost . . . . . . . . . . . . . . . . . . . . . . .TreeBagger Examples . . . . . . . . . . . . . . . . . . . . . . . . . . . . . .Ensemble Algorithms . . . . . . . . . . . . . . . . . . . . . . . . . . . . . 613-8113-9213-9613-118Bibliography . . . . . . . . . . . . . . . . . . . . . . . . . . . . . . . . . . . . . . 13-130xiiContents
Markov Models14Introduction . . . . . . . . . . . . . . . . . . . . . . . . . . . . . . . . . . . . . .14-2Markov Chains . . . . . . . . . . . . . . . . . . . . . . . . . . . . . . . . . . . .14-3Hidden Markov Models (HMM) . . . . . . . . . . . . . . . . . . . . . .Introduction . . . . . . . . . . . . . . . . . . . . . . . . . . . . . . . . . . . . . .Analyzing Hidden Markov Models . . . . . . . . . . . . . . . . . . . .14-514-514-7Design of Experiments15Introduction . . . . . . . . . . . . . . . . . . . . . . . . . . . . . . . . . . . . . .15-2Full Factorial Designs . . . . . . . . . . . . . . . . . . . . . . . . . . . . . .Multilevel Designs . . . . . . . . . . . . . . . . . . . . . . . . . . . . . . . .Two-Level Designs . . . . . . . . . . . . . . . . . . . . . . . . . . . . . . . .15-315-315-4Fractional Factorial Designs . . . . . . . . . . . . . . . . . . . . . . .Introduction . . . . . . . . . . . . . . . . . . . . . . . . . . . . . . . . . . . . . .Plackett-Burman Designs . . . . . . . . . . . . . . . . . . . . . . . . . . .General Fractional Designs . . . . . . . . . . . . . . . . . . . . . . . . .15-515-515-515-6Response Surface Designs . . . . . . . . . . . . . . . . . . . . . . . . . . 15-9Introduction . . . . . . . . . . . . . . . . . . . . . . . . . . . . . . . . . . . . . . 15-9Central Composite Designs . . . . . . . . . . . . . . . . . . . . . . . . . 15-9Box-Behnken Designs . . . . . . . . . . . . . . . . . . . . . . . . . . . . . . 15-13D-Optimal Designs . . . . . . . . . . . . . . . . . . . . . . . . . . . . . . . . .Introduction . . . . . . . . . . . . . . . . . . . . . . . . . . . . . . . . . . . . . .Generating D-Optimal Designs . . . . . . . . . . . . . . . . . . . . . .Augmenting D-Optimal Designs . . . . . . . . . . . . . . . . . . . . .Specifying Fixed Covariate Factors . . . . . . . . . . . . . . . . . . .Specifying Categorical Factors . . . . . . . . . . . . . . . . . . . . . . .Specifying Candidate Sets . . . . . . . . . . . . . . . . . . . . . . . . . .15-1515-1515-1615-1915-2015-2115-21xiii
Statistical Process Control16Introduction . . . . . . . . . . . . . . . . . . . . . . . . . . . . . . . . . . . . . .16-2Control Charts . . . . . . . . . . . . . . . . . . . . . . . . . . . . . . . . . . . .16-3Capability Studies . . . . . . . . . . . . . . . . . . . . . . . . . . . . . . . . .16-6Parallel Statistics17Quick Start Parallel Computing for StatisticsToolbox . . . . . . . . . . . . . . . . . . . . . . . . . . . . . . . . . . . . . . . . .What Is Parallel Statistics Functionality? . . . . . . . . . . . . .How To Compute in Parallel . . . . . . . . . . . . . . . . . . . . . . . .Example: Parallel Treebagger . . . . . . . . . . . . . . . . . . . . . . .17-217-217-317-5Concepts of Parallel Computing in StatisticsToolbox . . . . . . . . . . . . . . . . . . . . . . . . . . . . . . . . . . . . . . . . .Subtleties in Parallel Computing . . . . . . . . . . . . . . . . . . . . .Vocabulary for Parallel Computation . . . . . . . . . . . . . . . . .17-717-717-7When to Run Statistical Functions in Parallel . . . . . . . .Why Run in Parallel? . . . . . . . . . . . . . . . . . . . . . . . . . . . . . .Factors Affecting Speed . . . . . . . . . . . . . . . . . . . . . . . . . . . .Factors Affecting Results . . . . . . . . . . . . . . . . . . . . . . . . . . .17-817-817-817-9Working with parfor . . . . . . . . . . . . . . . . . . . . . . . . . . . . . . . 17-10How Statistical Functions Use parfor . . . . . . . . . . . . . . . . . 17-10Characteristics of parfor . . . . . . . . . . . . . . . . . . . . . . . . . . . . 17-11Reproducibility in Parallel Statistical Computations . . 17-13Issues and Considerations in Reproducing ParallelComputations . . . . . . . . . . . . . . . . . . . . . . . . . . . . . . . . . . 17-13Running Reproducible Parallel Computations . . . . . . . . . . 17-13xivContents
Subtleties in Parallel Statistical Computation UsingRandom Numbers . . . . . . . . . . . . . . . . . . . . . . . . . . . . . . . 17-14Examples of Parallel Statistical Functions . . . . . . . . . . .Example: Parallel Jackknife . . . . . . . . . . . . . . . . . . . . . . . .Example: Parallel Cross Validation . . . . . . . . . . . . . . . . . . .Example: Parallel Bootstrap . . . . . . . . . . . . . . . . . . . . . . . .17-1817-1817-1917-20Function Reference18File I/O . . . . . . . . . . . . . . . . . . . . . . . . . . . . . . . . . . . . . . . . . . .18-2Data Organization . . . . . . . . . . . . . . . . . . . . . . . . . . . . . . . . .Categorical Arrays . . . . . . . . . . . . . . . . . . . . . . . . . . . . . . . .Dataset Arrays . . . . . . . . . . . . . . . . . . . . . . . . . . . . . . . . . . .Grouped Data . . . . . . . . . . . . . . . . . . . . . . . . . . . . . . . . . . . .18-318-318-618-7Descriptive Statistics . . . . . . . . . . . . . . . . . . . . . . . . . . . . . . 18-8Summaries . . . . . . . . . . . . . . . . . . . . . . . . . . . . . . . . . . . . . . . 18-8Measures of Central Tendency . . . . . . . . . . . . . . . . . . . . . . . 18-8Measures of Dispersion . . . . . . . . . . . . . . . . . . . . . . . . . . . . . 18-8Measures of Shape . . . . . . . . . . . . . . . . . . . . . . . . . . . . . . . . 18-9Statistics Resampling . . . . . . . . . . . . . . . . . . . . . . . . . . . . . . 18-9Data with Missing Values . . . . . . . . . . . . . . . . . . . . . . . . . . 18-9Data Correlation . . . . . . . . . . . . . . . . . . . . . . . . . . . . . . . . . . 18-10Statistical Visualization . . . . . . . . . . . . . . . . . . . . . . . . . . . .Distribution Plots . . . . . . . . . . . . . . . . . . . . . . . . . . . . . . . . .Scatter Plots . . . . . . . . . . . . . . . . . . . . . . . . . . . . . . . . . . . . .ANOVA Plots . . . . . . . . . . . . . . . . . . . . . . . . . . . . . . . . . . . . .Regression Plots . . . . . . . . . . . . . . . . . . . . . . . . . . . . . . . . . .Multivariate Plots . . . . . . . . . . . . . . . . . . . . . . . . . . . . . . . . .Cluster Plots . . . . . . . . . . . . . . . . . . . . . . . . . . . . . . . . . . . . .Classification Plots . . . . . . . . . . . . . . . . . . . . . . . . . . . . . . . .DOE Plots . . . . . . . . . . . . . . . . . . . . . . . . . . . . . . . . . . . . . . .SPC Plots . . . . . . . . . . . . . . . . . . . . . . . . . . . . . . . . . . . . . . . 4xv
Probability Distributions . . . . . . . . . . . . . . . . . . . . . . . . . . .Distribution Objects . . . . . . . . . . . . . . . . . . . . . . . . . . . . . . .Distribution Plots . . . . . . . . . . . . . . . . . . . . . . . . . . . . . . . . .Probability Density . . . . . . . . . . . . . . . . . . . . . . . . . . . . . . . .Cumulative Distribution . . . . . . . . . . . . . . . . . . . . . . . . . . . .Inverse Cumulative Distribution . . . . . . . . . . . . . . . . . . . . .Distribution Statistics . . . . . . . . . . . . . . . . . . . . . . . . . . . . . .Distribution Fitting . . . . . . . . . . . . . . . . . . . . . . . . . . . . . . . .Negative Log-Likelihood . . . . . . . . . . . . . . . . . . . . . . . . . . . .Random Number Generators . . . . . . . . . . . . . . . . . . . . . . . .Quasi-Random Numbers . . . . . . . . . . . . . . . . . . . . . . . . . . .Piecewise Distributions . . . . . . . . . . . . . . . . . . . . . . . . . . . .Hypothesis 18-2618-2818-29. . . . . . . . . . . . . . . . . . . . . . . . . . . . . . . . . . 18-31Analysis of Variance . . . . . . . . . . . . . . . . . . . . . . . . . . . . . . . 18-32ANOVA Plots . . . . . . . . . . . . . . . . . . . . . . . . . . . . . . . . . . . . . 18-32ANOVA Operations . . . . . . . . . . . . . . . . . . . . . . . . . . . . . . . . 18-32Parametric Regression Analysis . . . . . . . . . . . . . . . . . . . .Regression Plots . . . . . . . . . . . . . . . . . . . . . . . . . . . . . . . . . .Linear Regression . . . . . . . . . . . . . . . . . . . . . . . . . . . . . . . . .Nonlinear Regression . . . . . . . . . . . . . . . . . . . . . . . . . . . . . .18-3318-3318-3418-35Multivariate Methods . . . . . . . . . . . . . . . . . . . . . . . . . . . . . .Multivariate Plots . . . . . . . . . . . . . . . . . . . . . . . . . . . . . . . . .Multidimensional Scaling . . . . . . . . . . . . . . . . . . . . . . . . . . .Procrustes Analysis . . . . . . . . . . . . . . . . . . . . . . . . . . . . . . . .Feature Selection . . . . . . . . . . . . . . . . . . . . . . . . . . . . . . . . .Feature Transformation . . . . . . . . . . . . . . . . . . . . . . . . . . . .18-3618-3618-3618-3618-3718-37Cluster Analysis . . . . . . . . . . . . . . . . . . . . . . . . . . . . . . . . . . .Cluster Plots . . . . . . . . . . . . . . . . . . . . . . . . . . . . . . . . . . . . .Hierarchical Clustering . . . . . . . . . . . . . . . . . . . . . . . . . . . .K-Means Clustering . . . . . . . . . . . . . . . . . . . . . . . . . . . . . . .Gaussian Mixture Models . . . . . . . . . . . . . . . . . . . . . . . . . . .18-3818-3818-3818-3918-39Model Assessment . . . . . . . . . . . . . . . . . . . . . . . . . . . . . . . . . 18-39Parametric Classification . . . . . . . . . . . . . . . . . . . . . . . . . . 18-40Classification Plots . . . . . . . . . . . . . . . . . . . . . . . . . . . . . . . . 18-40xviContents
Discriminant Analysis . . . . . . . . . . . . . . . . . . . . . . . . . . . . . 18-40Naive Bayes Classification . . . . . . . . . . . . . . . . . . . . . . . . . . 18-40Distance Computation and Nearest Neighbor Search . . . . 18-41Supervised Learning . . . . . . . . . . . . . . . . . . . . . . . . . . . . . . .Classification Trees . . . . . . . . . . . . . . . . . . . . . . . . . . . . . . . .Regression Trees . . . . . . . . . . . . . . . . . . . . . . . . . . . . . . . . . .Ensemble Methods — Classification . . . . . . . . . . . . . . . . . .Ensemble Methods — Regression . . . . . . . . . . . . . . . . . . . .18-4218-4218-4518-4718-50Hidden Markov Models . . . . . . . . . . . . . . . . . . . . . . . . . . . . . 18-53Design of Experiments . . . . . . . . . . . . . . . . . . . . . . . . . . . . .DOE Plots . . . . . . . . . . . . . . . . . . . . . . . . . . . . . . . . . . . . . . .Full Factorial Designs . . . . . . . . . . . . . . . . . . . . . . . . . . . . . .Fractional Factorial Designs . . . . . . . . . . . . . . . . . . . . . . . .Response Surface Designs . . . . . . . . . . . . . . . . . . . . . . . . . .D-Optimal Designs . . . . . . . . . . . . . . . . . . . . . . . . . . . . . . . .Latin Hypercube Designs . . . . . . . . . . . . . . . . . . . . . . . . . . .Quasi-Random Designs . . . . . . . . . . . . . . . . . . . . . . . . . . . . al Process Control . . . . . . . . . . . . . . . . . . . . . . . . . 18-58SPC Plots . . . . . . . . . . . . . . . . . . . . . . . . . . . . . . . . . . . . . . . . 18-58SPC Functions . . . . . . . . . . . . . . . . . . . . . . . . . . . . . . . . . . . . 18-58GUIs . . . . . . . . . . . . . . . . . . . . . . . . . . . . . . . . . . . . . . . . . . . . . . 18-59Utilities . . . . . . . . . . . . . . . . . . . . . . . . . . . . . . . . . . . . . . . . . . . 18-60Class Reference19Data Organization . . . . . . . . . . . . . . . . . . . . . . . . . . . . . . . . .Categ
Revision History September 1993 First printing Version 1.0 March 1996 Second printing Version 2.0 January 1997 Third printing Version 2.11 November 2000 Fourth printing Revised for Version 3.0 (Release 12)