Transcription
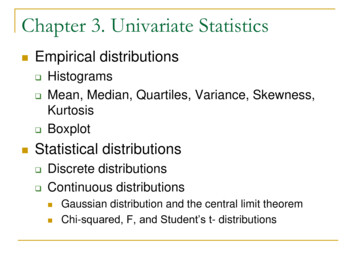
Chapter 3. Univariate Statistics Empirical distributions HistogramsMean, Median, Quartiles, Variance, Skewness,KurtosisBoxplotStatistical distributions Discrete distributionsContinuous distributions Gaussian distribution and the central limit theoremChi-squared, F, and Student’s t- distributions
Chapter 3. Univariate Statistics Statistical testing Chi-squared testF-testStudent’s t-testExtreme value distributions Generalized extreme value distribution Return periodExtreme threshold distributions Weibull distribution
Empirical distribution: HistogramHistogram shows the number of data points ina given data bin[n,xout] hist(data)Syntax%n: row vector if the number of data in each bin%xout: bin locationshist (data)hist(data, # of bins)hist(data, vector of data bins)Updated functions:hist histogram[n, edges] histcounts(data)center edges(1:end-1) diff(edges)/2
Empirical distribution: Histogramx randn(1000, 1);histogram(x)hist(x, 22)%gives similar resultshistogram(x, 50) %50 binsy -2:0.1:2;hist(x,y) %not prettyhistogram(x,y) %much better
Empirical distributionsHow do we describe a dataset?Discrete parameters min, max, mean Median, quartile standard deviation variance skewness kurtosis
Mean: Why different definitions? Arithmetic meanGeometric meanHarmonic mean1x NN xi 1ix ( x1 x2 . xN )1/ Nx NN1 i 1 xi
Median: write a median functionfunction m mymedian(x)a sort(x);b length(x);b2 floor(b/2);if (b/2 b2)%if mod(b,2)m a(b2 1);elsem 0.5*(a(b2) a(b2 1));endend
QuantilesDivide ordered data into (approximately) equalsized subsets of data.4-quantiles: quartiles100-quantiles: percentiles1st quartile: 25th percentile2nd quartile: median: 50th percentile
Quartilesx 1:15, what is the 3rd quartile?1.2.Use the median to divide the data to 2 subset(do not include the median value)The lower quartile is the median of the lowerhalf.The 3rd quartile is 12.Matlab uses linear interpolation:prctile(x,[25 50 75])
Dispersion of the data: Central moments nth moments:nth central moments 1st µ1 02nd µ2 variance3rd µ3 skewness4th µ4 kurtosis1' n NNnx ii 11 N n ( xi x)nN i 1
Moment statistics Variance and standarddeviationN12 2 2 (x x) iN 1 i 1N Skewness3(x x) ii 1N/ 3N Kurtosis ( x x)i 1iN4/ 4
Moment statisticsSkewness 0dist. shifts to the right of mean 0dist. symmetric around the mean 0dist. shifts to the left of mean( x x)Kurtosis (some define it as )/ 3N 3“wide” dist. 3normal dist 3“narrow” distN4i 1i4Which variable is most sensitive to the difference between themean with median values?
Moment statistics30002500 Variance: var(x)Standard deviation:std(x)200015001000500 How do variance,skewness and kurtosisof “red” data compareto “blue” data?0-4-3-2-101234
Moment statisticsHow do variance, skewness and kurtosis of “red” datacompare to6000“blue” data?500040003000200010000-505101520
Dealing with NaNx [1:120, NaN];mean(x), var(x)nanmean(x), nanvar(x)skewness(x)kurtosis(x)How do we remove the NaN values?x(isnan(x)) []x x( isnan(x))NaN NaN always return 0; must use isnan
Organic matter dataorg load('organicmatter one.txt');%checkout the dataplot(org,'o-'), ylabel('wt %')%histogram%sqrt of the number of data is often a good firstguess of intervals to usehist(org, 8)
12.51.171.36-0.252.47[11.4 12.5 13.3]
Historgram: customizedorg load('organicmatter one.txt');[n,xout] hist(org,8);%n: raw with the number of data of each bin%xout: bin locationsbar(xout, n, 'r') %red bar%3d barbar3(xout, n, 'b')
Sensitivity to outlierssodium load('sodiumcontent.txt');histogram(sodium,11)%add an outlinersodium2 sodium;sodium2(121,1) 0.1;%sodim2 [sodium;0.1];Which variable is most sensitive?
Sensitivity to outliersoriginal 10Skewness-1.1-1.550Kurtosis3.76.1012345678
boxplotboxplot(org) Box shows the lower quartile, median, and upper quartile values.Whiskers show the most extreme data within 1.5 timesinterquatile range (25th-75th percentile) from the ends of the box(25th, 75th percentile)Red signs: outlinersload carsmallboxplot(MPG,Origin)%MPG is a vector of numbers, Origin a vector of strings that define“group”
Box plot: group assignment {}sodium load('sodiumcontent.txt');sodium2 [sodium;0.1];data [sodium; sodium2];name(1:length(sodium)) {'original'};ed length(sodium);name(ed 1:ed length(sodium2)) {'outlier'};boxplot(data, name)
Statistical distribution Discrete probability distribution Continuous probability distributionf(t): PDF probability density functionF(x): CDF cumulative distribution function
Discrete distribution: Poissonλ and k are integers.
Continuous PDF: Boltzman
Gaussian (normal) distributions Parameters Mean Standard deviation PDFSyntaxY pdf(name, p1,.)Y cdf(name, p1, )name: distribution namepi: parameters for the distributionGuassianY pdf(‘norm’,data vector, mean,std)Y cdf(‘norm’,data vector, mean,std) CDFOrY normpdf(data vector, mean,std)Y normcdf(data vector, mean,std)
DistributionsBetaBinomialBirnbaum-SaundersBurr Type XIIChi-SquareExponentialExtreme ValueFGammaGeneralized ExtremeValueGeneralized ParetoGeometricHypergeometricInverse ve BinomialNoncentral FNoncentral tNoncentral Chi-SquareNormalPoissonRayleighRicianStudent's tt Location-ScaleUniform (Continuous)Uniform (Discrete)Weibull
Gaussian distribution 1 0; 1 0.2 2 2; 2 1 3 -2; 4 0.5 4 0; 4 3mu [0, 2, -2, 0];sig [0.2,1,0.5,3];x linspace(-5,5,100);for i 1:4xpdf(:,i) pdf('norm',x,mu(i),sig(i));xcdf(:,i) cdf('norm',x,mu(i),sig(i));endsubplot(2,1,1), plot(x,xpdf)subplot(2,1,2), plot(x,xcdf)
Gaussian distributionPDFCDF
Central limit theoremThe sum of a large number of independent and identicallydistributed random variables, each with finite mean andvariance, is approximately normally distributed.-the 2nd fundamental theorem of probabilityfor i 1:2000x rand(1000,1) 0.5;heads sum(x);tails 1000-heads;y(i) heads-tails;endhistogram(y)
If winning odds is 50%If winning odds is 45%
Can you afford going to Vegas?What are the probabilities of losing more than 50 and 100 if the winning odds is 50%?ymean mean(y)ystd ean,ystd)
Gaussian distributionVegas:n draws of 1 or -1 with awinning odds of pPoll:n samples of yes (1) or no (0)p: probability of yesTotal earn/lossmean: n*(p-(1-p))std: 2*sqrt(n*p*(1-p))Total votemean: n*pstd: sqrt(n*p*(1-p))The poll result:a Gaussian with a mean of pand a standard deviation ofsqrt(p*(1-p))/sqrt(n)
Polling uncertaintyA Gaussian distribution with a mean of p and a standard deviation ofsqrt(p*(1-p))/sqrt(n)(1)(2)If p 50% and 1,000 people are sampled, what is the 95thpercentile confidence interval of the polling result?If p 30% and 1,000 people are sampled, what is the 95thpercentile confidence interval of the polling 510.82.5%2.5%0.60.495%0.20-5-4-3-2-10123
Central limit theorem Let X1, X2, X3, . be a set of n independent and identicallydistributed (not necessarily normal) random variables havingfinite values of mean µ and variance σ2. As the sample size nincreases, the distribution of the sample average approaches thenormal distribution with a mean µ and variance σ2/n irrespectiveof the shape of the original distribution. The PDF of the sum of two or more independent variables is theconvolution of their densities (if these densities exist). Theconvolution of a number of density functions tends to the normaldensity as the number of density functions increases withoutbound, under the conditions stated above.
Gaussian distributionand(1)(2)(3)
Estimate of the errors Constant errorY Y 2X 1 X 2 . X nn n 22 2nWeighted errorwX Y ww ( w )iii2Y2i2i2iX N ( X , X 2 )Y N ( Y , Y 2 )aX N (a X , (a X ) 2 )X Y N ( X Y , X2 Y2 )
Propagation of error (normal distribution)
Central limit theoremThe log of a product of random variables thattake only positive values tends to have anormal distribution, which makes the productitself have a log-normal distribution.
Log-normal distributionIf Y is a random variable with a normaldistribution, then X exp(Y) has a log-normaldistributionPDFCDF
Log-normal distribution Ifandthen Y is a log-normally distributed variableas well Ifthen Y can be reasonably approximated byanother log-normal distribution.
Log-normal distributionmu [0, 0, 1, 1];sig [1/4,1/2,1,2];x linspace(0,3,100);for i 1:4xpdf(:,i) pdf('logn',x,mu(i),sig(i));xcdf(:,i) cdf('logn',x,mu(i),sig(i));endsubplot(2,1,1), semilogx(x,xpdf)subplot(2,1,2), semilogx(x,xcdf)
Atmospheric aerosol size distribution
Chi-squared distributionone of the most widely used in statistical significancetests.If Xi are k independent, normally distributed randomvariables with mean 0 and variance 1, then the randomvariableis distributed according to the chi-squared distribution
Chi-squared distribution PDF ( k is DOF)ifthen whereare N(μ,σ2),
F distribution U1 and U2 have chi-squared distributions with d1and d2 degrees of freedom respectively, andU1 and U2 are independent F-distribution is The F-distribution arises frequently as the nulldistribution in the analysis of variance
Student’s t-distribution The t-distribution is often used as an alternative tothe normal distribution as a model for data. It isfrequently the case that real data have heavier tailsthan the normal distribution allows for. The classicalapproach was to identify outliers and exclude ordownweight them in some way.
Student’s t-distribution Arises in the problem of estimating the mean of anormally distributed population when the samplesize is small (hence the standard deviation is notknown well). Suppose X1, ., Xn are independent randomvariables that are normally distributed with expectedvalue μ and variance σ2. DOF n-1 LetThen
Using the distributionScaled distribution with a mean of 0and a standard deviation of 1.If T were a Gaussian 123454510.82.5%2.5%0.60.495%0.20-5-4-3-2-10123
Exam schedule Exam #1: February 28 Q/A session: In class (February 23)
t-distributionA random sampling of screws gives weights30.02, 29.99, 30.11, 29.97, 30.01, 29.99Calculate a 95% confidence interval for thepopulation's mean weight.
t-distributionThe probability that x is greater than the confidenceinterval z /2 is (5%). X n z /2 Snn
t-distributionSince this statistic is normally distributed, and thus symmetric, theinterval -z /2 z z /2 is where z will have its value withprobabiliity 1- .Plugging in for z: x z /2 s z /2 ornx z /2 sn x z /2 snThis shows the confidence interval on µ at the 1- confidence level. This is a commonly used statisticfor estimation of the population mean. Often thelevel used is 95%, or 2 .
t-distributionFind the data value corresponding toprobability /2 cdf(‘t’, z /2, DOF) (forward)z /2 tinv( /2 , DOF) (invert)For Gaussian distributionz /2 norminv( /2, mean, std/sqrt(n))
t-distribution z /2 xs z /2 orz /2 tinv( /2 , DOF)nx z /2 sn x z /2 snx [30.02, 29.99, 30.11, 29.97, 30.01, 29.99]xmean mean(x)xstd std(x)n length(x)%t-value at 2.5% (5%/2), DOF n-1%t-distribution cdf is symmetricaltvalue abs(tinv(0.025,n-1))%low/high boundlow xmean-tvalue*xstd/sqrt(n)high xmean tvalue*xstd/sqrt(n)
Comparison to normal distribution%if the sample size is largexmean mean(x);xsig xstd/sqrt(n);tvalue abs(norminv(.025,0,1))xmean tvalue*xsigxmean-tvalue*xsig . or )t-distribution[29.963, 30.067]tvalue 2.57Normal dist[29.975, 30.055]tvalue 2
Student’s t and Guassian distributionstvalueAs the number of sampleincreases, the student-tdistribution value for 95%confidence intervalapproaches that ofGaussian.Number of samples
Statistical testing Null hypothesis is used to test differences intreatment and control groups, and the assumption atthe outset of the experiment is that no differenceexists between the two groups for the variable beingcompared."A statistically significant difference" simply meansthere is statistical evidence that there is a difference;it does not mean the difference is necessarily large,important or significant in the common meaning ofthe word.Confidence level:
Statistical testing The null hypothesis must be stated in mathematical/statisticalterms that make it possible to calculate the probability of possiblesamples assuming the hypothesis is correct.A test must be chosen that will summarize the information in thesample that is relevant to the hypothesis. In the example givenabove, it might be the numerical difference between the twosample means, m1 m2.The distribution of the test statistics is used to calculate theprobability sets of possible values (usually an interval or union ofintervals).Among all the sets of possible values, we must choose one thatwe think represents the most extreme evidence against thehypothesis. That is called the critical region of the test statistic.The probability of the test statistic falling in the critical regionwhen the null hypothesis is correct, is called the p value(“surprise” value) of the test.
Probability Frequency probability (frequentists) is the interpretation ofprobability that defines an event's probability as the limit of itsrelative frequency in a large number of trials. The problems andparadoxes of the classical interpretation motivated thedevelopment of the relative frequency concept of probability.Bayesian probability is an interpretation of the probabilitycalculus which holds that the concept of probability can bedefined as the degree to which a person (or community) believesthat a proposition is true. A posteriori is a function of a priori andobservations.The groups have agreed that Bayesian and Frequentist analysesanswer genuinely different questions, but disagreed about whichclass of question it is more important to answer in scientific andengineering contexts.
Pearson’s Chi-squared test The null hypothesis: the relative frequenciesof occurrence of observed events follow aspecified frequency distribution.Pearson's chi-squared is the original andmost widely-used chi-squared test.The test compares the difference betweeneach observed and theoretical frequency foreach possible outcome.
Pearson’s Chi-squared test DOG n-1whereOi an observed frequencyEi an expected (theoretical) frequencyn the number of possible outcomes of eachevent
Pearson’s Chi-squared test A chi-squared probability of 0.05 or less(alpha value, α 0.05) is commonly used forrejecting the null hypothesisCritics of α-values point out that the criterionused to decide "statistical significance" isbased on the somewhat arbitrary choice oflevel (often set at 0.05).
Pearson’s Chi-squared testA random sample of 100 people has been drawnfrom a population in which men and womenare equal in frequency. There were 45 menand 55 women in the sample, what is chisquared value?Probability in Chi-squared distribution: cdf(‘chi2’, value, DOF)Is this Chi-squared value within 95% of the distribution?cdf('chi2',1,1)
Pearson’s Chi-squared test What should weuse?10.90.80.7x linspace(0,8,100);v 0.1%cdf('chi2',1,1) 0.680012345678
chi2inv%chi2inv(probability, DOF)%the value exceeds 95% of the data withDOF 1chi2inv(0.95,1)if the chi2 values ch2inv(0.95,1), thehypothesis cannot be rejected.
Pearson’s Chi-squared test(1) Load organic matter data you downloaded ta/organicmatter one.txt ).(2) Compute the histogram for 8 bins. Save both the histogram valuesand bin location(3) Generate a synthetic dataset following Gaussian distribution withthe same mean and standard deviation as the organic matter dataset(4) Scale the distribution such that the sum of histogram values in thesynthetic dataset is the same as the organic matter dataset(5) Plot the two distributions(6) Compute the Ch2 values using(7) Compute the degree of freedom in the comparison(8) Compute the Chi2 value for 95% probability(9) Can the hypothesis that the dataset follows Gaussian be rejected?
Pearson’s Chi-squared testcorg load('organicmatter one.txt');% 60 data points, define 8 bins[n exp,v] hist(corg,8);% generate a synthetic datasetn syn pdf('norm',v,mean(corg),std(corg));%redistribute the n exp sumn syn n syn.*sum(n exp)/sum(n syn) ;subplot(1,2,1), bar(v,n syn,'r')subplot(1,2,2), bar(v,n exp,'b')
Pearson’s Chi-squared test%testchi2 sum((n exp - n syn). 2 ./n syn)%dof (# of bins - # of parameters – 1)%For Gaussian, # of parameters is 2, mean & stddof 8-3;%0.05 valuechi2inv(0.95,dof)
F-test The hypothesis: the standard deviations oftwo normally distributed populations areequal.DOF a na-1, b nb-1Test2saF 2sbF crit finv(0.95, DOF1,DOF2)where s s2a2b
F-testload('organicmatter four.mat');%compare stds1 std(corg1)s2 std(corg2)18161412108642%DOFdf1 length(corg1) - 1;df2 length(corg2) - 1;02223242526272829
F-testif s1 s2Freal (s1/s2) 2elseFreal (s2/s1) 2end%find the table value for 5% extreme, inv-f cdfFtable finv(0.95,df1,df2)
F-test
Student’s t-TestThe null hypothesis: The means of twodistributions are equal.Assumptions Normal distribution of data (What test touse?) Equality of variances (what test to use?)
Student’s t-TestFunctionX1 X 2t sX X12Matlab syntax[h,s,ci] ttest2(x,y,p-value)h: 1 rejects the null hypotheis;0 cannot rejects: significance for the differenceof the means between x and yci: confidence intervalp-value 0.05whereDOF of x1 and x2 is n1 n2- 2
Student’s t-Testload('organicmatter two.mat');12[n1,x1] hist(corg1);[n2,x2] hist(corg2);1086h1 bar(x1,n1);hold onh2 r')set(h2,'FaceColor','none','EdgeColor','b')hold off4202223242526272829
Student’s t-Test%difference of meanmean(corg1)-mean(corg2)%h 1 rejects the null hypothesis%significance: probability for the null hypothesis to be true%ci: 95% confidence interval on the difference of themeans (if there is no statistically significant difference)[h, significance, ci] ttest2(corg1,corg2,0.05)
Jarque-Bera test The Jarque–Bera test is a goodness-of-fit testof whether sample data have the skewnessand kurtosis matching a normal distribution.where n is the number of observations (ordegrees of freedom in general); S is thesample skewness, and K is the samplekurtosis
Kolmogorov-Smirnov test The Kolmogorov–Smirnov test (K–S test) is anonparametric test for the equality ofcontinuous, one-dimensional probabilitydistributions that can be used to compare asample with a reference probabilitydistribution (one-sample K–S test), or tocompare two samples (two-sample K–S test).“nonparametric” means that we do notassume a priori distribution of the data or apriori structure of the model.
Extreme value distributions(Black Swan Event)
Gaussian distribution?
Precipitation distribution
Extremal types theorem The maximum of a large number ofindependent identically distributed randomvariables is distributed like the Gumbel orFréchet or Weibull Distributionsindependently of the parent distribution
Extremal types distributions
Extremal type distributions WeibullA distribution with abounded upper tail.GumbelA distribution with alight upper tail andpositively skewed.FrechetA distribution with aheavy upper tail andinfinite higher ordermoments.
Calculation: Generalized Extreme Value(GEV) distribution Build BlocksDivide full dataset into equal sized chunks of datae.g. yearly blocks of 365/366 daily precipitationmeasurements Extract Block Maxima Determine the Max for each blockFit GEV to the Max and estimate X(T) Estimate parameters of a GEV fitted to the blockmaxima.Calculate the return value function X(T) and itsuncertainty.
Precipitation distribution
Return period: Risk communication Suppose that the cumulative probabilityof a given extreme event is p per yearThe return period is T 1/pAverage waiting time until next occurrenceof event is T yearsIf the cumulative probability ofprecipitation rate of 4 inch day-1 orhigher is 0.05, what is the returnperiod?
Extreme threshold distributions BetaA bounded distribution.ExponentialA light-taileddistribution with a"memoryless" property.ParetoA heavy-taileddistribution (sometimescalled "power law").
Weibull distributionβ is the shape parameter, also known as the Weibull slopeη is the scale parameterγ is the location parameter; often set to 0
Weibull scale parameter η If η is increased(decreased),while β and γ arekept the same, thedistribution getsstretched out to theright (left) and itsheight decreases
Weibull distribution
Weibull Shape Parameter β
Chapter 3. Univariate Statistics Empirical distributions Histograms Mean, Median, Quartiles, Variance, Skewness, Kurtosis Boxplot Statistical distributions Discrete distributions Continuous distributions Gaussian distribution and the central limit theorem Chi-squared, F, and Student's t- distributions